Global Land Evaporation Amsterdam Model (GLEAM)
The Global Land Evaporation Amsterdam Model (GLEAM) is a satellite remote sensing-based set of algorithms dedicated to the estimation of evaporation and soil moisture at global scales (Miralles et al. 2011). The current version of GLEAM (version 3) operates at a daily time step with a spatial resolution of 0.25 degrees (Martens et al. 2017). The dataset consists of two versions: (a) version A which spans a period from 1980 to near-present and is driven by a combination of satellite- and reanalysis-based forcings, (b) version B which spans from 2003 to near-present and is driven entirely by satellite-based forcing data. GLEAM simulates E as a summation of its constituents: transpiration (Et), bare-soil evaporation (Eb), open water evaporation (Ew), snow sublimation (Es), and interception loss (Ei).
Key Strengths
Gap-free, continuous record that makes extensive uses of passive microwave satellite observations
Consideration of soil moisture and vegetation water content as constraint on evaporation.
Partitioning into different evaporation components.
Key Limitations
The model performance is dependent on the quality of input data, especially in regions with limited availability of satellite and in situ data.
The model does not explicitly account for irrigation and is dependent on the assimilated satellite-based soil moisture data to capture irrigation signals.
The spatial resolution of the model prevents it from capturing landscape heterogeneity which is important for agricultural and water management applications.
Expert Developer Guidance
The following was contributed by Akash Koppa and Diego Miralles, May, 2023:
The Global Land Evaporation Amsterdam Model (GLEAM) is a satellite remote sensing-based set of algorithms dedicated to the estimation of evaporation and soil moisture at global scales (Miralles et al. 2011). The current version of GLEAM (version 3) operates at a daily time step with a spatial resolution of 0.25 degrees (Martens et al. 2017). The dataset consists of two versions: (a) version A which spans a period from 1980 to near-present and is driven by a combination of satellite- and reanalysis-based forcings, (b) version B which spans from 2003 to near-present and is driven entirely by satellite-based forcing data.
GLEAM simulates E as a summation of its constituents: transpiration (Et), bare-soil evaporation (Eb), open water evaporation (Ew), snow sublimation (Es), and interception loss (Ei). All the components are estimated for every grid cell of the model using a Priestley and Taylor-based formulation for potential evaporation. The Priestley and Taylor equation in GLEAM calculates potential evaporation based on observations of surface net radiation and temperature. Estimates of potential evaporation for the land fractions are converted into actual evaporation using a multiplicative evaporative stress factor based on observations of microwave vegetation water content (VOD) and estimates of root-zone soil moisture. The latter are calculated using a multi-layer running-water balance run with observed precipitation. To try to correct for random forcing errors, observations of surface soil moisture are also assimilated into the soil profile. Interception loss is calculated separately in GLEAM using a Gash analytical model (Miralles et al. 2010). Finally, estimates of actual evaporation for water bodies and regions covered by ice and/or snow are based on a modified Priestley and Taylor equation.
Over the last decade, estimates of evaporation and soil moisture from GLEAM have been validated against in situ measurements across a range of ecosystems. Results from Martens et al. (2017) show that average correlations against eddy-covariance measurements (91 stations) range between 0.78 and 0.81 for different GLEAM versions. GLEAM is different from other models that estimate evaporation as a residual of the energy balance, or derive it empirically from vegetation, temperature, and radiation data. Models similar to GLEAM include PT-JPL, which uses the Priestley and Taylor equation but does not use soil moisture and vegetation water content to constrain potential evaporation.
Strengths
1. Consideration of soil moisture and vegetation water content as constraint on evaporation.
2. Partitioning into different evaporation components.
3. Detailed parameterization of forest interception loss.
4. Extensive use of microwave observations, which provides an advantage under cloudy conditions.
5. Continuous records without gaps.
Weaknesses
6. The model performance is dependent on the quality of input data, especially in regions with limited availability of satellite and in situ data.
7. The model does not explicitly account for irrigation and is dependent on the assimilated satellite-based soil moisture data to capture irrigation signals.
8. The spatial resolution of the model prevents it from capturing landscape heterogeneity which is important for agricultural and water management applications.
Cite this page
Acknowledgement of any material taken from or knowledge gained from this page is appreciated:
Miralles, Diego &, Koppa, Akash & National Center for Atmospheric Research Staff (Eds). Last modified "The Climate Data Guide: Global Land Evaporation Amsterdam Model (GLEAM).” Retrieved from https://climatedataguide.ucar.edu/climate-data/global-land-evaporation-amsterdam-model-gleam on 2026-07-21.
Citation of datasets is separate and should be done according to the data providers' instructions. If known to us, data citation instructions are given in the Data Access section, above.
Acknowledgement of the Climate Data Guide project is also appreciated:
Schneider, D. P., C. Deser, J. Fasullo, and K. E. Trenberth, 2013: Climate Data Guide Spurs Discovery and Understanding. Eos Trans. AGU, 94, 121–122, https://doi.org/10.1002/2013eo130001
Key Figures
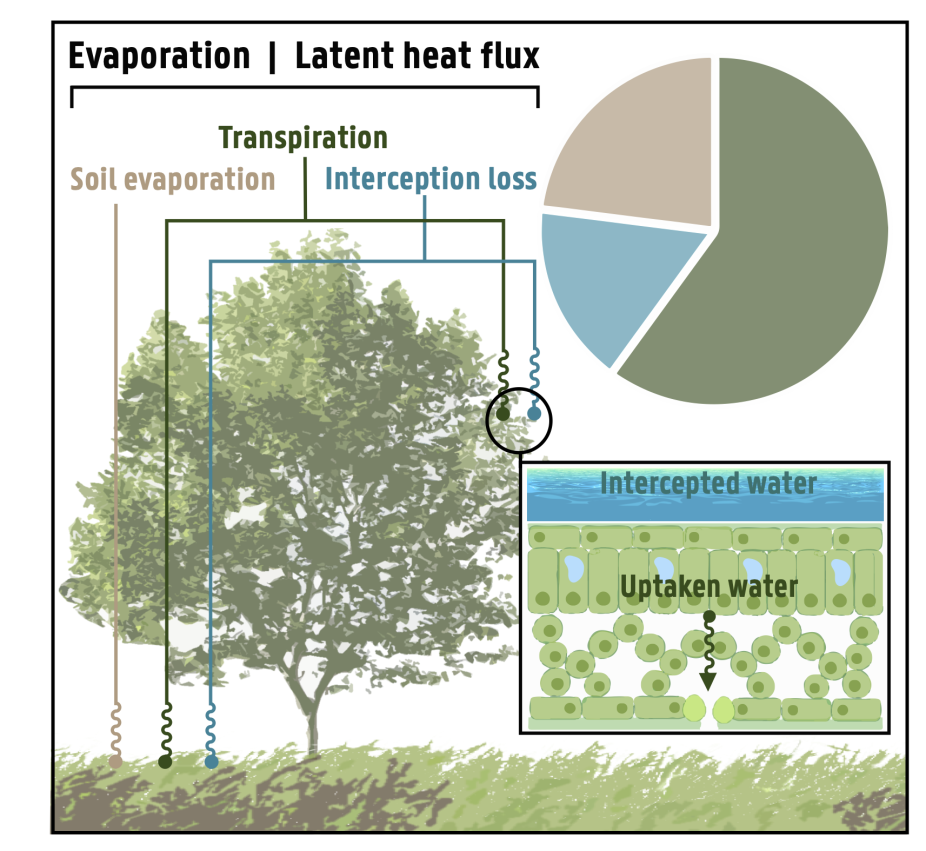
Figure 1: Main components of land evaporation. The pie chart indicates the approximated contribution by each of these three components globally. The bottom illustration shows a cross section of a wet leaf, with evaporation occurring inside the leaf (transpiration) and on its surface (interception loss). Evaporation from snow‐ and ice‐covered surfaces and the evaporation from water bodies (rivers, reservoirs, small lakes, etc.) is also considered as separate components in GLEAM. From Miralles et al. (2020).
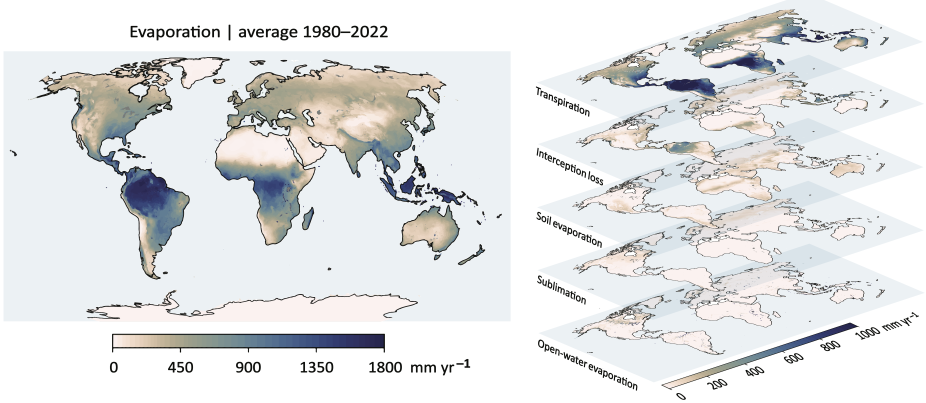
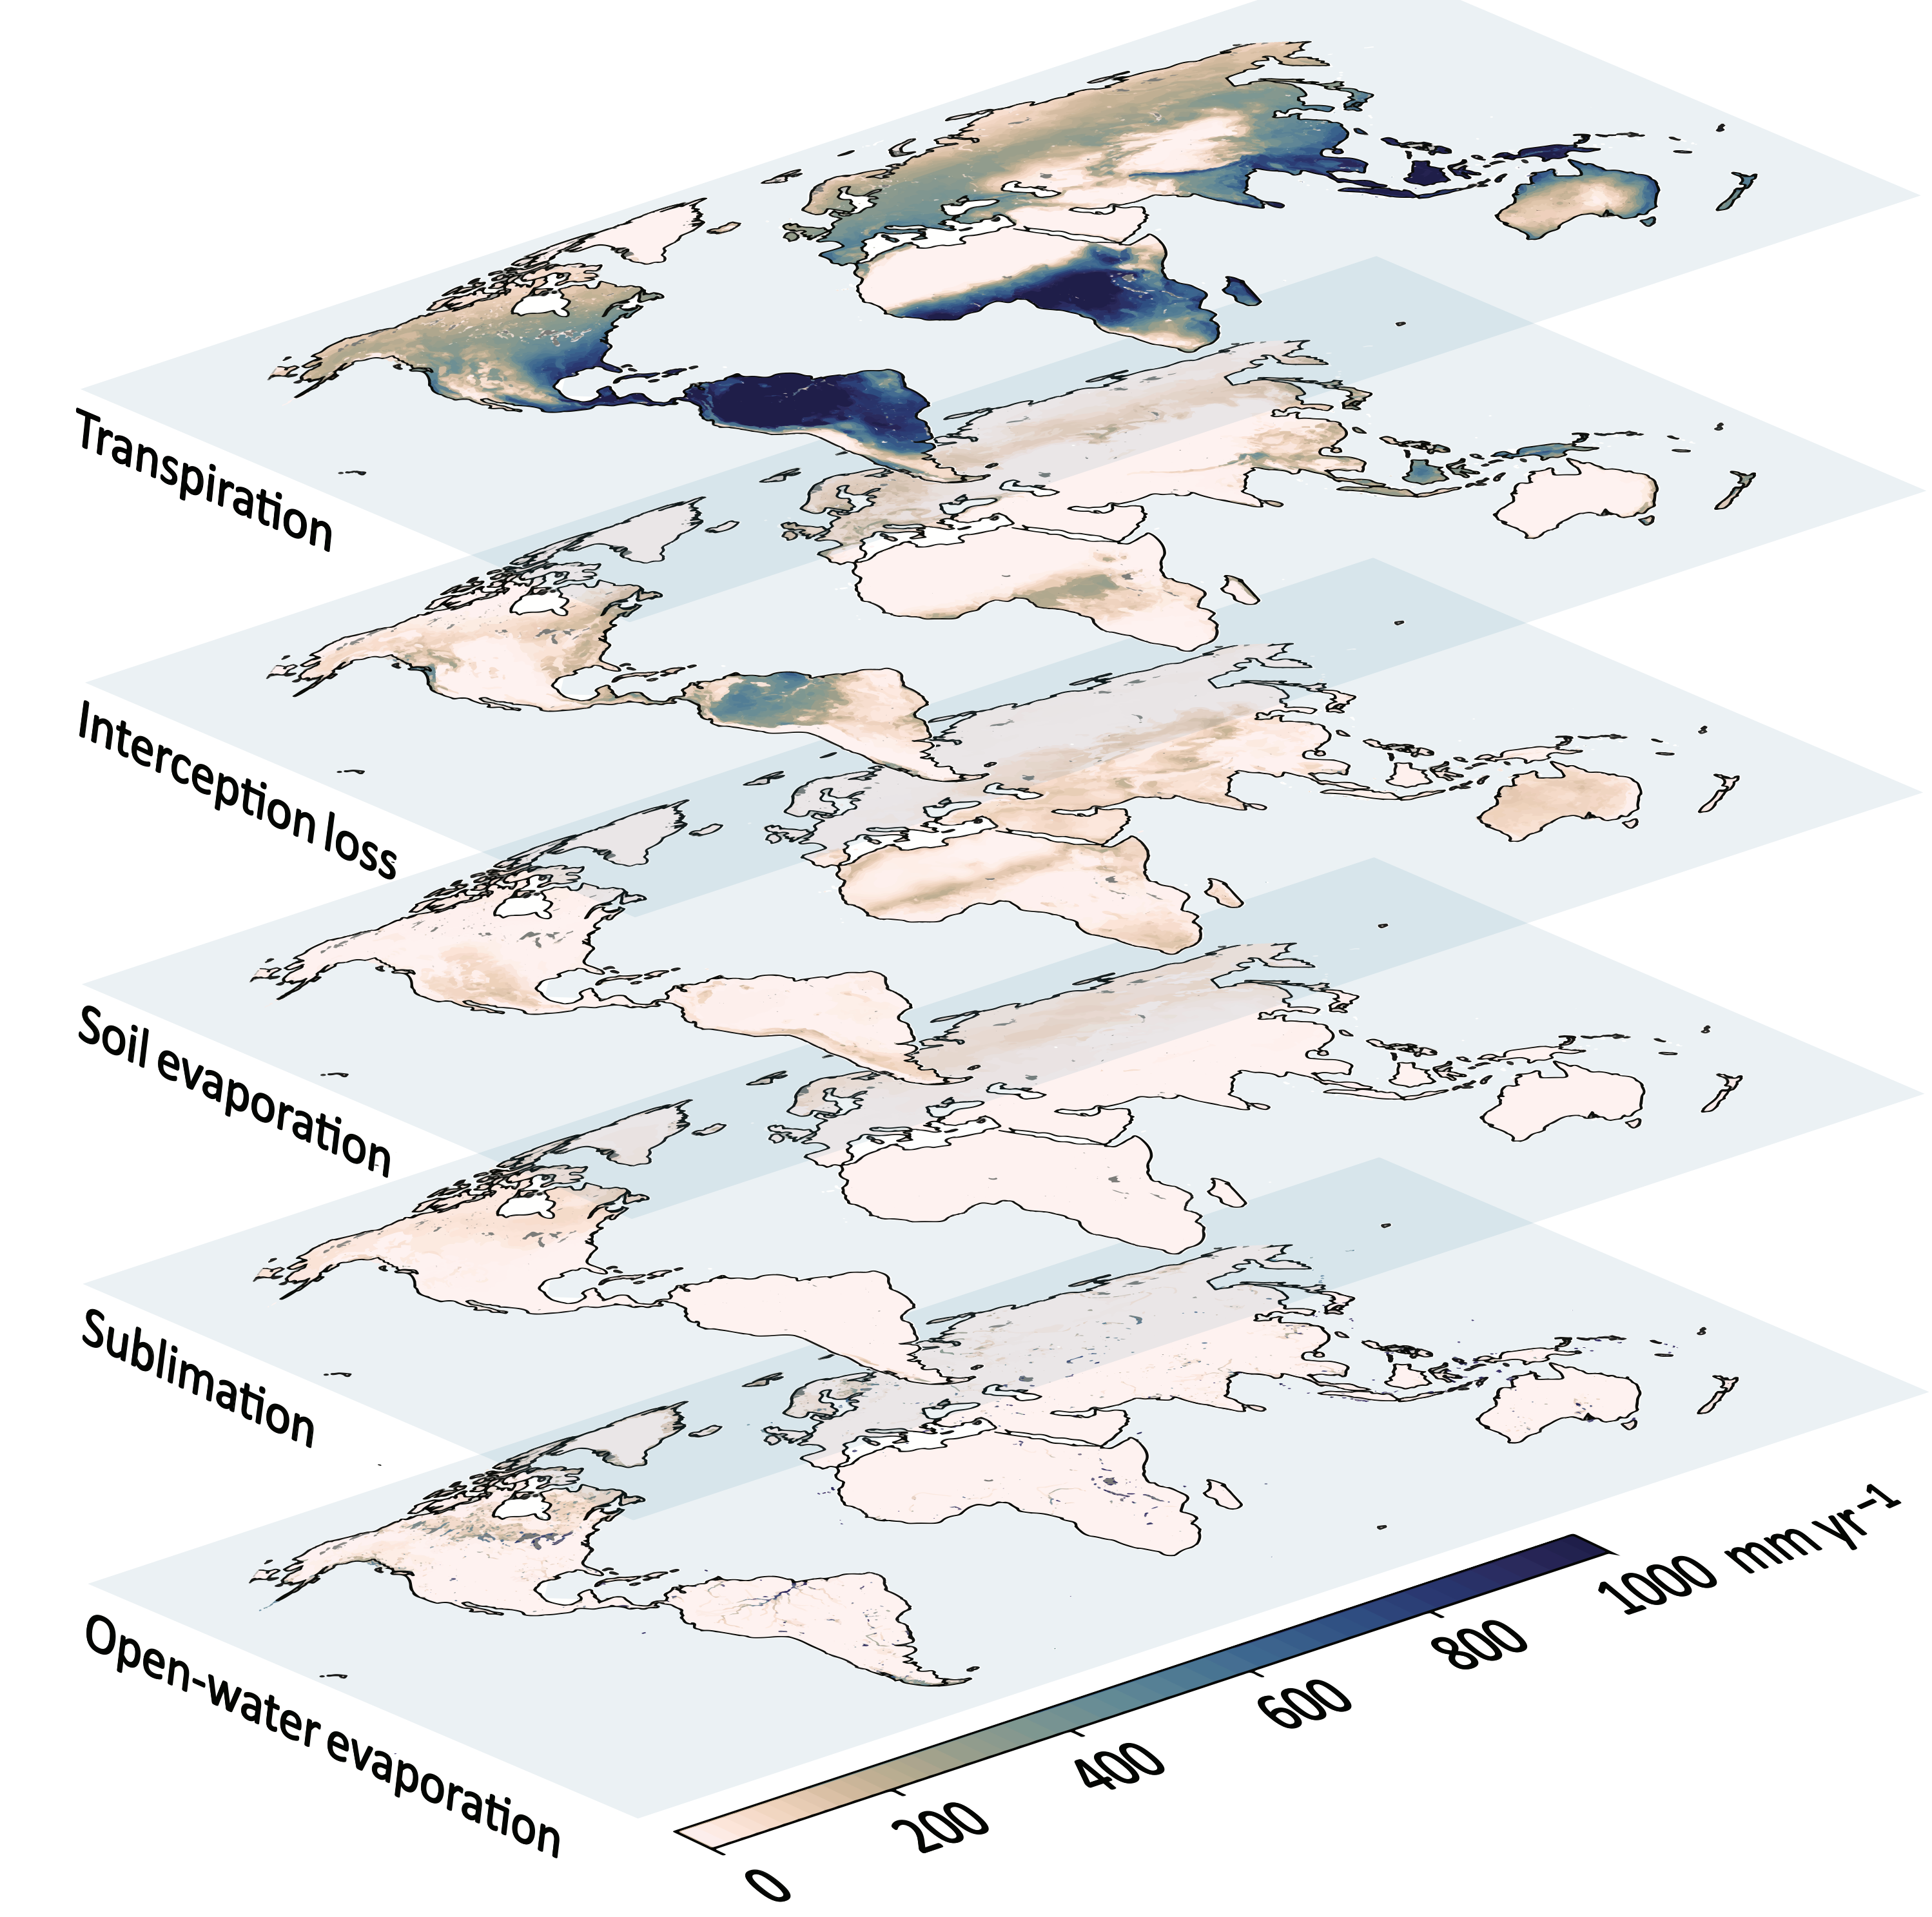
Figure 2: Mean land evaporation (mm yr–1) from GLEAM v3a based on the period 1980–2022. The right indicates the contribution from each of the different evaporation components. (contributed by A Koppa and D Miralles)
Other Information
- Martens, B., Miralles, D. G., Lievens, H., Schalie, R. van der, Jeu, R. A. M. de, Fernández-Prieto, D., Beck, H. E., Dorigo, W. A. & Verhoest, N. E. C. GLEAM v3: satellite-based land evaporation and root-zone soil moisture. Geosci Model Dev 10, 1903–1925
- Miralles, D. G., Gash, J. H., Holmes, T. R. H., Jeu, R. A. M. de & Dolman, A. J. Global canopy interception from satellite observations. J Geophys Res Atmospheres 1984 2012 115, D16122 (2010).
- Miralles, D. G., Holmes, T. R. H., Jeu, R. A. M. D., Gash, J. H., Meesters, A. G. C. A. & Dolman, A. J. Global land-surface evaporation estimated from satellite-based observations. Hydrol Earth Syst Sc 15, 453–469 (2011).
- Miralles, D. G., Brutsaert, W., Dolman, A. J. & Gash, J. H. On the Use of the Term “Evapotranspiration.” Water Resour Res 56, e2020WR028055 (2020).