Global Mean Sea Level from TOPEX & Jason Altimetry
The global mean sea level timeseries is an excellent, integrative indicator of long-term global temperature trends, providing a record that is observed and processed independent of common metrics like global surface air temperature. The major contributions to the observed sea level trend of 3.3 mm/year include the ocean's thermal expansion, meltwater from mountain glaciers, and discharge from the Greenland and Antarctic ice sheets. Interannual variability about the trends occurs due to ENSO and related climate processes. Measurements from the TOPEX/Poseidon and Jason series of satellite radar altimeters have been used to estimate global mean sea level height. These data are available for October, 1992 to present. Tide gauge sea level data have complementary strengths and weaknesses.
Key Strengths
Provide nearly continuous, broad spatial coverage
Less uncertainty in estimate of global mean sea level than provided by tide gauge data
Key Limitations
Short record, limited temporal context
Limited temporal resolution; repeat measurements only every 10 days as compared with minutes for tide gauge data
Must be corrected for satellite instrument drift, in addition to glacial isostatic rebound and atmospheric pressure
Nerem, R. S., D. Chambers, C. Choe, and G. T. Mitchum. "Estimating Mean Sea Level Change from the TOPEX and Jason Altimeter Missions." Marine Geodesy 33, no. 1 supp 1 (2010): 435
Expert User Guidance
The following was contributed by Dr. R.S. Nerem (University of Colorado), October, 2015:
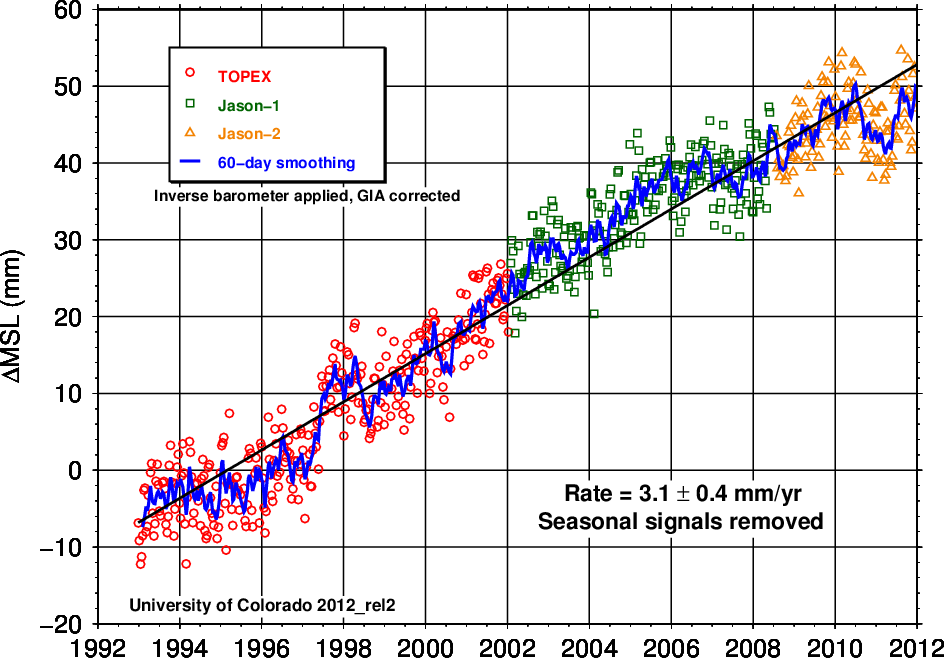
Since 1993, measurements from the TOPEX/Poseidon and Jason series (Jason-1, Jason-2, and soon, Jason-3) of satellite radar altimeter missions have allowed estimates of global mean sea level (e.g., sea surface height averaged globally over the planet). In practice, these measurements only cover ±66° latitude that is covered by the satellites. The groundtrack of these satellites repeats approximately every 10 days (9.9159 days), and thus estimates of global mean sea level are generally computed at that frequency. The raw altimeter measurements are corrected for the effects of troposphere delays (via microwave radiometer measurements made onboard the satellites), ionosphere delays (via the two-frequency Ku and C-band altimeter measurements), sea state, and a variety of other effects. In addition, models are used to remove the effects of changes in atmospheric pressure (the inverted-barometer correction), ocean tides, solid Earth tides, and a variety of other effects. There has been overlap between each mission (TOPEX/Poseidon to Jason-1, Jason-1 to Jason-2), and these overlaps are used to estimate biases between the missions and remove them. The accuracy of the altimeter measurements after applying these corrections and models is about 1-2 cm for a point measurement along the satellite groundtrack, but 10-day averages of these measurements to compute global mean sea level are generally accurate to about 4-5 mm due to the reduction of errors in the averaging. A correction for Glacial Isostatic Adjustment (GIA) is also applied (increasing the rate of global mean sea level by 0.3 mm/year) to account for an increase in the volume of the ocean basins since the end of the last glacial cycle. The 10-day estimates of global mean sea level contain variations with a period near 60-days (due to an error that is still being diagnosed), and thus 60-day smoothing of the 10-day estimates is often applied.
Global mean sea level is an excellent barometer of global temperature because many of the natural variations of sea level average out in the global mean. Nevertheless, interannual variations caused by ENSO and related process create variability about the trend with a standard deviation of ~4 mm. In combination with satellite gravity data (GRACE), one can parse out the major contributions to the observed 3.3 mm/year increase in global mean sea level (thermal expansion, Greenland, Antarctica, mountain glaciers). Measurements of global mean sea level are also available from tide gauges, but the errors are much larger because tide gauges don't uniformly sample the oceans in the same way that satellites do.
Because of the possibility of measurement drift after the satellites are launched (the onboard microwave radiometer is the most prone to drift), the altimeter sea surface height measurements are continuously compared against a global network of tide gauges in order to identify such drifts and address them in the data analysis. The accuracy of these tide gauge based drift estimates is about 0.4 mm/year (due primarily to errors in the vertical land motion at the tide gauges), and thus this is the dominant error source for estimates of the rate of sea level rise. A limitation of these data is that they only cover ±66° latitude, but the omission of higher latitudes has been shown to have only a small effect on the global mean sea level measurements.
Seasonal variations of global mean sea level are largely driven by 1) seasonal variations in the thermal expansion of the oceans, and 2) seasonal exchange of water between the land and the oceans. When seasonal variations are subtracted, they reveal a trend in global mean sea level (currently 3.3 ± 0.4 mm/year) plus variability largely associated with ENSO processes.
As new data, models and corrections become available, these estimates are continuously revised (about every two months) to improve their quality and the length of the time series (http://sealevel.colorado.edu/). Comparable data sets are available from NOAA and AVISO and are linked into this website.##
Cite this page
Acknowledgement of any material taken from or knowledge gained from this page is appreciated:
Nerem, R.S. & National Center for Atmospheric Research Staff (Eds). Last modified "The Climate Data Guide: Global Mean Sea Level from TOPEX & Jason Altimetry.” Retrieved from https://climatedataguide.ucar.edu/climate-data/global-mean-sea-level-topex-jason-altimetry on 2026-06-03.
Citation of datasets is separate and should be done according to the data providers' instructions. If known to us, data citation instructions are given in the Data Access section, above.
Acknowledgement of the Climate Data Guide project is also appreciated:
Schneider, D. P., C. Deser, J. Fasullo, and K. E. Trenberth, 2013: Climate Data Guide Spurs Discovery and Understanding. Eos Trans. AGU, 94, 121–122, https://doi.org/10.1002/2013eo130001
Key Figures
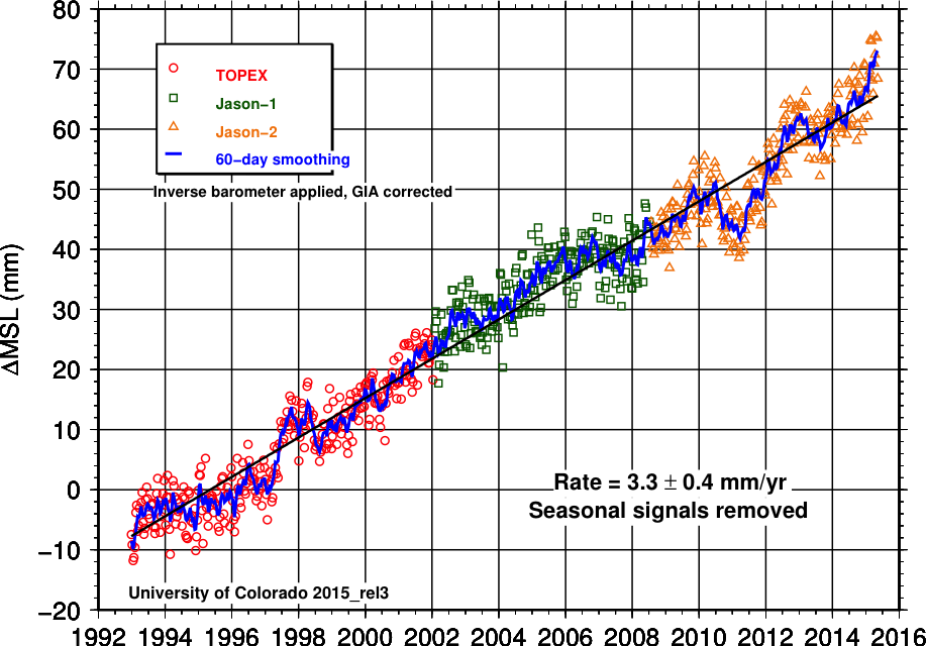
Global-mean sea level from satellite altimetry (contributed by R.S. Nerem)