Pan-Arctic Ice Ocean Modeling and Assimilation System (PIOMAS)

The Pan-Arctic Ice-Ocean Modeling and Assimilation System (PIOMAS) is a reanalysis data set that uses a coupled ice and ocean model to provide daily and monthly estimates of Arctic sea-ice thickness. The data is publicly available from January 1979 to in near-real time. The model is developed and maintained by the Polar Science Center (PSC) in the Applied Physics Laboratory (APL) department at the University of Washington.
PIOMAS is widely used by the climate science community for monitoring sea ice changes related to Arctic amplification, conducting climate sensitivity studies, validating statistical and dynamical simulations of sea ice, and in comparing new satellite-based products of sea- ice thickness. The reanalysis model has the capability to assimilate observed sea surface temperatures, sea-ice concentration, and sea-ice velocity information. PIOMAS is driven by atmospheric surface fields from daily mean NCEP-NCAR Reanalysis (Version 1). This data set can be used to address both internal variability and long-term trends in the Arctic. Alternative versions of the model have also been developed to simulate and evaluate Antarctic sea-ice thickness (GIOMAS) and reconstruct early 20th century Arctic sea-ice volume (PIOMAS-20C)
Key Strengths
Temporarily and spatially complete data set of Arctic sea-ice thickness since 1979
Well-validated with observed sea-ice thickness datasets for capturing interannual variability and recent climate trends
Commonly used data set for validating sea ice simulations from coupled climate models
Key Limitations
Modeled reanalysis data set and does not assimilate in situ observations or satellite-derived estimates of ice thickness
Tendency to overestimate thin ice thickness and underestimate thick ice
Long-term trends in ice thickness and volume from PIOMAS are sensitive to the choice of atmospheric reanalysis forcing
Schweiger, A., R. Lindsay, J. Zhang, M. Steele, H. Stern, Uncertainty in modeled arctic sea ice volume, J. Geophys. Res., https://doi.org/10.1029/2011JC007084, 2011
Zhang, Jinlun and D.A. Rothrock: Modeling global sea ice with a thickness and enthalpy distribution model in generalized curvilinear coordinates, Mon. Wea. Rev. 131(5), 681-697, 2003. doi
Expert User Guidance
The following was contributed by Zachary Labe, May, 2023:
PIOMAS is a coupled ice-ocean model assimilation system (Zhang and Rothrock , 2003) forced by the first generation (R1) of NCEP-NCAR reanalysis. Daily and monthly outputs from PIOMAS include a range of ice and ocean variables, but its primary use is for a spatially and temporally complete data set of modeled Arctic sea-ice thickness and volume. Processed data is available from flat binary files with no header or metadata information, but a list of software tools are available at http://psc.apl.uw.edu/research/projects/arctic- sea-ice-volume-anomaly/data/model grid to convert to more commonly used formats, such as netCDF. Data are updated in near-real time with an approximate lag of 15 to 30 days. The current release (as of May 2023) is Version 2.1.
PIOMAS uses the Parallel Ocean Program ocean model (Smith et al., 1992) with 30 vertical levels of varying depths, as developed by the Los Alamos National Laboratory. POP is coupled to a 12-category thickness and enthalpy distribution (TED) sea-ice model (Zhang and Rothrock , 2003), where ice mechanics follow a teardrop viscous plastic rheology as described in Zhang and Rothrock (2005) and a mechanical redistribution function for ice ridging (Hibler , 1980). The model also calculates a 12-category snow depth from a snow distribution conservation equation using Flato and Hibler (1995). PIOMAS is nested, one-way, within a global version of the model and uses a generalized orthogonal curvilinear coordinate system with a mean resolution of 22 km (4/5◦). The finite-difference grid centers the North Pole in the model over central Greenland with the highest resolution in the surrounding Greenland Sea, Baffin Bay and eastern Canadian Archipelago.
PIOMAS is forced by atmospheric reanalysis from NCEP-NCAR R1 including daily variables of 2 m surface air temperature, 10 m surface winds, specific humidity, precipitation, evaporation, sea level pressure, cloud fraction, and downwelling longwave radiation. Shortwave radiation is calculated using 2 m temperature and cloud fraction (Parkinson and Washington, 1979). It should be noted that ice-ocean models (like PIOMAS) do not have an atmospheric model component and therefore are subject to inaccuracies from the forcing reanalysis data (Hunke and Holland , 2007; Lindsay et al., 2014). PIOMAS has the capability of assimilating sea-ice concentration, sea-ice velocity (Lindsay and Zhang, 2006a), and sea surface temperature following the methods of Manda et al. (2005). But PIOMAS does not currently assimilate any sea-ice thickness data from satellites or mooring observations. Snow depth is estimated from NCEP-NCAR precipitation, and Lindsay and Schweiger (2015) estimate its uncertainty to be about 0.1 m.
PIOMAS has been extensively validated with satellite, submarine, airborne, and in situ observations and compared well for estimates of mean pan-Arctic sea-ice thickness and its regional pattern of spatial variability (e.g., Zhang and Rothrock , 2003; Schweiger et al., 2011; Laxon et al., 2013; Stroeve et al., 2014; Wang et al., 2016; Labe et al., 2018). Its seasonal cycle and long-term trends in ice volume and thickness are also realistically reproduced. PIOMAS ice motion has also been compared with data from the International Arctic Buoy Program with a mean estimated bias of -1% for daily ice speed (e.g., Zhang et al., 2012; Schweiger and Zhang , 2015). An extensive documentation of PIOMAS’s uncertainties is described in Schweiger et al. (2011), which found that the mean difference between PIOMAS and ICESat-1 thickness fields is approximately less than 0.1 m and showed a pattern corre- lation of greater than 0.8. The uncertainty around the long-term trend in PIOMAS sea-ice volume is estimated to be 1 × 10³ km3 decade−1 and about 0.75 × 10³ km3 decade−1 for the monthly ice volume anomaly. The downward long-term trend though may be a conservative estimate (Schweiger et al., 2011, 2019). Uncertainties for individual ice mass budget terms are documented by Ricker et al. (2021). Since PIOMAS is forced by atmospheric variables, its estimates of sea-ice thickness are constrained by the quality of atmospheric reanalysis data (Hunke and Holland , 2007; Lindsay et al., 2014). For instance, in a sensitivity experiment by Lindsay et al. (2014), they found a range of PIOMAS sea-ice volume trends when forced by four different global reanalysis data sets, especially before applying any model bias corrections. The range in September ice volume trends over 1980-2009 was found to be from −4.1 × 10³ km3 per decade using MERRA1 to −2.7 × 10³ km3 per decade using CFSR. Nevertheless, the spatial pattern of sea-ice thickness remained similar across all four reanalysis datasets. More recent analysis has also compared PIOMAS with data from ICESat-2, which again found good agreement overall but larger differences at smaller regional scales (Petty et al., 2023).
However, there are other known issues when using ice-ocean model products. As an example, Blanchard-Wrigglesworth and Bitz (2014) showed that these reanalysis products have damped variability due to their thermodynamic and dynamic mechanisms. This bias has been further documented where PIOMAS has a tendency to overestimate thin ice and underestimate thick ice in comparing different observational data sets during the satellite era (e.g., Schweiger et al., 2011; Wang et al., 2016; Labe et al., 2018). This can especially be a problem when resolving ice export in the Fram Strait and other outlets in the Canadian Arctic Archipelago. Since PIOMAS is not a fully coupled model, it will also not resolve air-sea-ice interactions that would be captured by an atmospheric model, such as in areas around polynyas or along coastlines. Finally, the southern latitudinal boundary for the PIOMAS model grid does exclude parts of the Sea of Okhotsk, the Gulf of St. Lawrence, and the Labrador Sea. Any differences in grid sizes need to be considered when calculating mean Northern Hemisphere sea-ice volume compared to other data products, particularly during the boreal winter when sea ice reaches its southernmost extent around the annual maximum.
Alternative model versions and configurations of PIOMAS are available for different applications in the fields of polar and climate sciences. For example, a 20th century reconstruction of Arctic sea-ice thickness and volume data is also available over the 1901 to 2010 period using a model called PIOMAS-20C, which is documented in Schweiger et al. (2019) and freely available at http://psc.apl.uw.edu/research/projects/piomas-20c/. September ice outlook forecasts are also regularly submitted to the Sea Ice Prediction Network using a seasonal forecast system version of PIOMAS together with four ensemble members from NCEP’s CFS (Zhang et al., 2008). The sensitivity of PIOMAS to future Arctic conditions has even been explored for the mid-21st century by forcing the atmospheric initial conditions using future climate model projections, rather than the standard NCEP-NCAR R1 (Zhang et al., 2010).
Similar to PIOMAS, Antarctic sea-ice thickness is available from the Global Ice-Ocean Modeling and Assimilation System (GIOMAS) at http://psc.apl.washington.edu/zhang/Global seaice/mod which is a coupled ice-ocean model similar to PIOMAS but using a global domain. Liao et al.(2022) found that the correlation between Antarctic sea-ice volume anomalies from GIOMAS and observations is estimated to be 0.83, and therefore they suggest that GIOMAS can be a suitable alternative for assessing long-term variability and trends in Antarctic sea-ice thickness.
In summary, PIOMAS compares well with observational (submarine and satellite) estimates of its mean pan-Arctic sea-ice thickness, long-term trends, and regional pattern of spatial variability. PIOMAS is frequently leveraged for monitoring long-term trends and variability of sea-ice thickness and volume in the era of recent Arctic amplification (e.g., Zhang , 2021). Some other suggested applications of PIOMAS data could be for validating the sea ice mean state in fully-coupled climate models from the Coupled Model Intercomparison Project (e.g. Watts et al., 2021), climate model bias correction (e.g.. Melia et al., 2015), training data for machine learning models (e.g., Zampieri et al., 2023), or for initializing hindcast experiments to better understand sea ice prediction systems (e.g., Collow et al., 2015). Additional variables provided by PIOMAS, such as sea ice advection and ocean heat flux terms, can also be used for studies addressing analysis of Arctic energy budgets or sea ice thermodynamics and kinematics (e.g., Ford et al., 2021). Applied regional studies have also used PIOMAS to better understand trends in multi-year sea ice, such as in the Last Ice Area of the Wandel Sea (e.g., Schweiger et al., 2021) or for quantifying the seasonal feasibility of Arctic shipping lanes in the Northeast Passage (e.g., Min et al., 2023). PIOMAS is even a popular monitoring data set for sea ice enthusiasts, such as by the Arctic Sea Ice Forum community. Despite all of these potential different applications, caution is advised when referring to PIOMAS as observed thickness, given it is a simulated reanalysis product that suffers known biases and substantial uncertainties. These uncertainties in output from PIOMAS are compounded by the choice of model physics, parameterizations, and atmospheric reanalysis forcing. Users are highly encouraged to include comparisons with satellite-derived thickness data when possible, especially for the period beginning with ICESat-1 and CryoSat- 2 (see https://climatedataguide.ucar.edu/climate-data/sea-ice-thickness-data-sets-overview-comparison-table).
Cite this page
Acknowledgement of any material taken from or knowledge gained from this page is appreciated:
Labe, Zachary & National Center for Atmospheric Research Staff (Eds). Last modified "The Climate Data Guide: Pan-Arctic Ice Ocean Modeling and Assimilation System (PIOMAS).” Retrieved from https://climatedataguide.ucar.edu/climate-data/pan-arctic-ice-ocean-modeling-and-assimilation-system-piomas on 2026-06-22.
Citation of datasets is separate and should be done according to the data providers' instructions. If known to us, data citation instructions are given in the Data Access section, above.
Acknowledgement of the Climate Data Guide project is also appreciated:
Schneider, D. P., C. Deser, J. Fasullo, and K. E. Trenberth, 2013: Climate Data Guide Spurs Discovery and Understanding. Eos Trans. AGU, 94, 121–122, https://doi.org/10.1002/2013eo130001
Key Figures
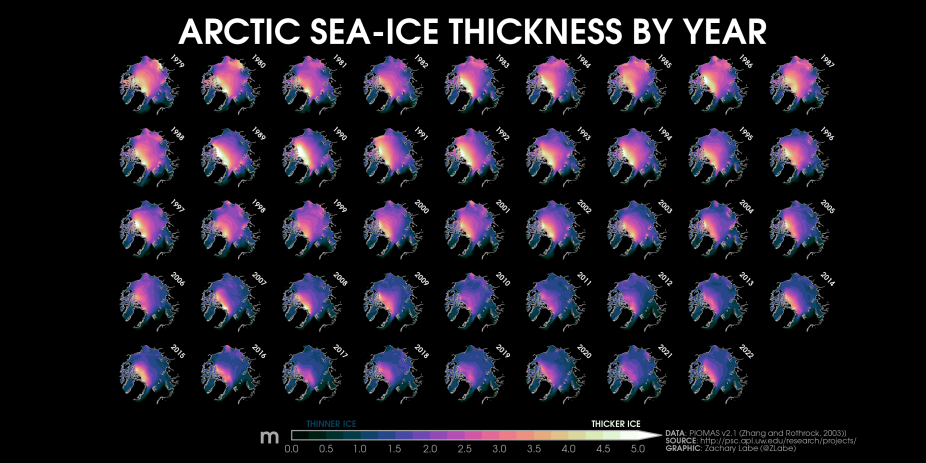
Figure 1: Composite maps of annual mean Arctic sea-ice thickness from 1979 to 2022. (contributed by Z. Labe)
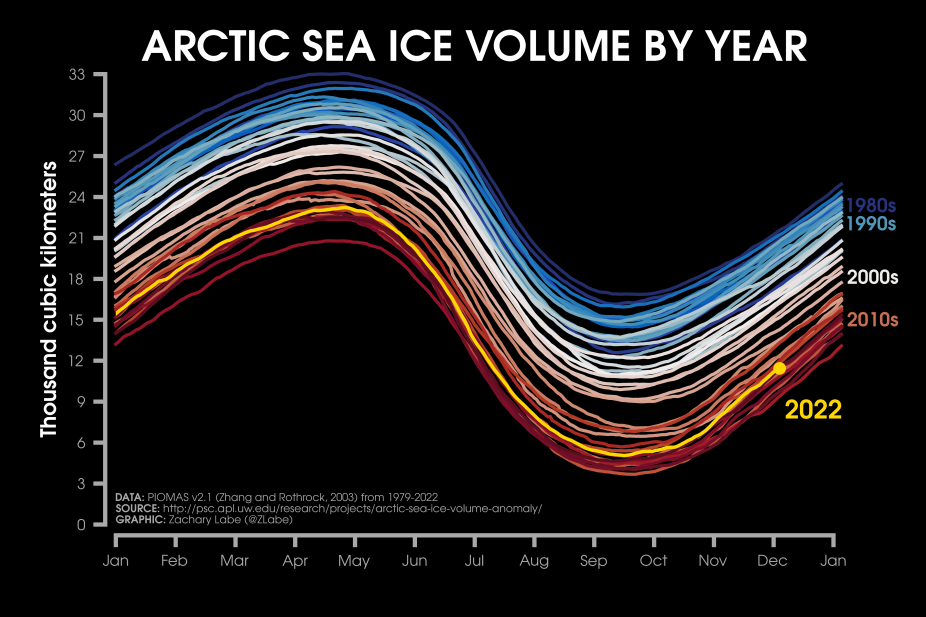
Figure 2: Daily Arctic sea ice volume from PIOMAS for each year from January 1, 1979 to November 30, 2022 using shades of blue to red in sequential order for every line. The decadal averages are annotated on the right side. (contributed by Z. Labe)
Other Information
- Blanchard-Wrigglesworth, E., and C. M. Bitz (2014), Characteristics of arctic sea-ice thick- ness variability in gcms, Journal of Climate, 27, 8244–8258, doi:10.1175/JCLI-D-14- 00345.1.
- Collow, T. W., W. Wang, A. Kumar, and J. Zhang (2015), Improving arctic sea ice predic- tion using piomas initial sea ice thickness in a coupled ocean-atmosphere model, Monthly Weather Review, 143, 4618–4630, doi:10.1175/MWR-D-15-0097.1.
- Flato, G. M., and W. D. Hibler (1995), Ridging and strength in modeling the thickness distribution of arctic sea ice, Journal of Geophysical Research, 100, doi:10.1029/95jc02091.
- Ford, V. L., O. W. Frauenfeld, C. J. Nowotarski, and R. J. Bombardi (2021), Effective sea ice area based on a thickness threshold, Climate Dynamics, 56, doi:10.1007/s00382-021- 05655-6.
- Hibler, W. D. (1980), Modeling a variable thickness sea ice cover., Monthly Weather Review, 108, doi:10.1175/1520-0493(1980)108(1943:MAVTSI)2.0.CO;2.
- Hunke, E. C., and M. M. Holland (2007), Global atmospheric forcing data for arctic ice-ocean modeling, Journal of Geophysical Research, 112, C04S14, doi:10.1029/2006JC003640.
- Labe, Z., G. Magnusdottir, and H. Stern (2018), Variability of arctic sea ice thickness using piomas and the cesm large ensemble, Journal of Climate, 31, 3233–3247, doi:10.1175/JCLI- D-17-0436.1.
- Laxon, S. W., K. A. Giles, A. L. Ridout, D. J. Wingham, R. Willatt, R. Cullen, R. Kwok, A. Schweiger, J. Zhang, C. Haas, S. Hendricks, R. Krishfield, N. Kurtz, S. Farrell, and M. Davidson (2013), Cryosat-2 estimates of arctic sea ice thickness and volume,
- Liao, S., H. Luo, J. Wang, Q. Shi, J. Zhang, and Q. Yang (2022), An evaluation of antarctic sea-ice thickness from the global ice-ocean modeling and assimilation system based on in situ and satellite observations, Cryosphere, 16, doi:10.5194/tc-16-1807-20
- Lindsay, R., and A. Schweiger (2015), Arctic sea ice thickness loss determined using sub- surface, aircraft, and satellite observations, The Cryosphere, 9, 269–283, doi:10.5194/tc- 9-269-2015.
- Lindsay, R., M. Wensnahan, A. Schweiger, and J. Zhang (2014), Evaluation of seven different atmospheric reanalysis products in the arctic*, Journal of Climate, 27, 2588–2606, doi: 10.1175/JCLI-D-13-00014.1.
- Lindsay, R. W., and J. Zhang (2006a), Arctic ocean ice thickness: Modes of variability and the best locations from which to monitor them*, Journal of Physical Oceanography, 36, 496–506, doi:10.1175/JPO2861.1.
- Lindsay, R. W., and J. Zhang (2006b), Assimilation of ice concentration in an ice–ocean model, Journal of Atmospheric and Oceanic Technology, 23, 742–749, doi:10.1175/ JTECH1871.1.
- Manda, A., N. Hirose, and T. Yanagi (2005), Feasible method for the assimilation of satellite- derived sst with an ocean circulation model, Journal of Atmospheric and Oceanic Tech- nology, 22, 746–756, doi:10.1175/JTECH1744.1.
- Melia, N., K. Haines, and E. Hawkins (2015), Improved arctic sea ice thickness projections using bias-corrected cmip5 simulations, The Cryosphere, 9, 2237–2251, doi:10.5194/tc-9- 2237-2015.
- Min, C., X. Zhou, H. Luo, Y. Yang, Y. Wang, J. Zhang, and Q. Yang (2023), Toward quantifying the increasing accessibility of the arctic northeast passage in the past four decades, Advances in Atmospheric Sciences, doi:10.1007/s00376-022-2040-3.
- Parkinson, C. L., and W. M. Washington (1979), A large-scale numerical model of sea ice, Journal of Geophysical Research, 84, 311, doi:10.1029/JC084iC01p00311.
- Petty, A. A., N. Keeney, A. Cabaj, P. Kushner, and M. Bagnardi (2023), Winter arctic sea ice thickness from icesat-2: upgrades to freeboard and snow loading estimates and an assessment of the first three winters of data collection, Cryosphere, 17, doi:10.
- Ricker, R., F. Kauker, A. Schweiger, S. Hendricks, J. Zhang, and S. Paul (2021), Evidence for an increasing role of ocean heat in arctic winter sea ice growth, Journal of Climate, 34, doi:10.1175/JCLI-D-20-0848.1.
- Schweiger, A., R. Lindsay, J. Zhang, M. Steele, H. Stern, and R. Kwok (2011), Uncertainty in modeled arctic sea ice volume, Journal of Geophysical Research, 116, C00D06, doi: 10.1029/2011JC007084.
- Schweiger, A. J., and J. Zhang (2015), Accuracy of short-term sea ice drift forecasts using a coupled ice-ocean model, Journal of Geophysical Research: Oceans, 120, doi:10.1002/ 2015JC011273.
- Schweiger, A. J., K. R. Wood, and J. Zhang (2019), Arctic sea ice volume variability over 1901–2010: A model-based reconstruction, Journal of Climate, 32, 4731–4752, doi:10. 1175/JCLI-D-19-0008.1.
- Schweiger, A. J., M. Steele, J. Zhang, G. W. Moore, and K. L. Laidre (2021), Accelerated sea ice loss in the wandel sea points to a change in the arctic’s last ice area, Communications Earth and Environment, 2, doi:10.1038/s43247-021-00197-5.
- Smith, R. D., J. K. Dukowicz, and R. C. Malone (1992), Parallel ocean general circulation modeling, Physica D, 60, 38–61.
- Stroeve, J., A. Barrett, M. Serreze, and A. Schweiger (2014), Using records from submarine, aircraft and satellites to evaluate climate model simulations of arctic sea ice thickness, The Cryosphere, 8, 1839–1854, doi:10.5194/tc-8-1839-2014.
- Wang, X., J. Key, R. Kwok, and J. Zhang (2016), Comparison of arctic sea ice thickness from satellites, aircraft, and piomas data, Remote Sensing, 8, 713, doi:10.3390/rs8090713.
- Watts, M., W. Maslowski, Y. J. Lee, J. C. Kinney, and R. Osinski (2021), A spatial evaluation of arctic sea ice and regional limitations in cmip6 historical simulations, Journal of Climate, 34, doi:10.1175/JCLI-D-20-0491.1.
- Zampieri, L., G. Arduini, M. Holland, S. Keeley, K. Mogensen, M. D. Shupe, and S. Tietsche (2023), A machine learning correction model of the winter clear-sky temperature bias over the arctic sea ice in atmospheric reanalyses, Monthly Weather Review, doi:
- Zhang, J. (2021), Recent slowdown in the decline of arctic sea ice volume under increasingly warm atmospheric and oceanic conditions, Geophysical Research Letters, 48, doi:10.1029/ 2021GL094780.
- Zhang, J., and D. A. Rothrock (2003), Modeling global sea ice with a thickness and enthalpy distribution model in generalized curvilinear coordinates, Monthly Weather Review, 131, 845–861, doi:10.1175/1520-0493(2003)131(0845:MGSIWA)2.0.CO;2.
- Zhang, J., and D. A. Rothrock (2005), Effect of sea ice rheology in numerical investigations of climate, Journal of Geophysical Research: Oceans, 110, doi:10.1029/2004JC002599.
- Zhang, J., M. Steele, R. Lindsay, A. Schweiger, and J. Morison (2008), Ensemble 1-year predictions of arctic sea ice for the spring and summer of 2008, Geophysical Research Letters, 35, doi:10.1029/2008GL033244.
- Zhang, J., M. Steele, and A. Schweiger (2010), Arctic sea ice response to atmospheric forcings with varying levels of anthropogenic warming and climate variability, Geophysical Research Letters, 37, doi:10.1029/2010GL044988.
- Zhang, J., R. Lindsay, A. Schweiger, and I. Rigor (2012), Recent changes in the dynamic properties of declining arctic sea ice: A model study, Geophysical Research Letters, 39, doi:10.1029/2012GL053545.