QuikSCAT: near sea-surface wind speed and direction
The QuikSCAT mission was intended to obtain sea-surface wind speed and direction data under all weather and cloud conditions over Earth's oceans. SeaWinds, an active radar scatterometer, is the main instrument on the QuikSCAT satellite. The microwave backscatter measured by SeaWinds is dependent on the surface roughness of the ocean, which in turn is related to wind stress. QuikSCAT data provide high spatial and temporal resolution, near global coverage and extensive validation. Some limitations include the prescence of rain-contaminated measurements, uneven daily sampling, and the short temporal record. QuikSCAT, launched in June 1999, remained fully operational until November 2009 when the primary instrument (SeaWinds) antenna stopped rotating due to a mechanical failure of the antenna spin mechanism. (The RapidSCAT instrument aboard the space station is planned to provide a replacement for QuikSCAT beginning in 2014... more info).
Level 3 gridded data are distributed by Remote Sensing Systems at daily, 3-day and monthly resolution on a 0.25 degree grid. A separate team at the Jet Propulsion Laboratory has processed a gridded product on a 1-degree grid for the obs4MIPS project.
Key Strengths
Key Limitations
- High resolution data (0.25°x0.25°, daily, 3-day; monthly) via Remote Sensing Systems
- Browse Images and Documentation at Remote Sensing Systems
- 1°x 1° monthly wind speed, meridional vectors, and zonal vector data files available in netCDF via JPL Physical Oceanography DAAC
- 1°x 1° monthly wind data sets via obs4MIPS CMIP5 distribution
Expert Developer Guidance
The following was contributed by Lucrezia Ricciardulli of Remote Sensing Systems, August, 2013:
Brief overview of QuikSCAT mission
The NASA scatterometer QuikSCAT operated from June 1999 until Nov 2009 and provided accurate satellite measurements of ocean surface wind speed and direction. QuikSCAT swath has a width of 1800 Km, and covers 90% of the global ocean surface in a day, with 14 orbits per day.
Ocean Vector Winds: Retrieval methodology
Scatterometers are active instruments, which emit microwave (MW) radiation towards the Earth and measure the signal backscattered by the ocean surface. The backscattered signal depends on the ocean surface roughness (related to wind stress). By combining multiple scatterometer views at any specific location over the Earth it is possible to retrieve the ocean surface wind speed and direction for that location, averaged over the scatterometer footprint size (10-50 km). The wind vector retrievals are produced by inverting a semi-empirical Geophysical Model Function (GMF) which relates the backscatter signal to 10m wind speed, wind direction relative to the scatterometer azimuth angle, scatterometer Earth incidence angle, MW signal polarization, and frequency. The inverted GMF provides 2 to 4 possible wind direction solutions; the most likely solution is selected by using an ambiguity removal algorithm, typically based on a MLE (Maximum Likelihood Estimator).
QuikSCAT Data Availability
For QuikSCAT, more than one dataset is available to the scientific community. They are produced by different institutions for different purposes, often using different GMFs, ambiguity removal methods, and quality control (i.e. a Near-Real-Time operational product for weather forecasts or data assimilation, or a delayed but more quality-controlled product for climate research).
The operational QuikSCAT product was produced by Freilich and Vanhoff at NASA JPL, using a GMF named QSCAT1. This product is archived as swath or gridded data at PO.DAAC.
Here we describe in detail the QuikSCAT wind vector data produced and distributed by Remote Sensing Systems.
Data Reprocessing (RSS QuikSCAT V4)
Despite the end of the QuikSCAT mission in 2009, the complete QuikSCAT dataset has been recently reprocessed at RSS in order to improve wind retrievals at high winds. When the algorithm for the original RSS QuikSCAT GMF (Ku-2001) was developed (Wentz and Smith, 1999), there was limited knowledge about what ground truth to use for calibrating high wind speeds above 20 m/s. A new GMF named Ku-2011 (Ricciardulli and Wentz, 2011a) has been recently developed by using 7 years of QuikSCAT backscatter measurements calibrated with the WindSat radiometer wind retrievals, which are considered to be accurate at least up to 30 m/s, even in rain (Meissner and Wentz, 2009).
The reprocessed RSS QuikSCAT V4 ocean vector wind retrievals were released in April 2011. The main motivations for the reprocessing were to strive for high-quality QuikSCAT retrievals at all wind regimes and to use the 10-yr QuikSCAT dataset as a calibration standard for climate-quality ocean surface wind speed retrievals from other satellite measurements. The new GMF Ku-2011 was also used in the newly reprocessed JPL QuikSCAT V3.
File format:
The complete dataset, from June 1999 to November 2009, is available as swath (L2B) and gridded data (L3). The files include retrievals of wind speed and direction over the global oceans, in ice-free regions. Data are written in binary form. FORTRAN, IDL, and MatLab routines to read the data are provided.
User support:
Data and reading routines are available via ftp ftp://ftp.ssmi.com/qscat/bmaps_v04/.
Data can be browsed and downloaded at http://www.remss.com/qscat/qscat_browse.html, where a detailed description of the QuikSCAT dataset is also provided. User support can be reached at support@remss.com.
Swath data:
The swath data, also known as orbital files, consists of single-orbit files of wind retrievals (wind speed, wind direction, quality flags, radiometer colocated rain, time of observation and additional ancillary information about the retrievals), with data organized into wind vector cells, 76 across the orbit and 1624 rows of cells along the orbit. The full mission is covered by 54000 swath files.
These files are useful for studies requiring the highest quality of retrievals, as the retrievals in each wind vector cell are not averaged over time, and the quality flags can be evaluated by the user to select retrievals with the desired quality level. The time of observation for each wind vector cell allows using these data for precise colocations with other satellite or in-situ retrievals.
Daily gridded maps
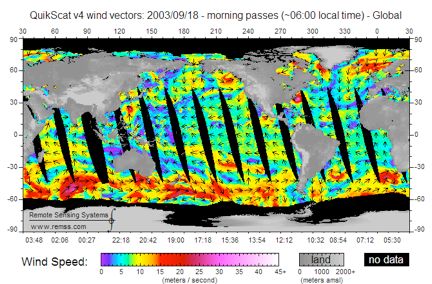
The gridded data, also called bytemaps, consist of daily gridded global maps at 0.25 deg resolution. Each daily file contains a map for ascending passes of the 14 daily orbits, and one for the descending ones. We keep the passes separated to avoid averaging over a time window of 12 hours. For adjacent orbits overlapping at high latitudes or at the beginning/end of the day, early retrievals are overwritten with later ones; i.e. they are not averaged over different orbits. Each daily map has data gaps in between the orbits (Figure 1). Additionally, small data gaps might be present at times due to bad quality or missing data due to the sensor being temporarily turned off. Gridded data are encoded in single byte values. Each data file contains a sequence of byte maps, each representing the Earth at quarter degree resolution, 1440 x 720 bytes. In addition to the wind speed and direction at each grid point, the files include a scatterometer rain-flag, a colocated radiometer rain measurement (when available), and the time of the observation.
Time composites gridded maps
In addition to daily gridded maps, RSS also provides 3-day, weekly, and monthly average gridded maps, at 0.25 resolution. For these composite maps, the observations are averaged over time and over different orbits. Some data gaps might still be present in 3-day averages, and occasionally even in weekly and monthly maps.
Key strengths:
- Longest continuous satellite record of ocean vector winds, from 1999 to 2009.
- Unaffected by satellite drifts and other spurious biases, as the retrieval is based on a ratio rather than an absolute quantity.
- Wide satellite swath, 90% global coverage in a day.
- High accuracy and low uncertainty in wind speed up to 30 m/s, for rain-free measurements.
- High accuracy and low uncertainty in wind direction for moderate to high winds, even in storm conditions.
- Intercalibrated with the RSS radiometers wind speeds, version V7.
- Good spatial resolution, of the order of 25 Km.
- Wind measurements in tropical and extra-tropical storms (Figures 2-3).
- Extensively validated.
- Binary files are quickly and easily accessible.
- Prompt customer support.
Key limitations:
- Ocean-only observations, not over land.
- Rain signal affects the QuikSCAT measurements because of backscatter of rain droplets, increased atmospheric attenuation and splash effect of rain droplets over the ocean surface. These effects can cause either positive and negative biases relative to true “wind” signal, they are difficult to model and cannot be easily removed. Therefore wind vector observations in rain conditions might be biased high at low winds, and low at high winds. The bias is proportional to rain intensity. Wind speeds between 15-25 m/s are less affected by these biases as the negative and positive effects balance at this wind regime. Wind direction retrievals in rain are also contaminated by rain signal, and might show a tendency of orienting the wind vectors in a direction perpendicular to the satellite track. Some of these rain-signal effects can be seen in Figure 3. Wind vector measurements are provided in the files even under rain, as for some application it might be beneficial not to have a gap in data and have observations, even if they might be slightly biased. For other applications that require high accuracy, we recommend ignoring wind observations in rain by using the rain flags provided in the files. Obviously, this will result in a loss of data for the region affected by rain. It is up to users to decide the level of accuracy required for their specific application.
- Satellite Sampling: As with other satellite dataset, the user needs to bear in mind that a daily map covers only 90% of the globe, and is the result of composing 14 ascending and 14 descending sun-synchronous orbital passes, therefore observing each location once or twice a day. For QuikSCAT the ascending (descending) passes refer to about 6am (6pm) local time. Therefore, a daily gridded QuikSCAT map is not strictly comparable to the daily average output from a numerical model. However, in most cases the daily maps will be very similar.
- Data record is probably too short for many types of climate trend analysis. A longer satellite record of ocean surface winds, perhaps more suitable for trend analysis, is provided by the suite of radiometers SSM/I and SSMIS (starting in 1987 and ongoing). However, radiometers measure only the wind speed at the ocean surface, not the direction. QuikSCAT V4 has been intercalibrated with the RSS radiometer winds (version V7) and, when colocated, there is no spurious trend between the two types of measurements.
Typical applications: Physical oceanography, storm research, data assimilation, climate research; calibration/validation of other satellite products. When operational, QuikSCAT was ingested in several numerical weather forecast models, and for used storm tracking (http://www.remss.com/hurricane/data_archive.html).
Common user’s mistakes:
Scientists should use the rain-flag and radiometer rain rates to help remove rain effects from the data files when using the data for research. The most common mistake is not to flag the rain-contaminated data. Another common mistake is to compare global averages from the monthly composites to global averages from a model. Due to the satellite sampling, a monthly average from satellite data refers only to the location and time observed by the sensor; therefore systematic differences of a few tenths of one m/s compared to monthly maps from numerical models are not unexpected. Figure 2 illustrates the monthly wind timeseries for QuikSCAT compared to NCEP data, for the global ocean or properly colocated with QuikSCAT at the swath level. If the QuikSCAT data are used for climate research and trend comparisons with other datasets, the comparison dataset has to be colocated within few hours to the QuikSCAT measurements. For this purpose we advise using the swath data and applying the quality flags at the highest level (rain-flags and retrieval quality). We do not recommend using the time composites (weekly-monthly gridded maps) for climate research, as they were created without applying strict quality checks and rain-flagging.
Characterization of uncertainties:
An extensive validation of the RSS QuikSCAT V4 wind data has been performed, by comparing the QuikSCAT retrievals to in situ measurements (buoys, aircraft), other satellite retrievals, and output from numerical weather models and data assimilation models (Ricciardulli and Wentz, 2011a; Ricciardulli and Wentz, 2011b). The wind speed uncertainty for rain-free retrievals, expressed as standard deviation of the individual satellite measurements within 30 minutes of buoy measurements, is about 0.9 m/s, without any bias. The wind speed uncertainty decreases to less than 0.1 m/s when data are averaged globally and at a monthly time scale. The wind direction RMS for moderate to high winds (above 6 m/s) is about 10 degrees. At lower wind speeds, the wind direction uncertainty increases up to 20-30 degrees.
Another characterization of uncertainty is related to the MLE estimator, and is provided in the swath data files at each wind vector cell. The quantity provided is a normalized rms after-the-fit residual of the observation minus model backscatter. Large residual values indicate the observations did not fit the geophysical model function, and when aiming at high-quality measurements with high values of MLE should be discarded.
Corrections applied
There are no corrections applied to this dataset.
Stability of the 10-yr temporal record
Scatterometers as QuikSCAT are active instruments, and they are inherently stable sensors in that they measure a ratio (backscattered radiation versus transmitted radiation) as compared to measuring as absolute quantity. For this reason scatterometer timeseries are not usually affected by satellite drifts or issues that affect the temporal stability of the time series.
Aknowledgements:
Research and development of the RSS QuikSCAT winds was supported by NASA Physical Oceanography, Ocean Vector Wind Science Team.##
Cite this page
Acknowledgement of any material taken from or knowledge gained from this page is appreciated:
Ricciardulli, Lucrezia & National Center for Atmospheric Research Staff (Eds). Last modified "The Climate Data Guide: QuikSCAT: near sea-surface wind speed and direction.” Retrieved from https://climatedataguide.ucar.edu/climate-data/quikscat-near-sea-surface-wind-speed-and-direction on 2026-02-11.
Citation of datasets is separate and should be done according to the data providers' instructions. If known to us, data citation instructions are given in the Data Access section, above.
Acknowledgement of the Climate Data Guide project is also appreciated:
Schneider, D. P., C. Deser, J. Fasullo, and K. E. Trenberth, 2013: Climate Data Guide Spurs Discovery and Understanding. Eos Trans. AGU, 94, 121–122, https://doi.org/10.1002/2013eo130001
Key Figures
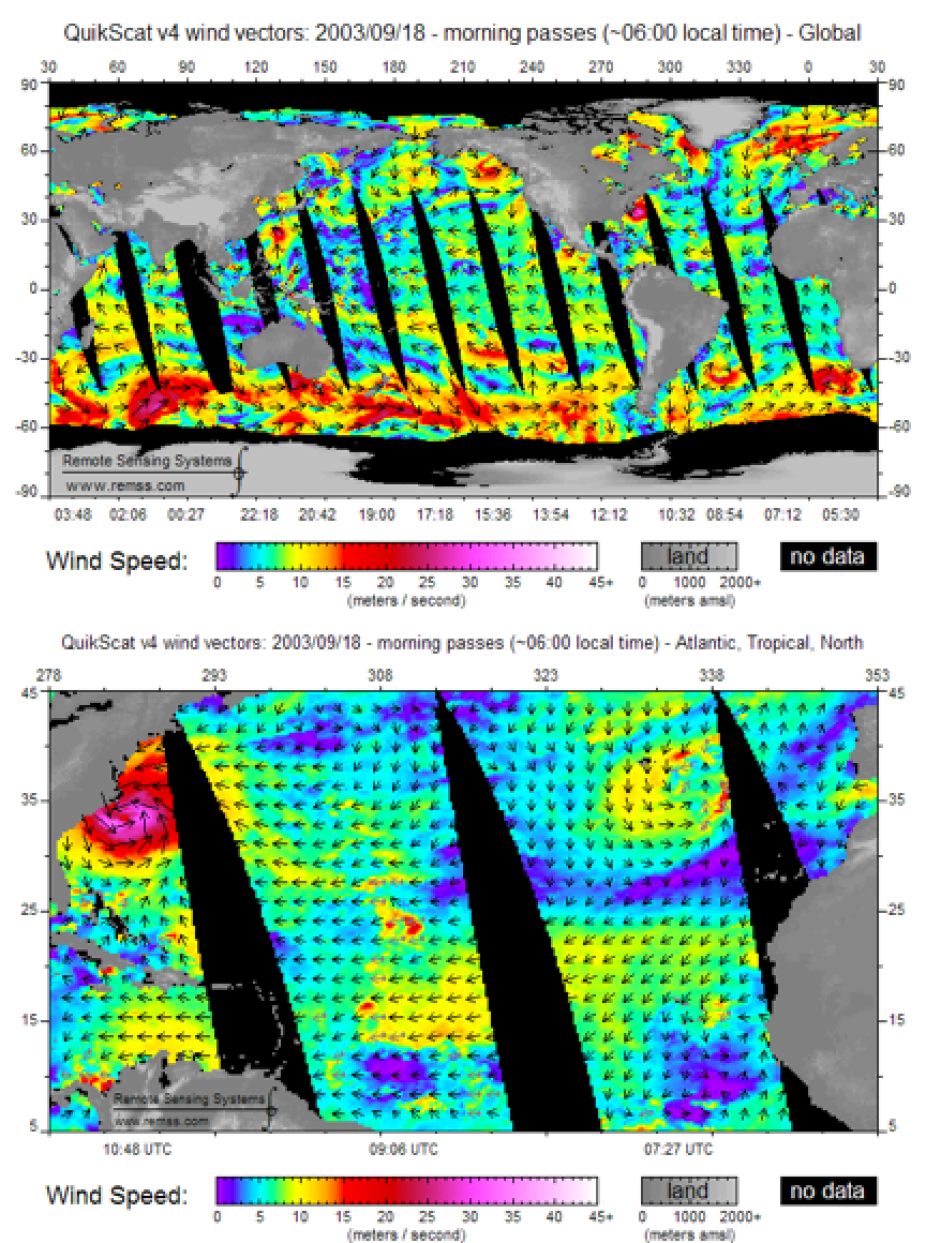
Sample RSS QuikSCAT global daily gridded map (top), for ascending passes only. The zoomed-in map (bottom) for the same day highlights Hurricane Isabel in the Western Atlantic. (contributed by L. Ricciardulli)
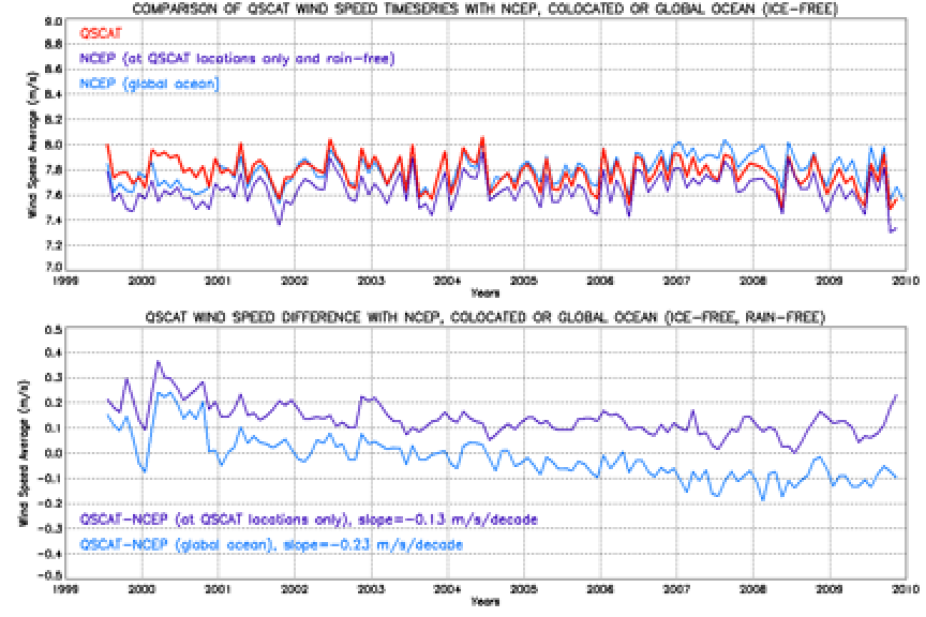
Top panel: Monthly global average timeseries of QuikSCAT wind speeds created from rain-flagged swath data (red line), from colocated NCEP Final analysis wind speeds (6-hourly, interpolated at QuikSCAT location and time, using the same rain-flagging as for QuikSCAT) (purple line), and using all 6-hourly global ocean NCEP data, without colocating them with QuikSCAT (light blue line). Bottom panel: Difference between the monthly QuikSCAT and NCEP timeseries, for global (light blue) or colocated (purple) NCEP winds. Despite the colocation process, there is still a small spurious slope in the QuikSCAT-colocated NCEP data (purple), likely due to the inhomogeneous ingestion of observed data in the NCEP Final analysis model. When monthly global ocean NCEP data are compared to QuikSCAT (light blue line), an additional (0.1 m/s/decade) spurious trend emerges, due to the sampling differences. (contributed by L. Ricciardulli)
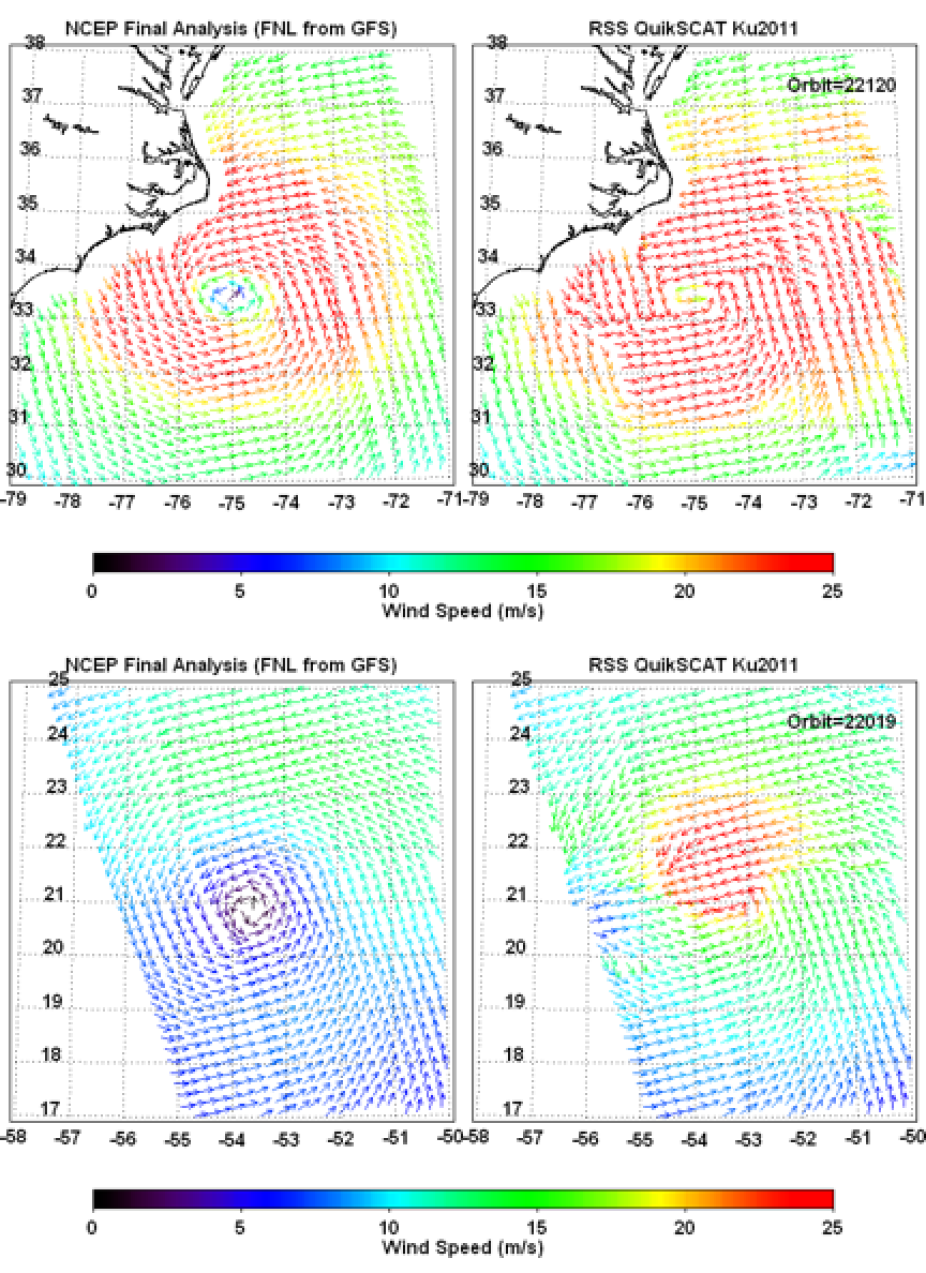
Top panels: Wind vectors during Hurricane Isabel for September 18, 2003, in QuikSCAT (right panel) and colocated NCEP Final analysis (left). Bottom panel: The same storm few days earlier (September 11, 2003) was completely missed by the NCEP Final analysis. (contributed by L. Ricciardulli)

Near surface wind vectors colored by wind magnitude for September, 2003. (Climate Data Guide; D. Shea)

Near surface wind speed; number of observations; and, standard error for September, 2003. (Climate Data Guide; D. Shea)