SST (AMSR-E): Sea Surface Temperature from Remote Sensing Systems
High resolution (0.25°) SSTs were derived from the AMSR-E, a passive microwave radiometer flying on NASA's AQUA satellite. Remote Sensing Systems distributes the data in high spatial and temporal (daily, weekly, monthly) resolutions for both daytime and nighttime averages. Monthly versions are available on a 1°x1° grid from JPL PO-DAAC as well as the CMIP5 obs4MIPS distribution; these 1°x1° monthly versions were computed from the nighttime averages. Unlike SSTs from ships, buoys, etc, SSTs from AMSR-E are a 'skin' temperature from a layer ~1mm thick.
NOTE: "The AMSR-E antenna stopped spinning at the required speed on Oct 4, 2011. This is most likely due to aging lubricant in the spin mechanism. We no longer produce AMSR-E data products after Oct 4 2011. The AMSR-E instrument continues to function, but with extremely reduced capability. JAXA has released an official statement: Official press release from Japan Aerospace Exploration Agency (JAXA)"
Key Strengths
Key Limitations
Cite this page
Acknowledgement of any material taken from or knowledge gained from this page is appreciated:
National Center for Atmospheric Research Staff (Eds). Last modified "The Climate Data Guide: SST (AMSR-E): Sea Surface Temperature from Remote Sensing Systems.” Retrieved from https://climatedataguide.ucar.edu/climate-data/sst-amsr-e-sea-surface-temperature-remote-sensing-systems on 2026-07-14.
Citation of datasets is separate and should be done according to the data providers' instructions. If known to us, data citation instructions are given in the Data Access section, above.
Acknowledgement of the Climate Data Guide project is also appreciated:
Schneider, D. P., C. Deser, J. Fasullo, and K. E. Trenberth, 2013: Climate Data Guide Spurs Discovery and Understanding. Eos Trans. AGU, 94, 121–122, https://doi.org/10.1002/2013eo130001
Key Figures
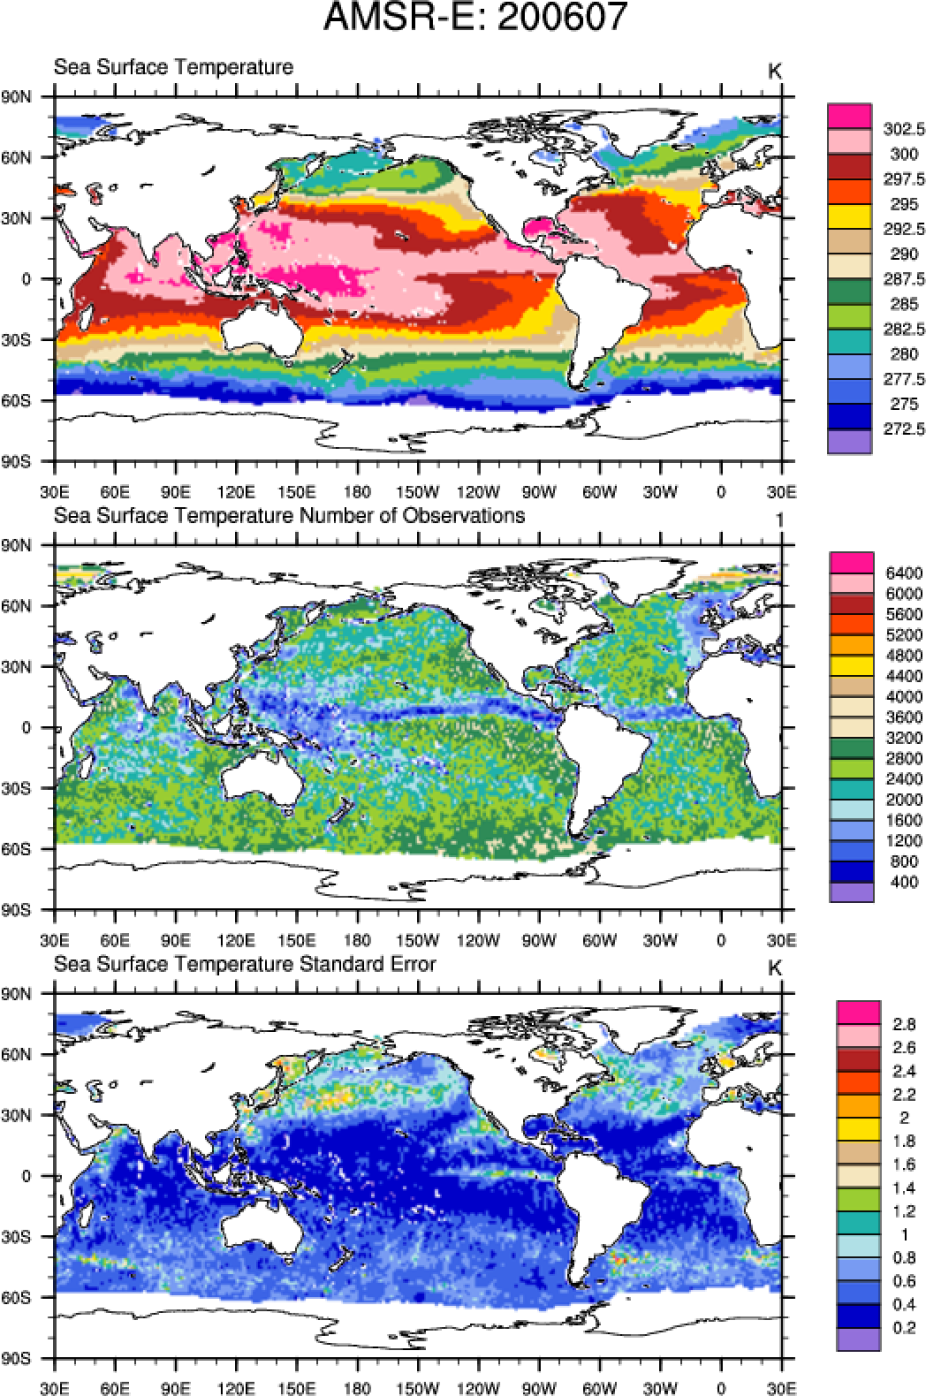
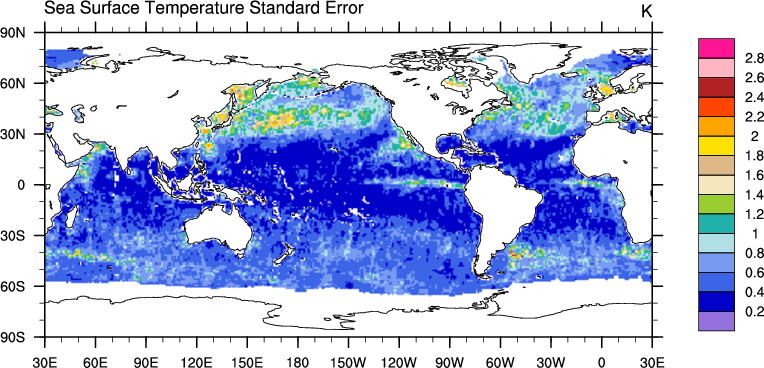
Monthly mean SST, number of observations and standard error for July, 2006 derived from AMSR-E.
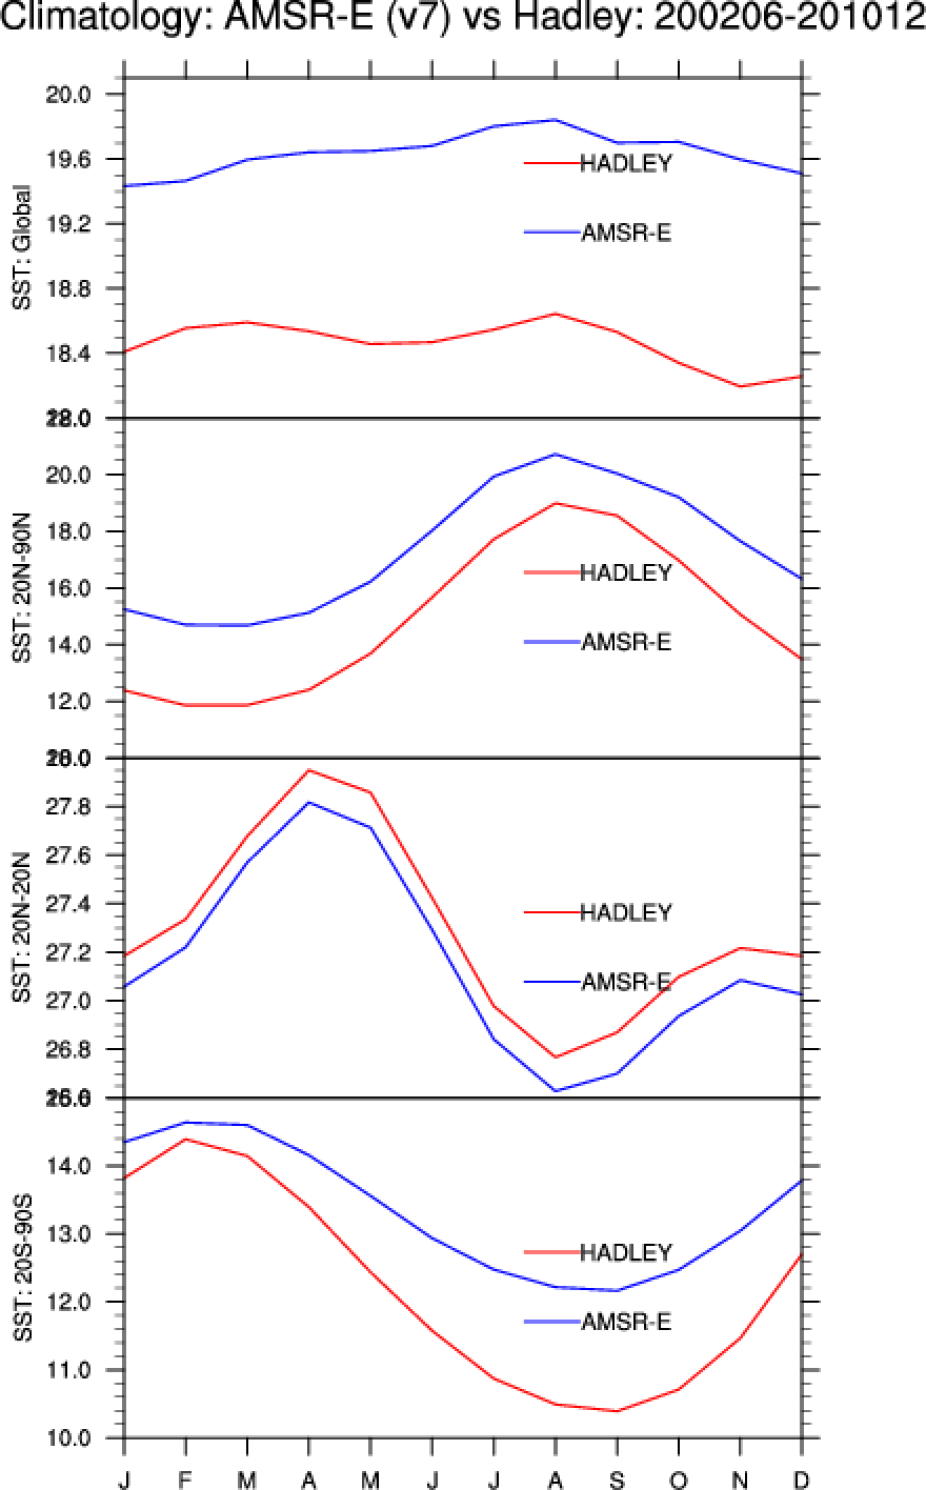
Annual cycle of climatological (200206-201012) areal mean SST: Globe, 20N-90N, 20S-20N, 20S-90S for the AMSR-E and Hadley Centre (HadISST) datasets.
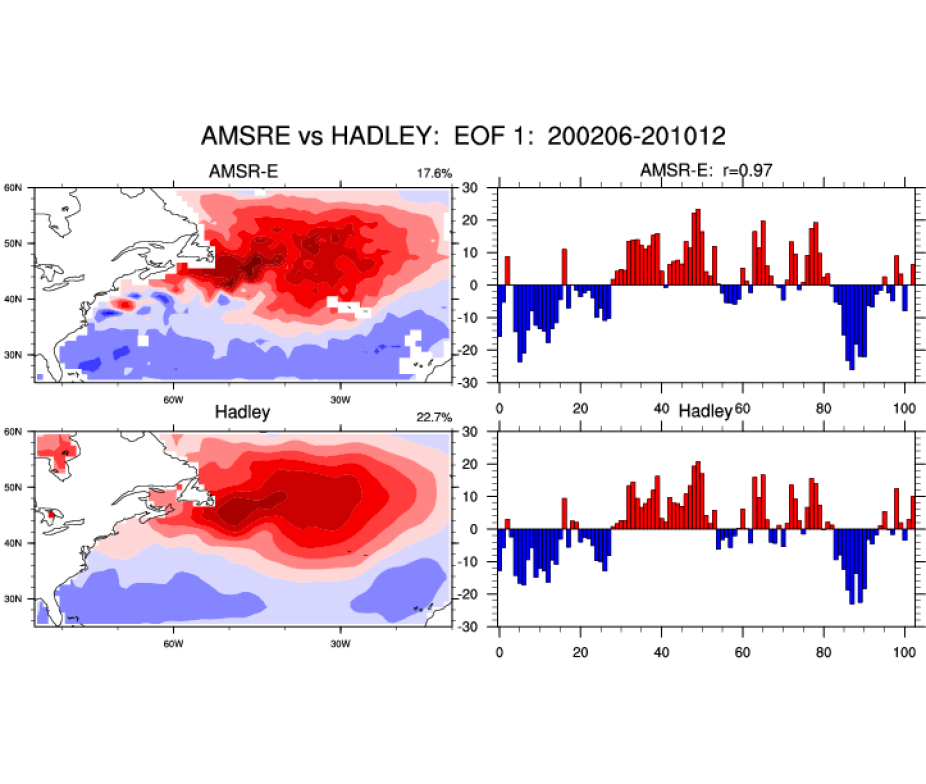
EOF 1 (25N-60N, 275-330E) for the AMSR-E and Hadley Center (HadISST) data sets. The linear correlation coefficient between the principal component time series is 0.97.
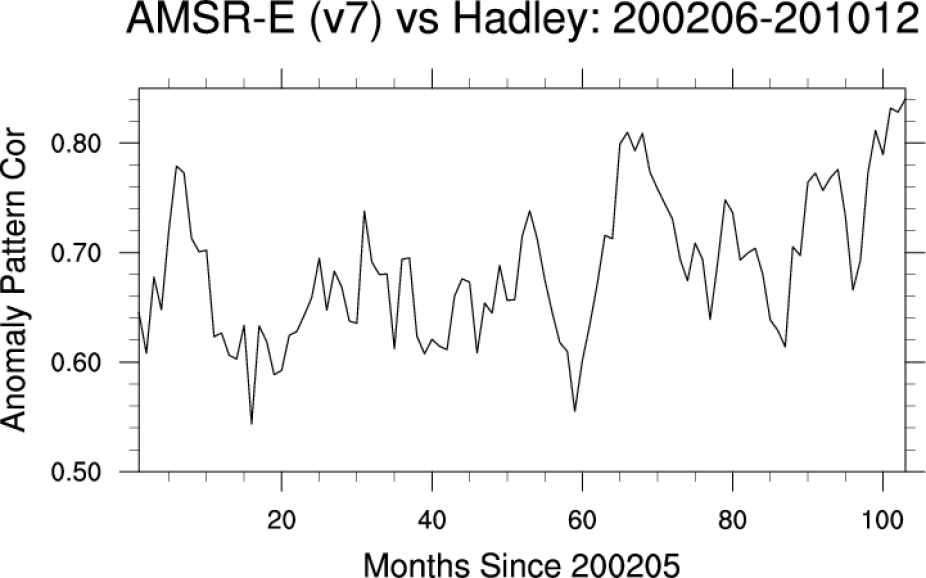
Global anomaly pattern correlations (AMSR-E and Hadley Center) for the period 200206-201012.
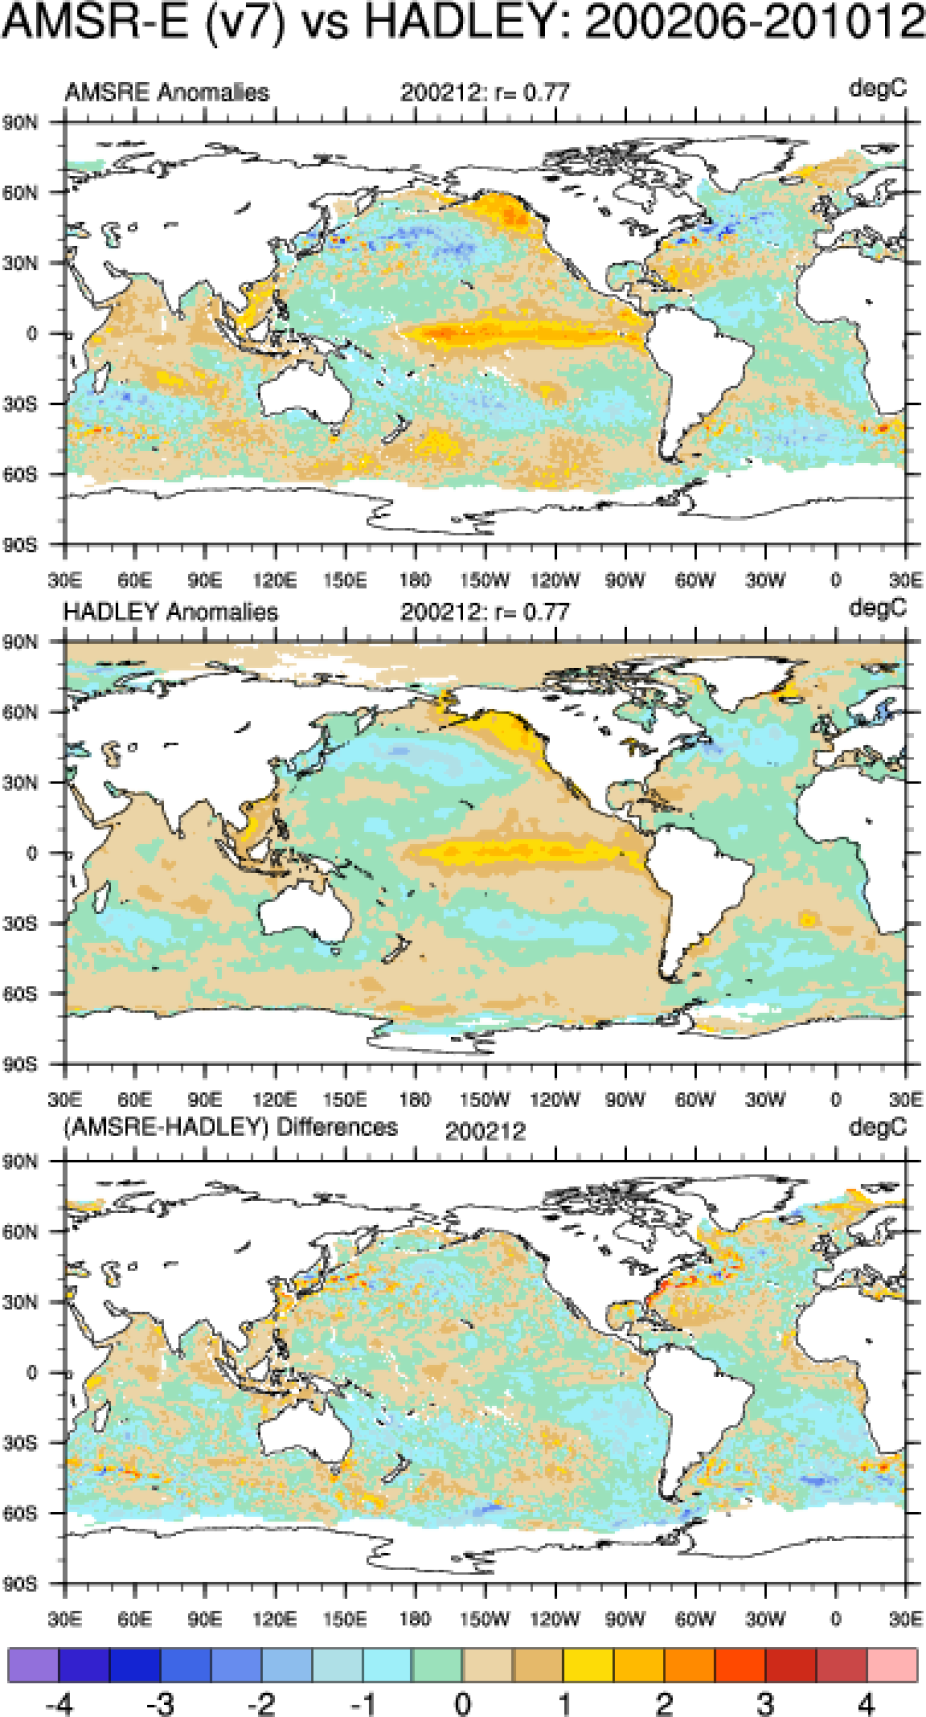
Anomalies between the respective AMSR-E and Hadley (HadISST) December climatologies over the period 200206-201012. Top: AMSRE (200212)- AMSRE; Middle: Hadley (200212)- Hadley. Bottom: Differences between the AMSRE and Hadley for 200212. The anomaly pattern correlation between the Top and Middle is 0.77.

Anomalies between the respective AMSR-E and Hadley (HadISST) December climatologies over the period 200206-201012. Top: AMSRE (200612)- AMSRE; Middle: Hadley (200612)- Hadley. Bottom: Differences between the AMSRE and Hadley for 200612. The anomaly pattern correlation between the Top and Middle is 0.68.
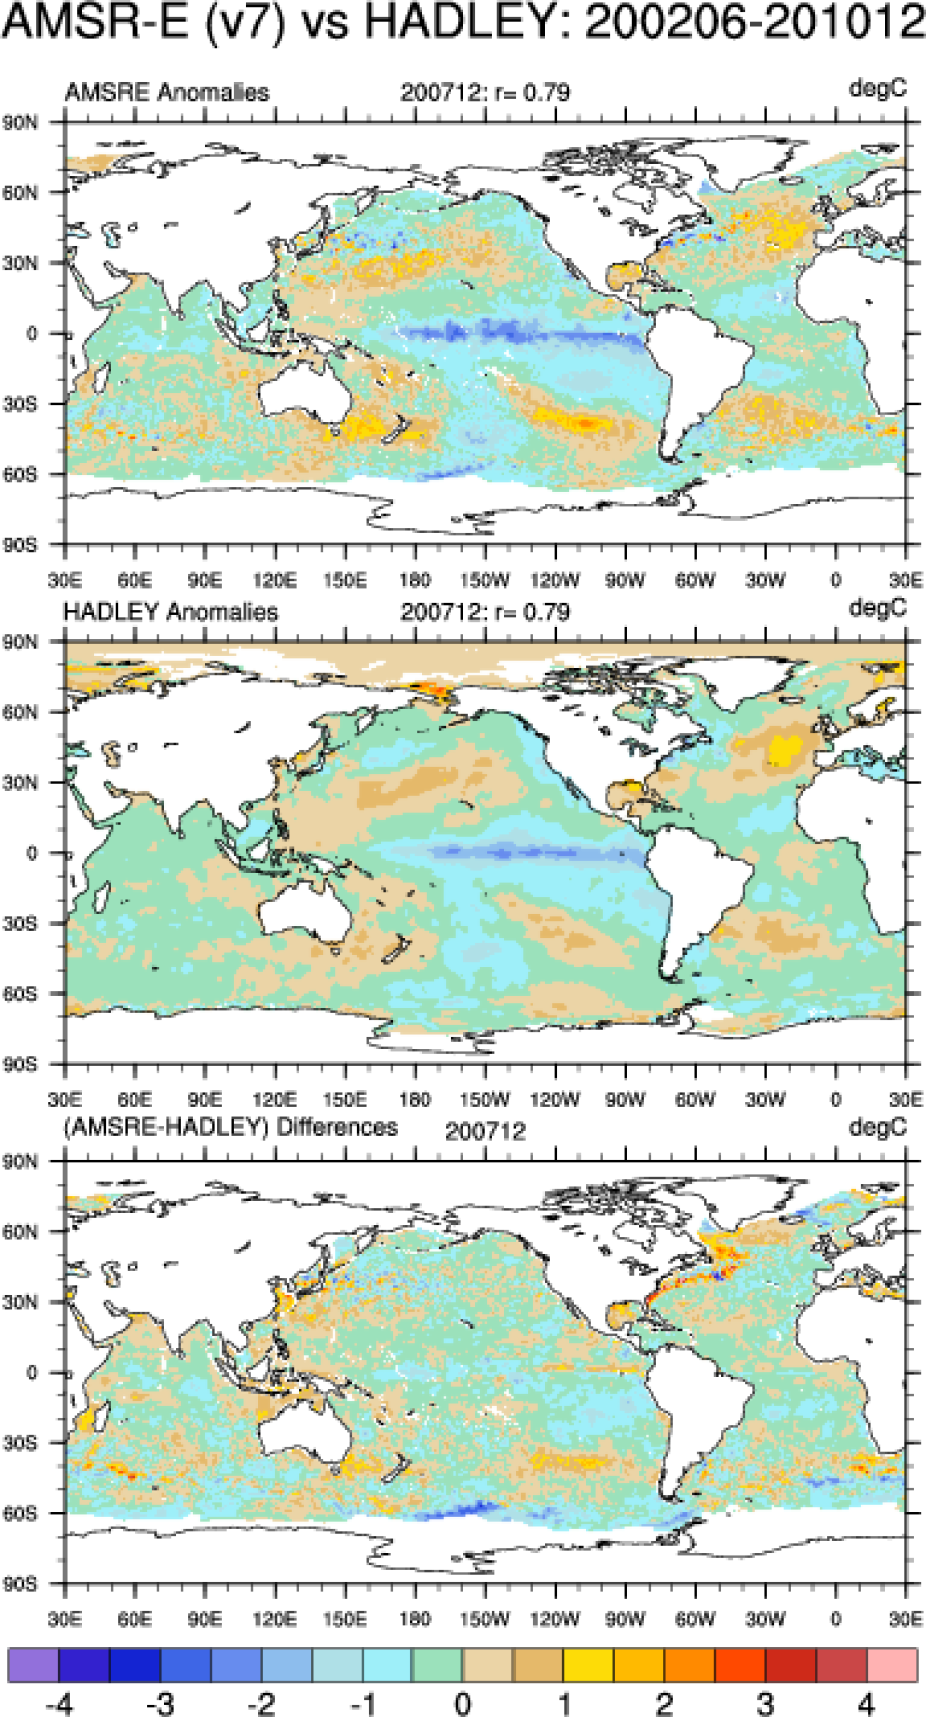
Anomalies between the respective AMSR-E and Hadley (HadISST) December climatologies over the period 200206-201012. Top: AMSRE (200712)- AMSRE; Middle: Hadley (200712)- Hadley. Bottom: Differences between the AMSRE and Hadley for 200712. The anomaly pattern correlation between the Top and Middle is 0.79.
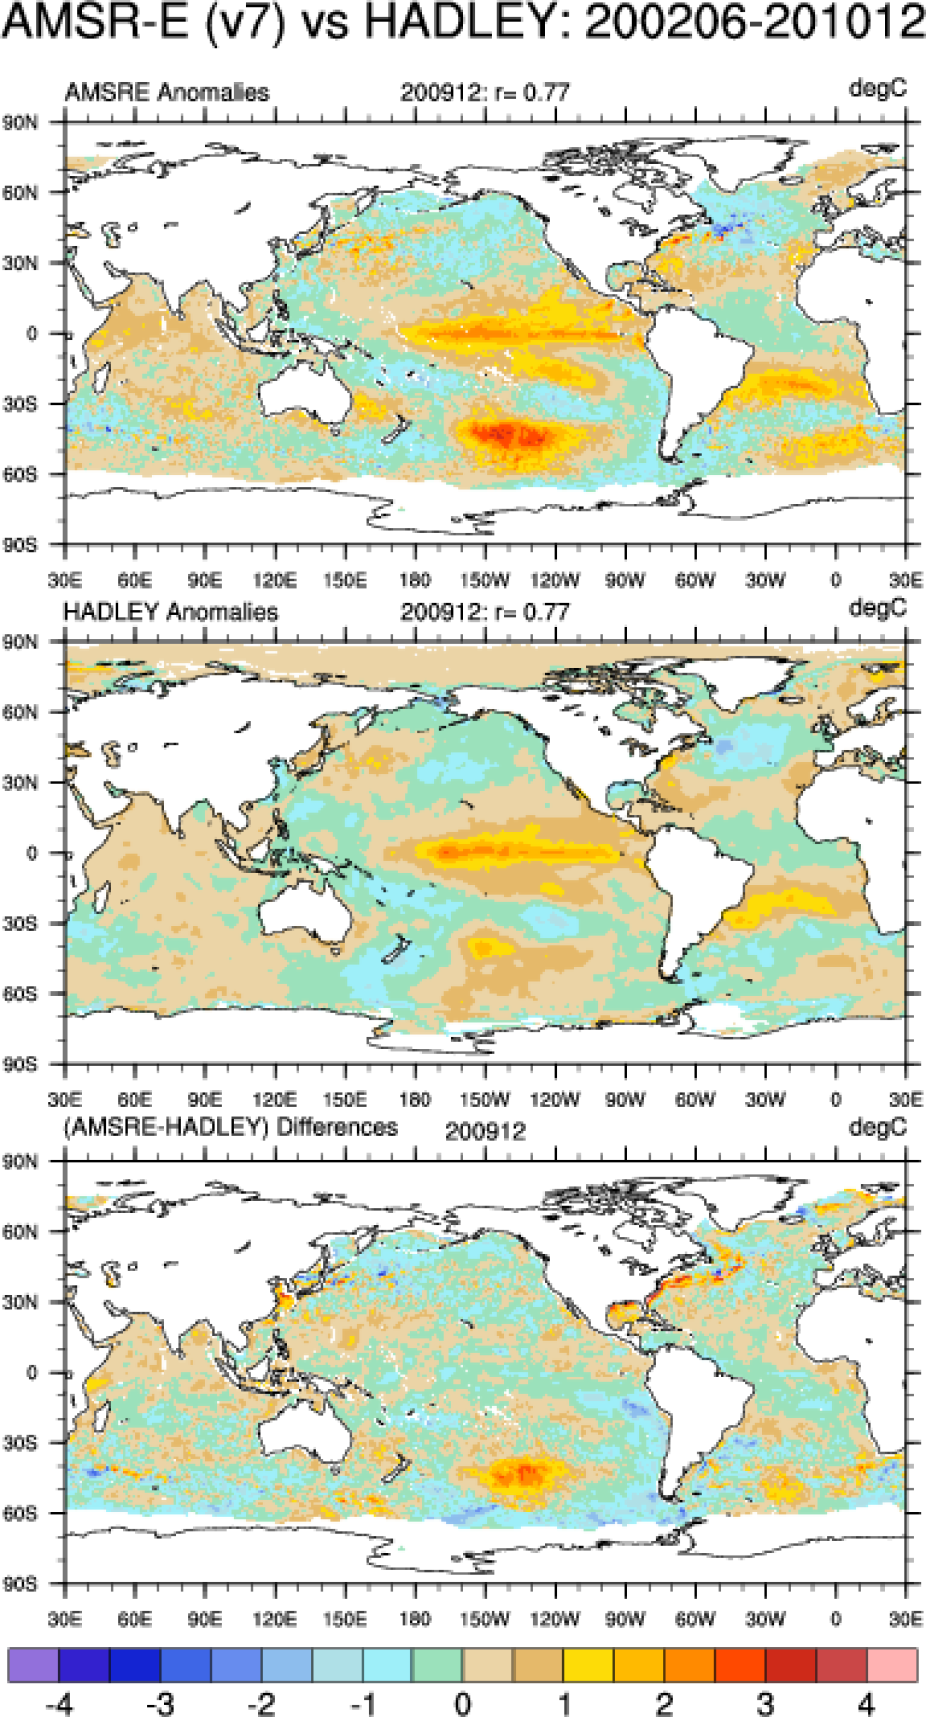
Anomalies between the respective AMSR-E and Hadley (HadISST) December climatologies over the period 200206-201012. Top: AMSRE (200912)- AMSRE; Middle: Hadley (200912)- Hadley. Bottom: Differences between the AMSRE and Hadley for 200912. The anomaly pattern correlation between the Top and Middle is 0.77.
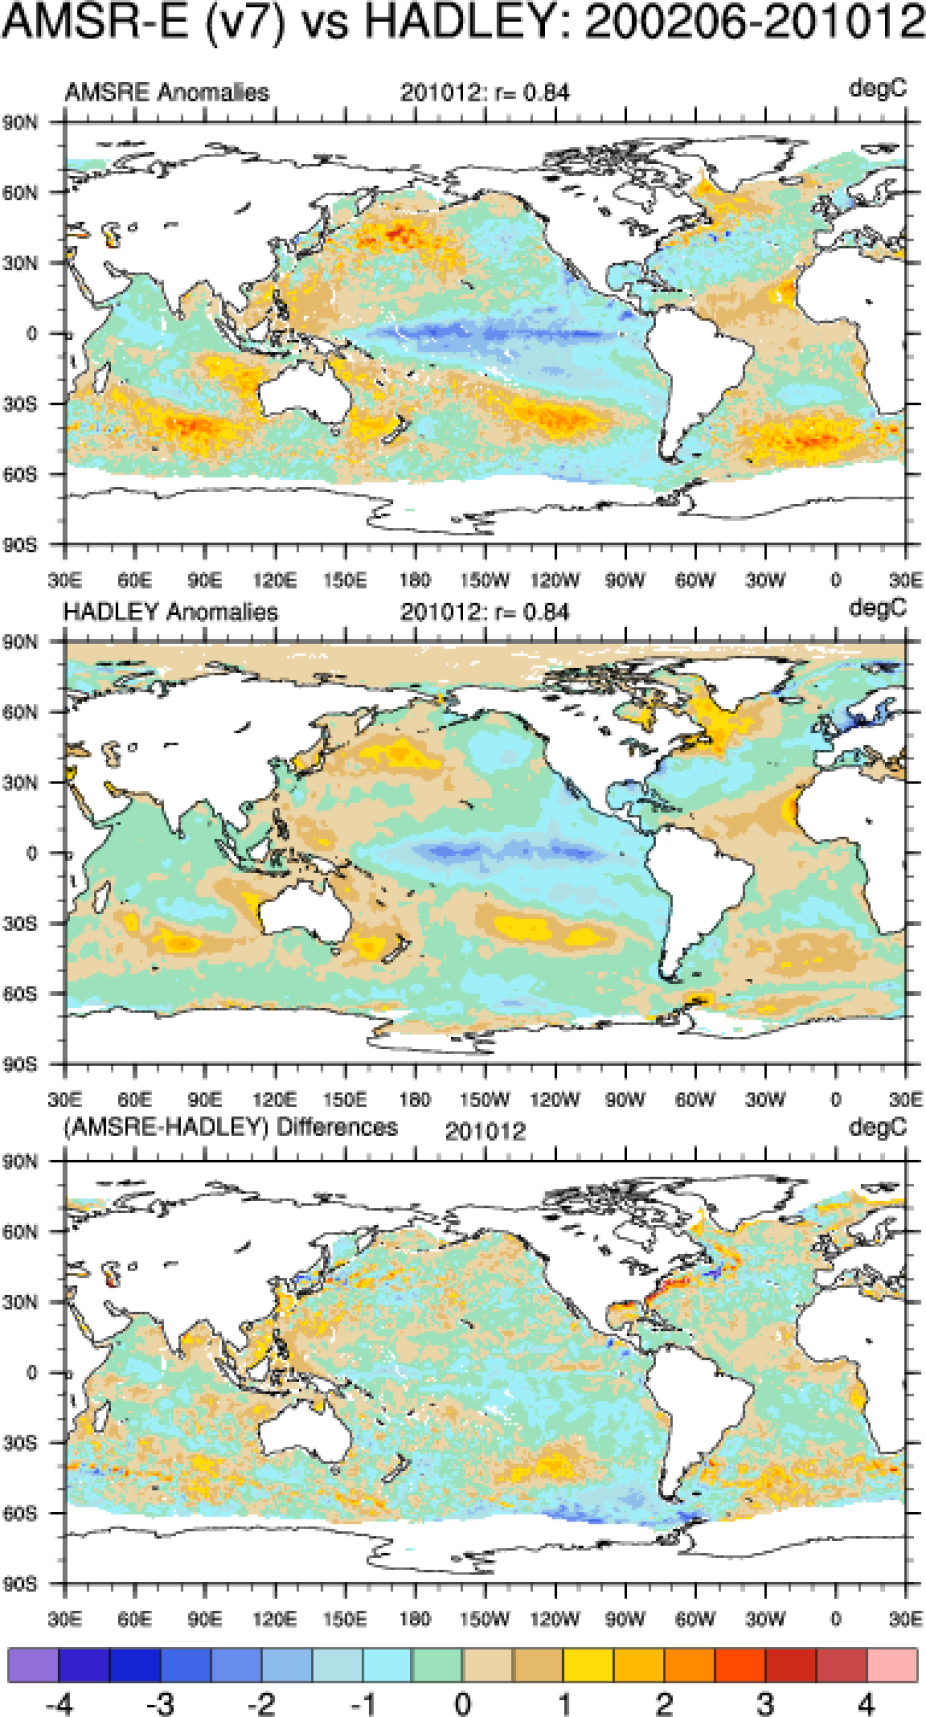
Anomalies between the respective AMSR-E and Hadley (HadISST) December climatologies over the period 200206-201012. Top: AMSRE (201012)- AMSRE; Middle: Hadley (201012)- Hadley. Bottom: Differences between the AMSRE and Hadley for 201012. The anomaly pattern correlation between the Top and Middle is 0.84.