AIRS and AMSU: Tropospheric air temperature and specific humidity
global, gridded data sets of temperature and specific humidity for several standard
levels in the troposphere for the obs4MIPS project. This obs4MIPS version of the
AIRS data are available at monthly resolution, 1ºx1º grids and formatted to
facilitate easier comparisons with CMIP5 model output. The gridded data are based on
the combined retrievals from AIRS, an instrument sensitive to infrared radiation
emitted from the surface and atmosphere, and the Advanced Microwave Sounding Unit (AMSU), an
instrument sensitive to microwave frequencies that facilitates retrievals even in
somewhat cloudy conditions. Both AIRS and AMSU are onboard NASA's AQUA platform.
Other AIRS Data including tropospheric temperature, specific humidity, relative
humidity, cloud amount, cloud top, and trace gases (CO, O3, and CO2) are also
available at either Level 2 swaths or Level 3 1ºx1º grids and several temporal
resolutions (daily, 8-day, monthly).
Key Strengths
Key Limitations
Tian, B., E. J. Fetzer, B. H. Kahn, J. Teixeira, E. Manning, and T. Hearty (2012), Evaluating CMIP5 models using AIRS tropospheric air temperature and specific humidity climatology, J. Geophys. Res., J. Geophys. Res., 118, D50117, 114-134, doi:10.1029/2012JD018607.
Olsen, E. T., E. Fishbein, S. Granger, S.-Y. Lee, E. Manning, M. Weiler, J. Blaisdell, and J. Susskind (2007), AIRS/AMSU/HSB version 5 data release user guide, available at http://disc.Sci.Gsfc.Nasa.Gov/AIRS/documentation/v5_docs/.
Expert Developer Guidance
The following was contributed by Baijun Tian (NASA-JPL), December, 2012:
1. Data description
The AIRS and AMSU instruments on NASA Aqua are each cross-track scanning nadir sounders that are co-aligned and have a swath roughly 1650 km wide. The AIRS instrument is a 2378-channel grating spectrometer measuring infrared radiance at wavelengths in the range 3.7–15.4 µm with a horizontal resolution of about 13.5 km at nadir. These wavelengths are sensitive to temperature and moisture profiles, clouds, minor gases, and surface properties. The AMSU instrument is a fifteen-channel microwave radiometer with a horizontal resolution of about 45 km at nadir. Twelve AMSU channels are sensitive to temperature, with the other three channels are used for moisture measurement and precipitation detection.
The AIRS/AMSU combined geophysical retrieval method uses an iterative, least-square physical inversion of cloud-cleared infrared radiances, obtained from a combination of nine AIRS fields of view contained within each AMSU field of view. The AIRS/AMSU sounding system produces about 324,000 air temperature and specific humidity profiles every day, though with varying information content. The horizontal resolution of air temperature and specific humidity profiles is 45 km at nadir and can be approximately 100 km at the high scan angles off-nadir, the same as the AMSU field of view. Depending on the scene, AIRS Version 5 (V5) tropospheric air temperature (specific humidity) retrieval vertical resolution ranges between 2.5 km (2.7 km) near the surface and 7.1 km (4.3 km) near the tropopause. The swath AIRS air temperature and specific humidity profiles are referred to as Level-2 (L2) products. The AIRS L3 air temperature and specific humidity profile products are the gridded averages of the AIRS L2 air temperature and specific humidity profiles on horizontal 1°-latitude × 1°-longitude grids, the 24 World Meteorological Organization (WMO) standard pressure levels from 1000 to 1 hPa for air temperature and 12 WMO standard layers from 1000 to 100 hPa for specific humidity. They are reported for the ascending (daytime) and descending (nighttime) orbits separately and three temporal resolutions: daily, 8-day (one half of the Aqua orbit repeat cycle) and monthly (calendar month).
As part of the Obs4MIPs project, the AIRS project has generated two new AIRS datasets for CMIP5 model evaluation including the monthly mean tropospheric air temperature (K) and specific humidity (kg/kg) profile products from the standard AIRS V5 L3 monthly mean tropospheric air temperature and specific humidity products through interpolation and extrapolation of specific humidity from layers to levels and simple arithmetic means of the daytime and nighttime monthly means. These two AIRS datasets are provided for each calendar month from September 2002 to May 2011, on a global spatial grid at 1°-longitude by 1°-latitude resolution (the same spatial grid from the AIRS V5 L3), and on the 8 CMIP5 mandatory vertical pressure levels (1000, 925, 850, 700, 600, 500, 400, and 300 hPa).
The AIRS L2 tropospheric air temperature and specific humidity measurements have been validated against a variety of other tropospheric air temperature and specific humidity measurements from in situ instruments including aircraft, ship-launched balloons and operational radiosondes and model-generated analysis and reanalysis data. The AIRS L2 and L3 total water vapor has been compared against several other ground-based and satellite remote sensing measurements, as well as reanalysis data, which has implications for AIRS tropospheric specific humidity profiles. These previous validation studies indicate that the AIRS sounding accuracy requirements of 1 K per 1 km layers for air temperature and 15% per 2 km layers for specific humidity in the troposphere are generally met. The AIRS L3 tropospheric air temperature and specific humidity measurements have also been compared with radiosondes, reanalyses and Global Positioning System radio occultation (GPS RO) data in the context of the Madden-Julian Oscillation studies. These studies have shown a generally consistent MJO temperature and humidity structure among AIRS, reanalysis and GPS RO data. However, the impact of this cloud-induced low sampling on the AIRS L3 tropospheric air temperature and specific humidity climatology is still unclear.
2. Key Strengths -
High spatial resolution (45 km)
High vertical resolution (~2 km)
High temporal resolution (twice per day), day and night coverage.
Global coverage including oceans and land, tropics, mid-latitudes and polar regions.
Very stable instrument.
3. Key Weaknesses -
Low sampling in cloudy regions (no retrivals are produced for cloud fractions > ~70%)
Incomplete diurnal cycle coverage
Inhomogeneous sampling with latitude
4. Caveats for model-observation comparison
There are several caveats that distinguish these AIRS tropospheric air temperature and specific humidity products from those climate model output counterparts.
4.1 Cloud effects on sampling
Because AIRS is an infrared instrument, its sensitivity to air temperature and specific humidity is reduced near and below clouds and AIRS coverage is limited by the presence of optically thick clouds. However, the combination of infrared (AIRS) and optically transparent microwave frequencies (AMSU) allows retrieval of high-resolution air temperature and specific humidity profiles for infrared cloud fraction (the product of emissivity and coverage) up to about 70%, with a rapid decrease of highest-quality retrievals at higher cloud fraction. This infrared sensitivity to clouds makes the AIRS observation scene dependent and in turn causes a spatially inhomogeneous sampling (or number of observations/retrievals). The AIRS number of retrievals is low (~60-100 retrievals per grid cell per month) in cloudy regions, such as the Intertropical Convergence Zone (ITCZ) and the South Pacific Convergence Zone (SPCZ) and the mid-latitude storm tracks around 60° north and south latitude (e.g., north Pacific, north Atlantic, Southern Ocean near Antarctica). The AIRS number of retrievals is high (~150 retrievals per grid cell per month) in clear regions, such as the subtropics and some mid-latitude land regions. If cloudiness is correlated with air temperature and/or specific humidity as demonstrated by some studies, then AIRS air temperature and specific humidity observations in cloudy regions with low data sampling may not be representative of the mean air temperature and specific humidity over the full range of conditions, and may contain large ‘clear-sky biases’ similar to other infrared sounder data, such as Television Infrared Observation Satellite (TIROS) Operational Vertical Sounder (TOVS) and High Resolution Infrared Radiation Sounder (HIRS).
4.2 Temperature bias trend
There is a spurious cooling trend of about 0.05 K/year in the troposphere for Version 5 AIRS air temperature retrievals. This is suspected to come from incorrect handling of rising atmospheric CO2 levels, and will be reduced in the next version release (V6) of AIRS data.
4.3 Incomplete diurnal cycle sampling
Because the Aqua satellite is in a Sun-synchronous polar orbit, AIRS samples the atmosphere at two fixed local solar times (1:30 AM and 1:30 PM) at the Equator and cannot fully resolve the diurnal cycle. In contrast, typical model monthly mean outputs contain the monthly averaged values of atmospheric variables at a higher fixed local solar time resolution (e.g. every six hours). For air temperature and specific humidity in the oceanic upper troposphere with a small diurnal cycle, this diurnal cycle sampling difference between AIRS and models is not likely a big problem. However, for air temperature and specific humidity in the boundary layer or over land regions strongly influenced by the diurnal cycle, this diurnal cycle sampling difference between AIRS and models should be considered.
4.4 Inhomogeneous sampling with latitude
Because the Aqua satellite is in a Sun-synchronous polar orbit, the diurnal sampling increases from the Equator to the poles, with the sampling in the polar regions at all times of day and night. Thus, the data sampling is much higher in the regions near the poles (~70–83° latitudes) than at lower latitudes. Sampling is as frequent as eight times daily at these high latitudes. However, as discussed above, regions poleward of 85° latitudes are viewed obliquely and the AIRS data there have low sampling rates.
4.5 Limited time coverage
AIRS went into a safe mode at the end of October 2003 to avoid possible damage from a large solar flare, and did not resume operations until mid-November 2003. Our preparation of these two AIRS products for CMIP5 model evaluation added a requirement of a minimum number of observations (twenty) per month for each grid square from each of ascending and descending orbits. With only a half-month of data in November 2003, many grid cells do not meet this criterion of twenty samples per cell per month. Cells filled during November 2003 include only the first half of the month, leading to a potential bias. A similar safe mode event occurred from January 9–29, 2010. As a result, the January 2010 product has about one third the data of a full month; it too could have a slight bias.
4.6 Excluded near-surface retrievals over land
Because of known biases near land surfaces, AIRS data within 100 hPa of the land surface were excluded from these two datasets. As a result, AIRS data are missing for most grids over land for the 1000-hPa and 925-hPa pressure levels and some grids for 850-hPa and 700-hPa pressure levels.##
Cite this page
Acknowledgement of any material taken from or knowledge gained from this page is appreciated:
Tian, Baijun & National Center for Atmospheric Research Staff (Eds). Last modified "The Climate Data Guide: AIRS and AMSU: Tropospheric air temperature and specific humidity.” Retrieved from https://climatedataguide.ucar.edu/climate-data/airs-and-amsu-tropospheric-air-temperature-and-specific-humidity on 2026-06-18.
Citation of datasets is separate and should be done according to the data providers' instructions. If known to us, data citation instructions are given in the Data Access section, above.
Acknowledgement of the Climate Data Guide project is also appreciated:
Schneider, D. P., C. Deser, J. Fasullo, and K. E. Trenberth, 2013: Climate Data Guide Spurs Discovery and Understanding. Eos Trans. AGU, 94, 121–122, https://doi.org/10.1002/2013eo130001
Key Figures
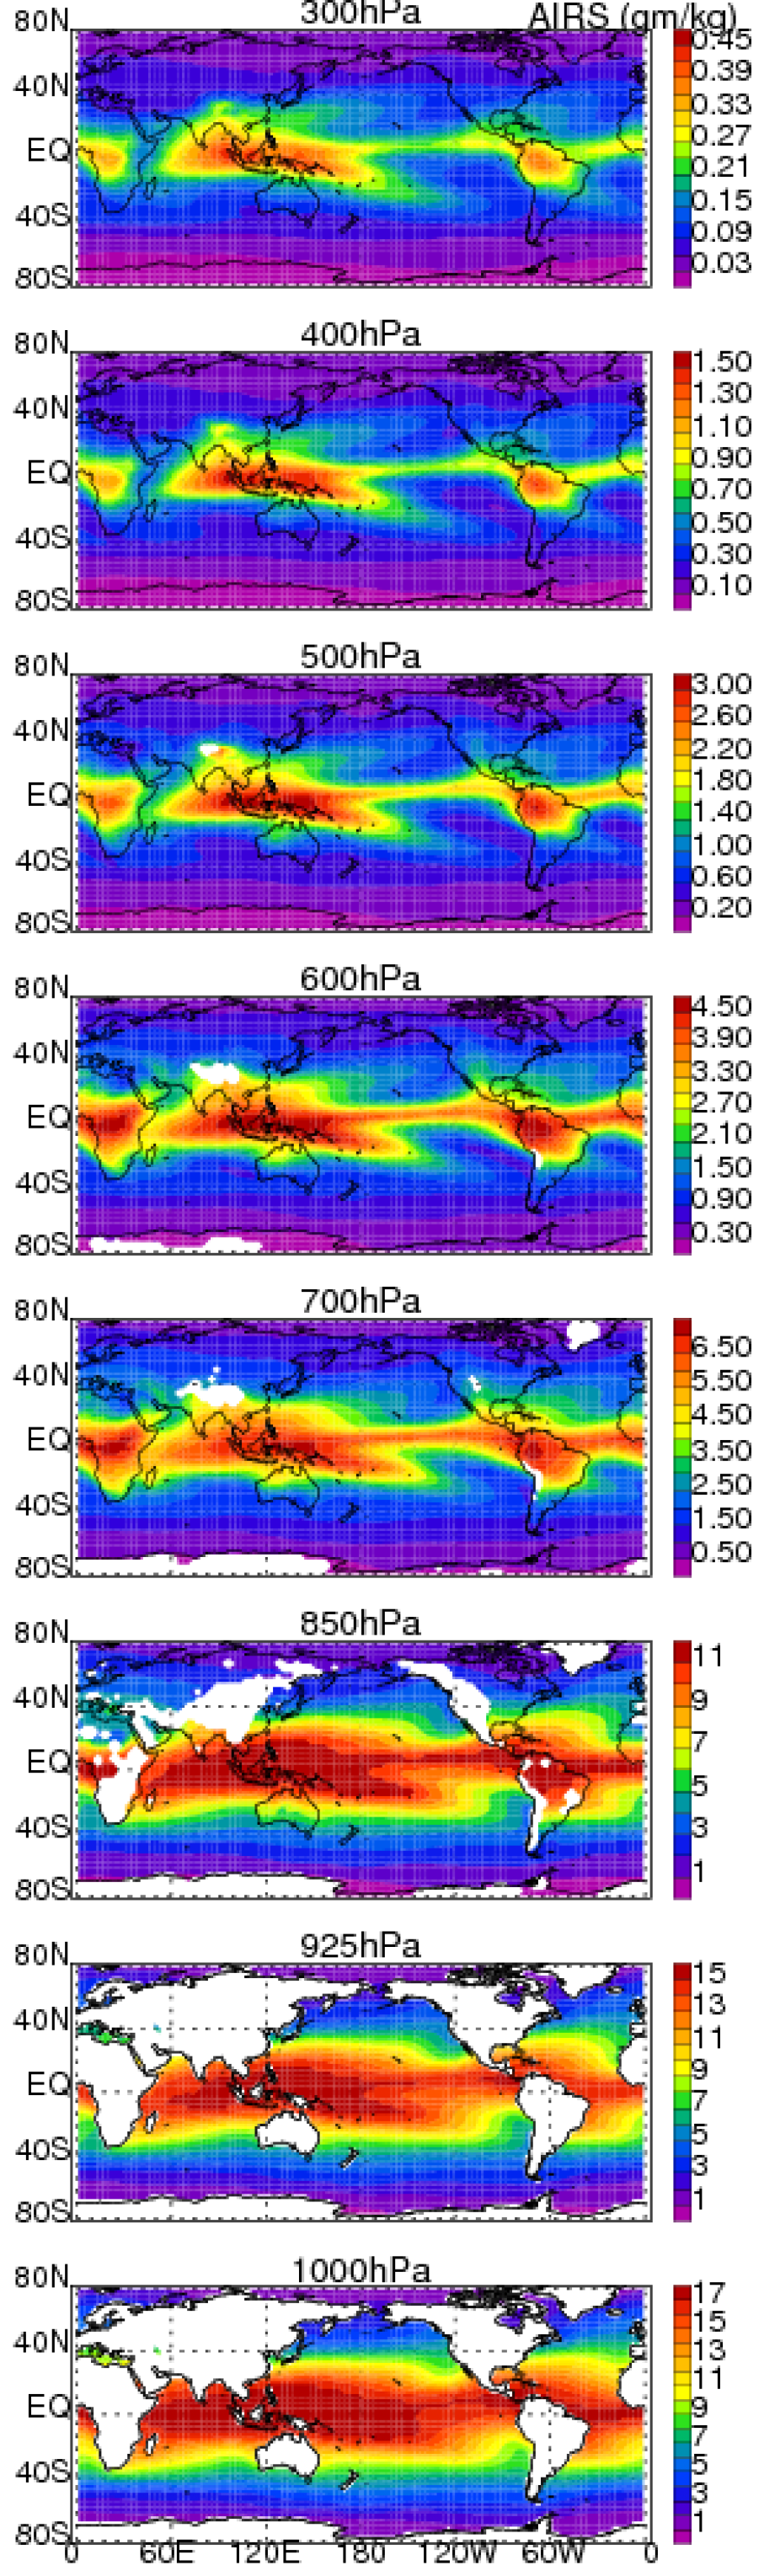
Global spatial maps of climatological mean AIRS tropospheric specific humidity (g/kg) at different pressure levels. Adopted from Fig8a of Tian et al. (2012). (contributed by B. Tian)
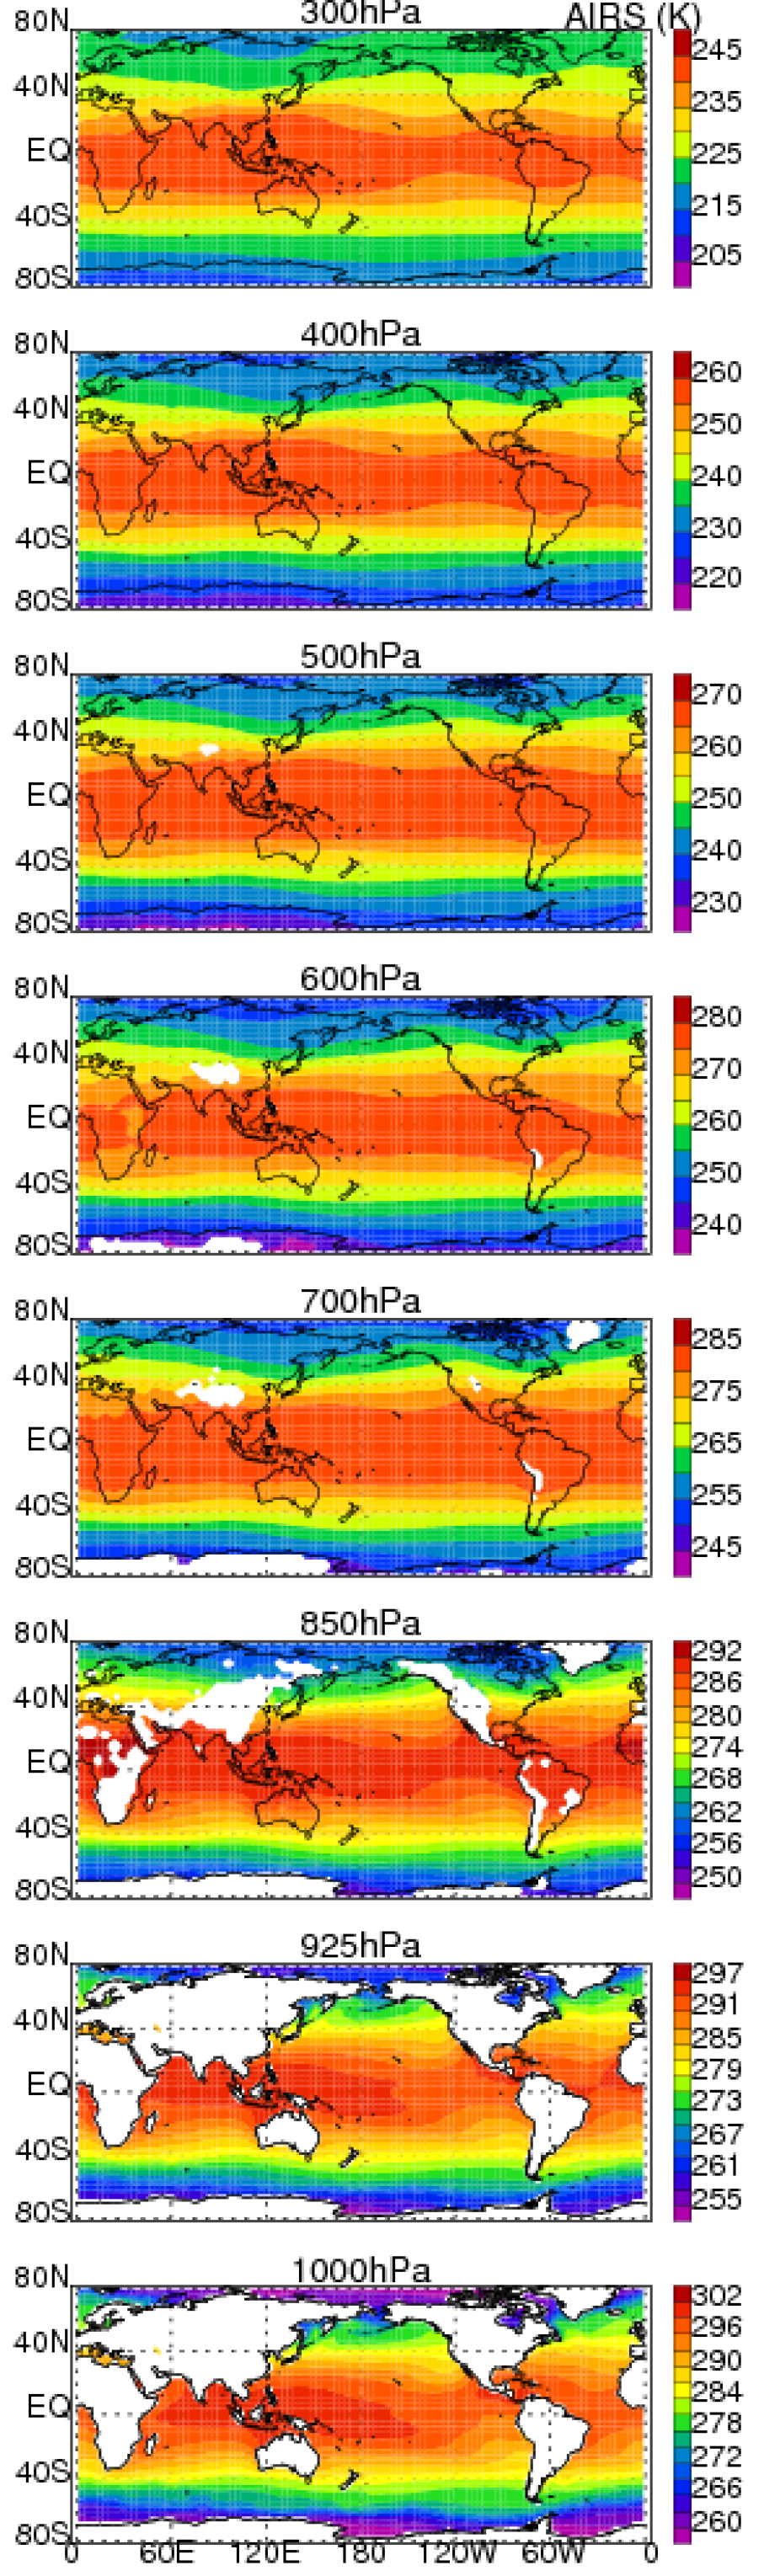
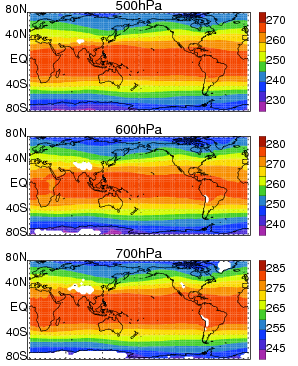
Global spatial maps of climatological mean AIRS tropospheric air temperature (K) at different pressure levels. Adopted from Fig6a of Tian et al. (2012). (contributed by B. Tian)