CERES EBAF: Clouds and Earth's Radiant Energy Systems (CERES) Energy Balanced and Filled (EBAF)

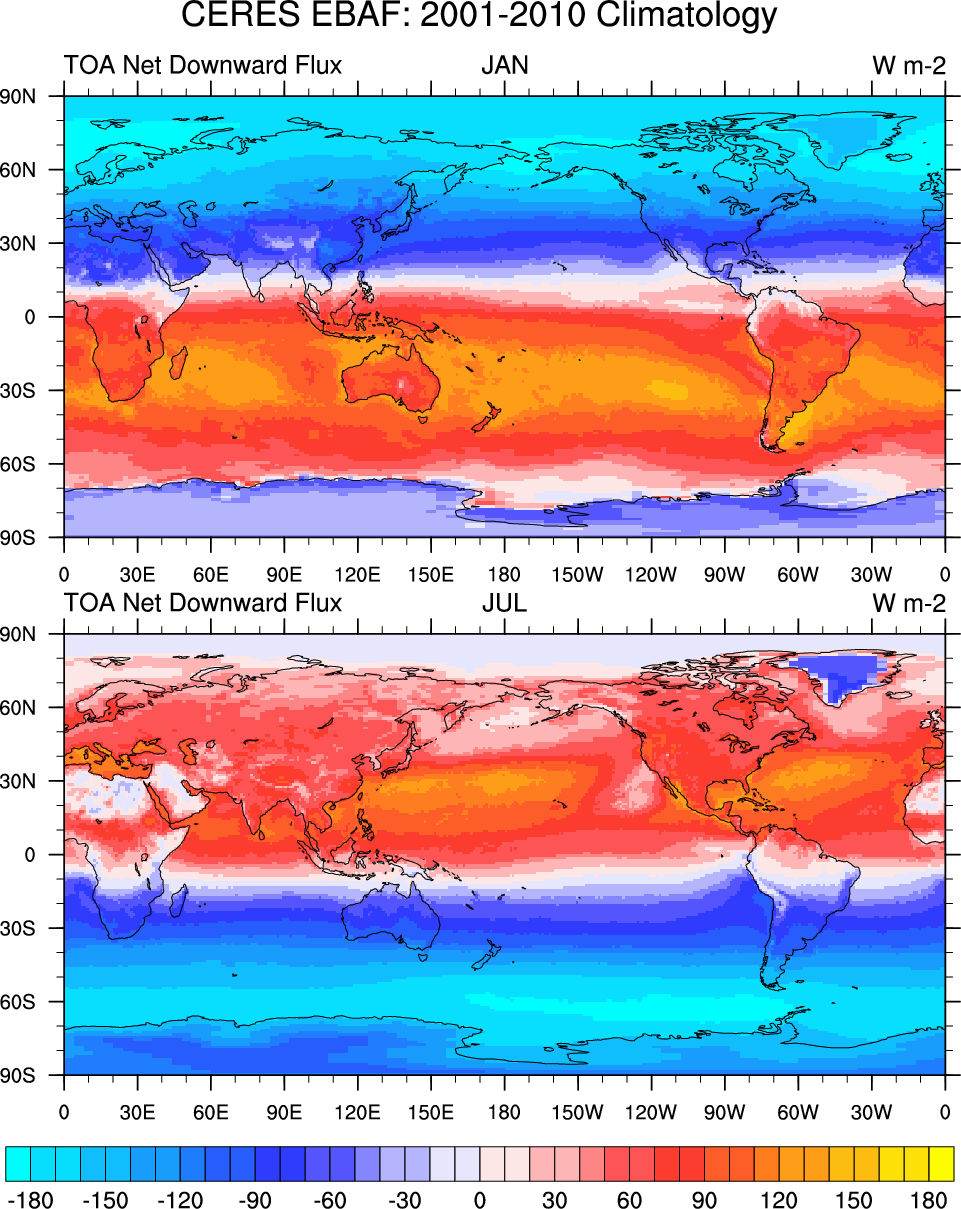
The CERES-EBAF product provides 1-degree regional, zonal and global monthly mean Top-of-Atmosphere (TOA) and surface (SFC) longwave (LW), shortwave (SW), and net (NET) fluxes under clear and all-sky conditions. EBAF is used for climate model evaluation, estimating the Earth's global mean energy budget, and to infer meridional heat transport. The data synthesized to derive the CERES-EBAF products and the contstraints imposed are described within the section (tab) called Expert Guidance.
In March 2014, the CERES EBAF Edition 2.8 was released. The release note states: "The primary change in CERES EBAF Ed 2.8 compared to CERES EBAF Ed2.7 is in the solar irradiance data set used. In EBAF Ed2.8, incoming solar irradiances are from SORCE TIM TSI V-15 for March 2000-June 2013, followed by RMIB from July onwards. All other radiative fluxes are nearly identical between the two versions. For more information please refer to the CERES EBAF Ed2.8 Data Quality Summary ."
Key Strengths
The CERES TOA flux record is highly stable (to better than 0.2% per decade SW (1σ), and 0.15% per decade LW (1σ)).
CERES TOA fluxes are based upon state-of-the-art angular distribution models for radiance-to-flux conversion. Instantaneous TOA fluxes are a factor of 2-3 better than ERBE.
The CERES team has conducted extensive validation of both TOA and surface radiation using TOA consistency tests and direct comparisons of surface fluxes with ground-based measurements over both land and ocean.
Key Limitations
Clear-sky fluxes in EBAF are determined only when the satellite observes a cloud-free region. Most climate models compute clear-sky fluxes for every gridbox by removing clouds in the computation. This can result in substantial regional differences.
There is some noise in EBAF clear-sky TOA fluxes due to use of limited number of MODIS channels.
See full list of strengths and weaknesses in the discussions below
Expert Developer Guidance
The following was contributed by Norman Loeb (NASA-Langley), June, 2012:
#The EBAF features include:
- SW and LW TOA fluxes constrained such that global net imbalance is consistent with the imbalance determined from in-situ Argo upper ocean heat content change, ocean heat storage at depths greater than 2000 m, uptake of heat from ice warming and melt, and atmospheric and lithospheric warming (Loeb et al., 2009; Loeb et al., 2012).
- Combines CERES and Moderate Resolution Imaging Spectrometer (MODIS) measurements to produce a new clear-sky TOA flux climatology that provides fluxes in each region every month.
- Surface fluxes derived from radiative calculations that utilize MODIS cloud and aerosol properties, meteorological assimilation data from the Goddard Earth Observing System (GEOS) -4 and -5 models, and aerosol assimilation data from the Model for Atmospheric Transport and Chemistry. In order to minimize the error in surface fluxes due to uncertainties in the input data sources, input parameters in the radiative calculations are objectively adjusted within their uncertainty to ensure calculated TOA fluxes are consistent CERES EBAF-TOA fluxes. CALIPSO and Cloudsat observations are used to derive a priori uncertainties in MODIS cloud and aerosol properties. AIRS data are used to remove biases in reanalysis upper troposphere temperature/humidity profiles.
- EBAF is for climate model evaluation, estimating the Earth's global mean energy budget, and to infer meridional heat transport.
EBAF is derived from the CERES SYN1deg data product, which uses the diurnally complete temporal averaging and the CERES ADMs.
Key Strengths
- The CERES TOA flux record is highly stable (to better than 0.2% per decade SW (1s), and 0.15% per decade LW (1s)).
- CERES TOA fluxes are based upon state-of-the-art angular distribution models for radiance-to-flux conversion. Instantaneous TOA fluxes are a factor of 2-3 better than ERBE.
- CERES processing enhances CERES temporal sampling with geostationary data.
- CERES net flux determination uses solar irradiances from the SORCE TIM instrument.
- The CERES team has conducted extensive validation of both TOA and surface radiation using TOA consistency tests and direct comparisons of surface fluxes with ground-based measurements over both land and ocean.
Key Weaknesses
- There is some noise in EBAF clear-sky TOA fluxes due to use of limited number of MODIS channels.
- Clear-sky fluxes in EBAF are determined only when the satellite observes a cloud-free region. Most climate models compute clear-sky fluxes for every gridbox by removing clouds in the computation. This can result in substantial regional differences, particularly in regions deep convection.
- In the current version of EBAF-SFC, the source of temperature and humidity profiles for surface flux calculations changes from GEOS-4 to GEOS-5 starting in November 2007. When deseasonalized anomalies are calculated separately for land and ocean, the time series of deseasonalied surface fluxes shows a discontinuity between October 2007 and November 2007.
- LW cloud radiative effects at the surface over Tibet are overestimated due to poor sampling of clear-sky scenes during nighttime.
What analyses have you used these data for?
- The EBAF data are mainly used for climate model evaluation and studies involving interannual variability of Earth’s radiation budget.
What are some of the strategies for making optimal use of these data?
- The CERES project uses the lessons learned from its predecessor, the Earth’s Radiation Budget Experiment (ERBE), to provide improved observation-based data products of Earth’s radiation budget. The CERES instrument design is based upon the ERBE scanners with significant improvements in several key areas. The ground and in-orbit calibration systems were designed to provide a factor of 2 improvement in absolute accuracy and stability over ERBE. Each CERES instrument is capable of scanning in the cross-track direction to optimize spatial sampling, in the along-track direction to acquire multi-angle views of the same area, and in a rotating azimuth plane (RAP) scan mode (where the instrument rotates in azimuth as it scans in elevation) in order to acquire full angular sampling of Earth scenes.
- To improve scene identification, the CERES data products make full use of coincident 1-km imager data (e.g., MODIS on Terra and Aqua) to provide detailed information about cloud and aerosol properties within the larger 20-km CERES footprints.
- The improvement in angular sampling from CERES RAP data and scene identification from MODIS has enabled the CERES team to improve instantaneous TOA flux accuracy by a factor of 2-3 compared to ERBE, which relied on its broadband SW and LW radiances at 40-km resolution to distinguish between clear, partly cloudy, mostly cloudy and overcast scenes.
- To minimize temporal sampling errors, the CERES team uses geostationary satellite imagers calibrated against MODIS and CERES to capture changes in clouds and radiation between CERES observation times. In contrast, ERBE data products estimate changes in albedo with solar zenith angle and diurnal land heating assuming the scene at the observation time remains invariant between observation times. The ERBE assumption of constant meteorology leads to regional TOA flux errors of up to 30 Wm-2 in marine stratocumulus and convective regions over land.
- While ERBE data products were limited to TOA fluxes, the CERES team utilizes other data sources to compute radiative fluxes at the surface and within the atmosphere. CERES surface fluxes are unique in that the radiative calculations are constrained at the TOA by CERES-derived fluxes. Input parameters in the radiative calculations are objectively adjusted within their uncertainty to ensure calculated TOA fluxes are consistent CERES EBAF-TOA fluxes. CERES also uses CALIPSO and Cloudsat observations to derive a priori uncertainties in MODIS cloud and aerosol properties, and AIRS data are used to remove biases in reanalysis upper troposphere temperature/humidity profiles.
- To verify improvements in CERES data products, extensive validation of both TOA and surface radiation is performed using TOA consistency tests and comparisons with ground-based measurements of surface radiation over land and ocean.
- Finally, in order to ensure that the CERES data ordering experience is as instructive and efficient as possible to users, the CERES team has developed a customized interface for subsetting, visualizing and ordering CERES data at the following website: http://ceres.larc.nasa.gov/order_data.php.
What are the strategies for comparing these data with models?
- The CERES TOA and surface fluxes were developed to be compared directly with climate model results without the need for simulators or other sampling strategies.
What are some of the common pitfalls or mistakes people encounter when using these data?
- Users are encouraged to read the CERES Data Quality Summaries (DQS) that accompany all CERES data products. These documents provide the developers’ assessment of the accuracy, strengths and weaknesses, and useful cautions and helpful hints when using the data products. The CERES Data Quality Summaries are “live” documents that are updated as new information about the data products become available.
##
Cite this page
Acknowledgement of any material taken from or knowledge gained from this page is appreciated:
Loeb, Norman & National Center for Atmospheric Research Staff (Eds). Last modified "The Climate Data Guide: CERES EBAF: Clouds and Earth's Radiant Energy Systems (CERES) Energy Balanced and Filled (EBAF).” Retrieved from https://climatedataguide.ucar.edu/climate-data/ceres-ebaf-clouds-and-earths-radiant-energy-systems-ceres-energy-balanced-and-filled on 2026-02-07.
Citation of datasets is separate and should be done according to the data providers' instructions. If known to us, data citation instructions are given in the Data Access section, above.
Acknowledgement of the Climate Data Guide project is also appreciated:
Schneider, D. P., C. Deser, J. Fasullo, and K. E. Trenberth, 2013: Climate Data Guide Spurs Discovery and Understanding. Eos Trans. AGU, 94, 121–122, https://doi.org/10.1002/2013eo130001
Key Figures
Other Information
- N.G. Loeb, J.M. Lyman, G.C. Johnson, R.P. Allan, D.R. Doelling, T. Wong, B.J. Soden, and G.L. Stephens, 2012: Observed changes in top-of-the-atmosphere radiation and upper-ocean heating consistent within uncertainty. Nature Geosciences, DOI 10.1038/NGE
- N. G. Loeb, B. A. Wielicki, D. R. Doelling, G. L. Smith, D. F. Keyes, S. Kato, N. Manalo-Smith, T. Wong (2009), Toward optimal closure of the Earth's top-of-atmosphere radiation budget, Journal of Climate, 22, 748-766
- Loeb, N. G. et al 2003: Angular Distribution Models for Top-of-Atmosphere Radiative Flux Estimation from the Clouds and the Earth’s Radiant Energy System instrument on the Terra Satellite. Part I: Methodology". J. Atmos. Ocean. Tech. 22 (4): 338–351
- B.A. Wielicki, et al.; Barkstrom, Bruce R.; Harrison, Edwin F.; Lee Iii, Robert B.; Louis Smith, G.; Cooper, John E. (1996). "Mission to Planet Earth: Role of Clouds and Radiation in Climate". Bull. Amer. Meteorol. Soc. 77 (5): 853–868
- N.G. Loeb, S. Kato, K. Loukachine, and N, Manalo-Smith 2007, Angular distribution models for top-of-atmosphere radiative flux estimation from the Clouds and the Earth’s Radiant Energy System instrument on the Terra satellite. Part II: Validation, J. At

