Equivalent Temperature: HadISDH.land and ERA5
Equivalent temperature is a measure of heat in the atmosphere that accounts for the latent heat stored in water vapor in addition to sensible heat as measured by temperature. The equivalent temperature ($T_e$) scales linearly with the moist enthalpy (i.e., the temperature and humidity) of the atmosphere. Te is computed from: $$T_e = T + \frac{L_v}{C_p} q \tag{1}$$ in which $T$ is the (dry-bulb) air temperature (Kelvin), $q$ is the specific humidity, $L_v$ is the latent heat of vaporization, $C_p$ is the specific heat capacity of air at constant pressure, and $q$ is the specific humidity. The second term on the right-hand-side of Eq. 1 therefore represents the amount of warming that an air parcel would experience if all its water vapor condensed. Unless in a completely dry atmosphere, $T_e$ is therefore always greater than $T$.
Equivalent temperature can be computed from any concurrent air temperature and specific humidity data. In practice (for near-surface values), this usually requires calculating specific humidity from air temperature, dewpoint temperature, and surface air pressure. Currently, HadISDH.land provides the state-of-the-art estimates using in situ data (Willett et al., 2014). Here, we also discuss how HadISDH.land compares with estimates from the ERA5 reanalysis. Note that in HadISDH.land, climatological surface air pressure (estimated from the nearest ERA5 1-degree grid box) is used to compute $T_e$. For ERA5, surface air pressure fields can be used directly.
Key Strengths
Equivalent temperature provides a more complete accounting of the change in near-surface atmospheric heat content by including both sensible and latent heat.
Equivalent temperature is a better measure of heat-related impacts in humid regions due to the inclusion of humidity.
HadISDH.land provides an global monthly estimate of equivalent temperature over land that is updated annually.
Key Limitations
The in situ historical record provided in HadISDH.land is of coarse 5°x5° spatial resolution due to limited data in much of the record and land surface.
Equivalent temperature relies on temperature, humidity, and pressure, compounding biases and uncertainty. Analyses should use thus both in situ and reanalysis-based estimates when possible.
Temporal averaging methodology of these three atmospheric variables can affect estimates (See Expert Guidance for more information)
HadISDH:
When using HadISDH in analyses, please use the following citations and state the version used. If using data downloaded from the CEDA archive, there is a traceable citation for each version on the version webpage. PDF downloads of these manuscripts available on the HadISDH landing page.ERA5:
Hersbach, H., and Coauthors, 2020: The ERA5 global reanalysis. Q.J.R. Meteorol. Soc., 146, 1999–2049, https://doi.org/10.1002/qj.3803.
Expert User Guidance
The following was contributed by Dr. Tom Matthews, August, 2025:
What are the typical research applications of this data set?
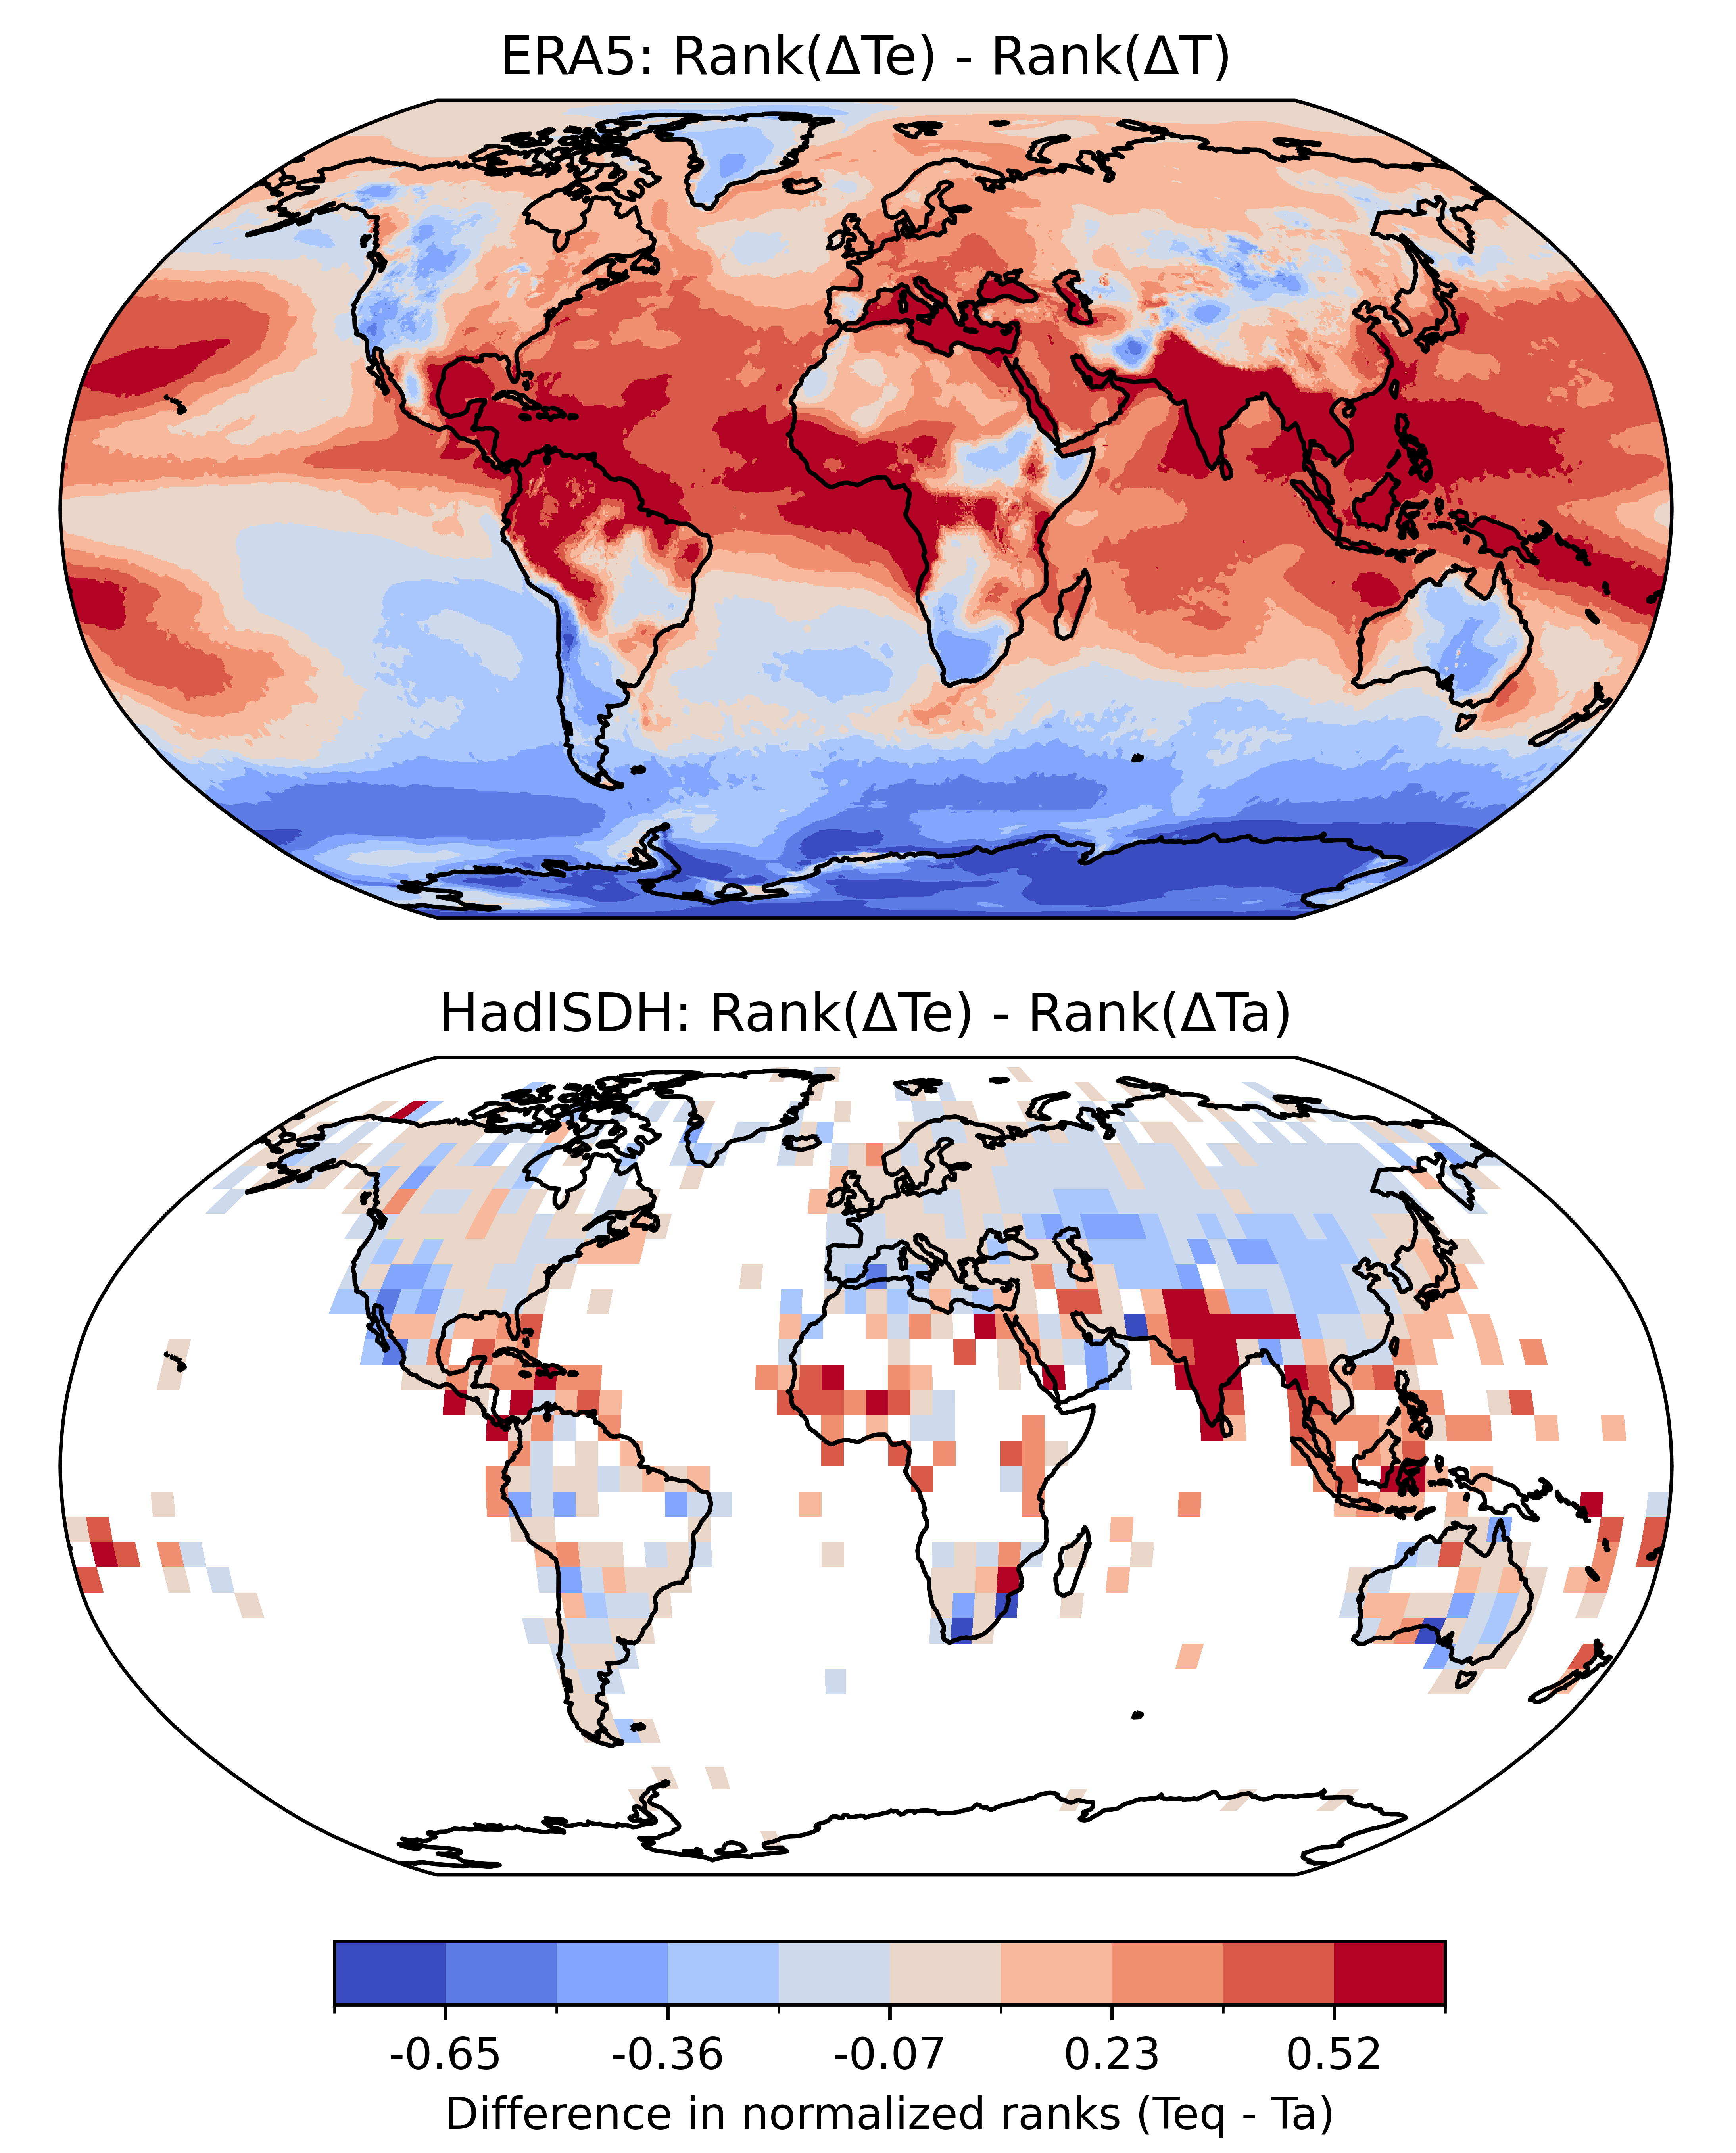
Radiative forcing leads to heat accumulation in the Earth system (von Schuckmann et al., 2020). In the atmosphere, $T$ is an incomplete metric of this accumulation because some of that heat is used to increase the moisture content of the air. Indeed, across much of the tropics and sub-tropics, the majority of near-surface atmospheric heat accumulation in recent decades has been in the latent rather than the sensible term (i.e., the change in $q L_v$ has been larger than the change in $T C_p$) (Matthews et al., 2022). This geographical pattern is expected because the share of latent heat accumulation should, under the assumption of near-constant relative humidity, be higher in warmer climates. Because $T_e$ captures changes in both sensible and latent heat content, it is more suitable than $T$ for tracking atmospheric heat accumulation (Pielke et al., 2004) – especially when comparing rates of change between regions (Matthews et al., 2022). For example, tropical and subtropical regions – including densely populated South Asia and parts of the Amazon basin – generally emerge more as hotspots of warming when $T_e$ is used in place of $T$ (Fig. 1).

Figure 1: Changes in normalised rank of warming rate according to air temperature (T) and equivalent temperature (Te) for ERA5 (top) and HadISDH.land (bottom). Warming rate is defined as the difference in T and Te between mean 2005-2024 and mean 1973-1992 values. The warming rates for each grid cell are then ranked globally and normalised [0-1], and differenced (rank(Te) minus rank(T)).
T. Matthews
Whilst mean $T_e$ is a desirable quantity for tracking heat accumulation, extremes in $T_e$ are also of interest from an impacts’ perspective because this metric’s inclusion of humidity makes it a good proxy for potential heat stress in humans, and for convective precipitation intensity (Matthews et al., 2022; Song et al., 2022). The monthly temporal resolution in HadISDH.land is, however, too low, to assess such impacts directly; convective precipitation extremes and episodes of human heat stress occur at sub-daily timescales. Moreover, some stations contributing to HadISDH.land report at only three- or eight-hourly frequency so the true minimum and maximum values will not contribute to the monthly statistics. In ERA5, $T_e$ can be computed at hourly resolution, but the spatial resolution (0.25°) means that extremes will be underestimated.
How is uncertainty characterized?
In HadISDH.land, 2 sigma $T_e$ uncertainty (~95% confidence interval) is shown for each grid box month. The uncertainty analysis accounts for errors at the individual station level—including those from measurements, bias corrections, and climatological estimates. It also incorporates sampling uncertainty from representing a 5°×5° grid using point data. For regional average time series, an additional term is included to reflect uncertainty due to missing data within some grid cells (Willett et al., 2014).
In ERA5, uncertainty can be computed using the 10 ensemble members, which accounts for random errors in the observations and parameterizations in the forecast model (ECMWF, 2024).
What are some comparable data sets, if any?
In terms of metrics, the wet-bulb temperature—also available in HadISDH.land (and easily calculated from ERA5 air temperature, dewpoint, and surface pressure)—is another way of expressing the moist enthalpy and is therefore similar to the equivalent temperature. However, the relationship is non-linear, with ever greater increases in moist enthalpy required to generate a 1°C rise as wet-bulb temperatures climb (Fig. 2). Wet-bulb temperature increments can, therefore, downplay rates of heat accumulation in hotter and more humid climates (i.e., where $T_e$ is already high).
HadISDH.land is the only near-surface, in-situ humidity dataset, and hence currently the only the only source of station-based equivalent temperature. Reanalyses products other than ERA5 (e.g., JRA-3Q, and NCEP/NCAR) can be used to compute the equivalent temperature, but users should be aware of any known biases (e.g., the spurious drying in NCEP/NCAR Reanalysis 1: (Dessler and Davis, 2010).
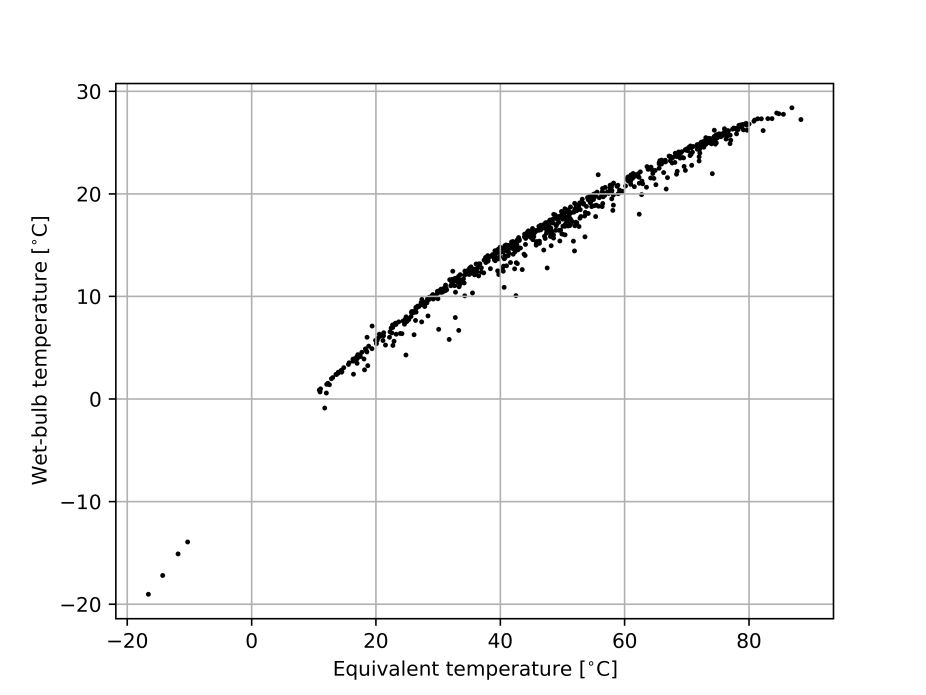
Figure 2: The relationship between monthly mean equivalent temperature and wet-bulb temperature across HadISDH.land grid cells in July, 2024.
T. Matthews
What are the key limitations of the available datasets?
Equivalent temperature in HadISDH.land and ERA5 inherit any issues from the underlying temperature, humidity, and pressure data. For example, some spurious ERA5 changes in tropospheric humidity over oceans in the mid-1990’s are present due to the introduction of microwave imager data (Hersbach, 2024). HadISDH.land $T_e$ is spatially coarse (5°) and spatially incomplete, with tropical Africa – a region expected to have particularly steep Te trends as the climate warms – a notable data gap (Matthews et al., 2022; Willett, 2025). An additional minor limitation of HadISDH.land is the constant, estimated surface air pressure used in HadISDH.land to compute $T_e$ (Willett et al., 2014).
Users should also be aware that the treatment of $L_v$ and $C_p$ in the calculation of temporal averages can introduce error into $T_e$. $L_v$ and $C_p$ are temperature ($L_v$) and humidity ($C_p$) dependent (Raymond et al., 2021), and $T_e$ should ideally be calculated from $L_v$ and $C_p$ at the respective, concurrent $T$ and $q $before averaging, rather than being evaluated from their already time-averaged quantities:$$\bar{T_e} = \overline{T_t + \frac{L_v(T_t)}{C_p(q_t)} q_t} \tag{2}$$in which the overbars denote temporal means, and the subscript $t$ is time. The below is an approximation: $$\bar{T_e} \approx \bar{T} + \frac{L_v(\bar{T})}{C_p(\bar{q})} (\bar{q}) \tag{3}$$ which will contain errors (e.g., a general underestimate reaching approximately -0.6 K in July, 2024: Fig. 3). Users should consider the impact of this for their application and, where possible, use Eq. (2) (e.g., with hourly rather than with monthly-mean ERA5 data) to calculate $T_e$ if the difference is likely to be important. Note that in HadISDH.land, Eq. (2) is used to compute monthly $T_e$.
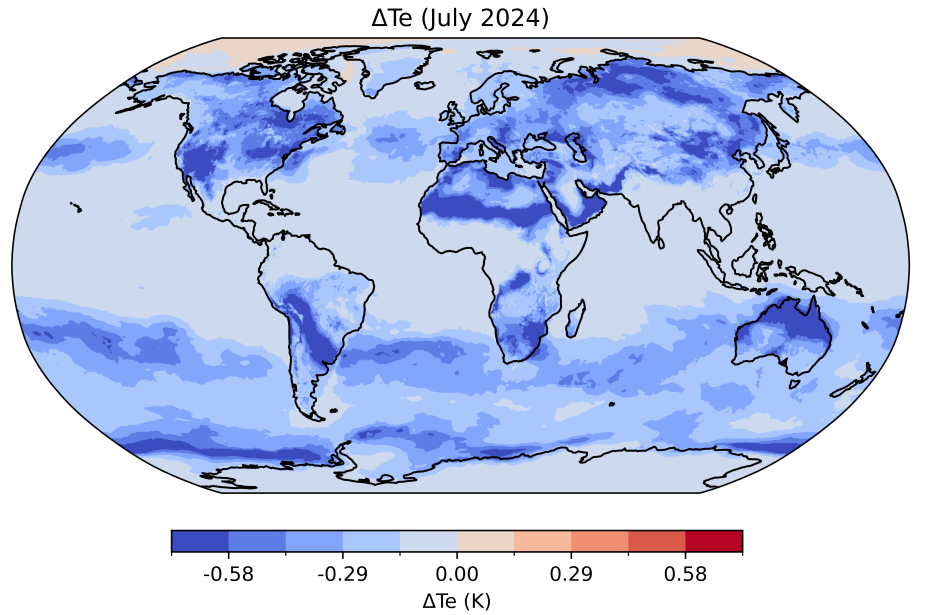
Figure 3: The difference in equivalent temperature from using monthly-mean (rather than concurrent) $L_v$ and $C_p$ in calculations (i.e., eq. 3 minus eq. 2) for July, 2024.
T. Matthews
How does one best compare these data with model output?
Equivalent temperature is often not directly available in climate model output (e.g., from CMIP6 MIP), but can be readily calculated from near-surface air temperature (‘tas’), specific humidity (‘huss’), and surface pressure (‘ps’).
Cite this page
Acknowledgement of any material taken from or knowledge gained from this page is appreciated:
Matthews, Tom & National Center for Atmospheric Research Staff (Eds). Last modified "The Climate Data Guide: Equivalent Temperature: HadISDH.land and ERA5.” Retrieved from https://climatedataguide.ucar.edu/climate-data/equivalent-temperature-hadisdhland-and-era5 on 2026-07-15.
Citation of datasets is separate and should be done according to the data providers' instructions. If known to us, data citation instructions are given in the Data Access section, above.
Acknowledgement of the Climate Data Guide project is also appreciated:
Schneider, D. P., C. Deser, J. Fasullo, and K. E. Trenberth, 2013: Climate Data Guide Spurs Discovery and Understanding. Eos Trans. AGU, 94, 121–122, https://doi.org/10.1002/2013eo130001
Key Figures

Figure 1: Changes in normalised rank of warming rate according to air temperature (T) and equivalent temperature (Te) for ERA5 (top) and HadISDH.land (bottom). Warming rate is defined as the difference in T and Te between mean 2005-2024 and mean 1973-1992 values. The warming rates for each grid cell are then ranked globally and normalised [0-1], and differenced (rank(Te) minus rank(T)).

Figure 2: The relationship between monthly mean equivalent temperature and wet-bulb temperature across HadISDH.land grid cells in July, 2024.

Figure 3: The difference in equivalent temperature from using monthly-mean (rather than concurrent) $L_v$ and $C_p$ in calculations (i.e., eq. 3 minus eq. 2) for July, 2024.