Global high-resolution precipitation: MSWEP
Multi-Source Weighted-Ensemble Precipitation (MSWEP) is a sub-daily precipitation dataset with full global coverage at 0.1° resolution, spanning the period 1979 to present. It is updated in near real-time with a latency of three hours, making it suitable for operational applications and for taking a quick look at recent anomalous precipitation events and placing them in context. No other precipitation dataset combines these characteristics. MSWEP does have some limitations, including a time- and space-varying number a daily gauge observations incorporated into the product, using a precipitation probability distribution that is based on reanalysis, and not making corrections for gauge undercatch.
Key Strengths
MSWEP offers a high 3-hourly 0.1° resolution, fully global coverage, and a long record that begins in 1979.
It is one of the few precipitation datasets to incorporate daily gauge observations, and the only to account for gauge reporting times, which is crucial to minimize temporal mismatches between the satellite/reanalysis estimates and the gauge observations.
The merging of gauge, satellite, and (re)analysis precipitation estimates improves performance in densely gauged, convection-dominated, and frontal-dominated regions, respectively.
Key Limitations
The number of daily gauge observations incorporated into MSWEP varies depending on both the region and the time period. In some regions, like Africa, the number of gauge observations is quite low, which might negatively impact the performance.
The precipitation probability distribution climatology in the latest version of MSWEP is based on ERA5, which unfortunately leads to underestimation of peak values and an excess of drizzle.
The current version of the near real-time extension does not include daily gauge corrections.
Beck, H. E., E. F. Wood, M. Pan, C. K. Fisher, D. G. Miralles, A. I. J. M. van Dijk, T. R. McVicar, and R. F. Adler, 2019. MSWEP V2 Global 3-Hourly 0.1° Precipitation: Methodology and Quantitative Assessment. Bull. Amer. Meteor. Soc., 100, 473–500, https://doi.org/10.1175/BAMS-D-17-0138.1.
Expert Developer Guidance
The following was contributed by Professor Hylke Beck, July 2023:
The Multi-Source Weighted-Ensemble Precipitation (MSWEP) is a gridded precipitation dataset that covers the period from 1979 to the present. It is derived by combining gauge, satellite, and reanalysis precipitation estimates to enhance performance in densely gauged, convection-dominated, and frontal-dominated regions, respectively (Beck et al., 2019a).
It is the only sub-daily precipitation dataset with fully global coverage (inclusive of all lands and oceans) at 0.1° resolution (which equates to approximately 11 km at the equator). It is one of the few precipitation datasets that incorporate daily gauge observations and the only that corrects for gauge reporting times. The dataset is operationally updated to the present, with a latency of around 3 hours.
MSWEP is available in three different variants: 'Past_nogauge', 'Past', and 'NRT'. The 'Past_nogauge' variant covers the period 1979–2020 and incorporates data from CHELSA, ERA5, IMERG (post 2000), and GridSat (pre 2000). The 'Past' variant spans the same period but also includes daily gauge corrections from GHCN-D, GSOD, and some national gauge databases. The 'NRT' variant extends the 'Past_nogauge' record to the present, with a latency of about 3 hours, and is based on ERA5, GDAS, GSMaP, and IMERG.
For evaluations of precipitation product performance using gauge observations as reference, we recommend using the 'Past_nogauge' variant. For most other purposes, the 'Past' variant should be used.
MSWEP, along with other state-of-the-art precipitation products, has been comprehensively validated using the Stage-IV gauge-radar dataset for the United States (Beck et al., 2019b) and using gauge observations from around the globe (Beck et al., 2017). Overall, MSWEP demonstrated superior performance compared to other precipitation products, although there are regions where other products may perform better.#
Cite this page
Acknowledgement of any material taken from or knowledge gained from this page is appreciated:
Beck, Hylke & National Center for Atmospheric Research Staff (Eds). Last modified "The Climate Data Guide: Global high-resolution precipitation: MSWEP.” Retrieved from https://climatedataguide.ucar.edu/climate-data/global-high-resolution-precipitation-mswep on 2026-07-22.
Citation of datasets is separate and should be done according to the data providers' instructions. If known to us, data citation instructions are given in the Data Access section, above.
Acknowledgement of the Climate Data Guide project is also appreciated:
Schneider, D. P., C. Deser, J. Fasullo, and K. E. Trenberth, 2013: Climate Data Guide Spurs Discovery and Understanding. Eos Trans. AGU, 94, 121–122, https://doi.org/10.1002/2013eo130001
Key Figures
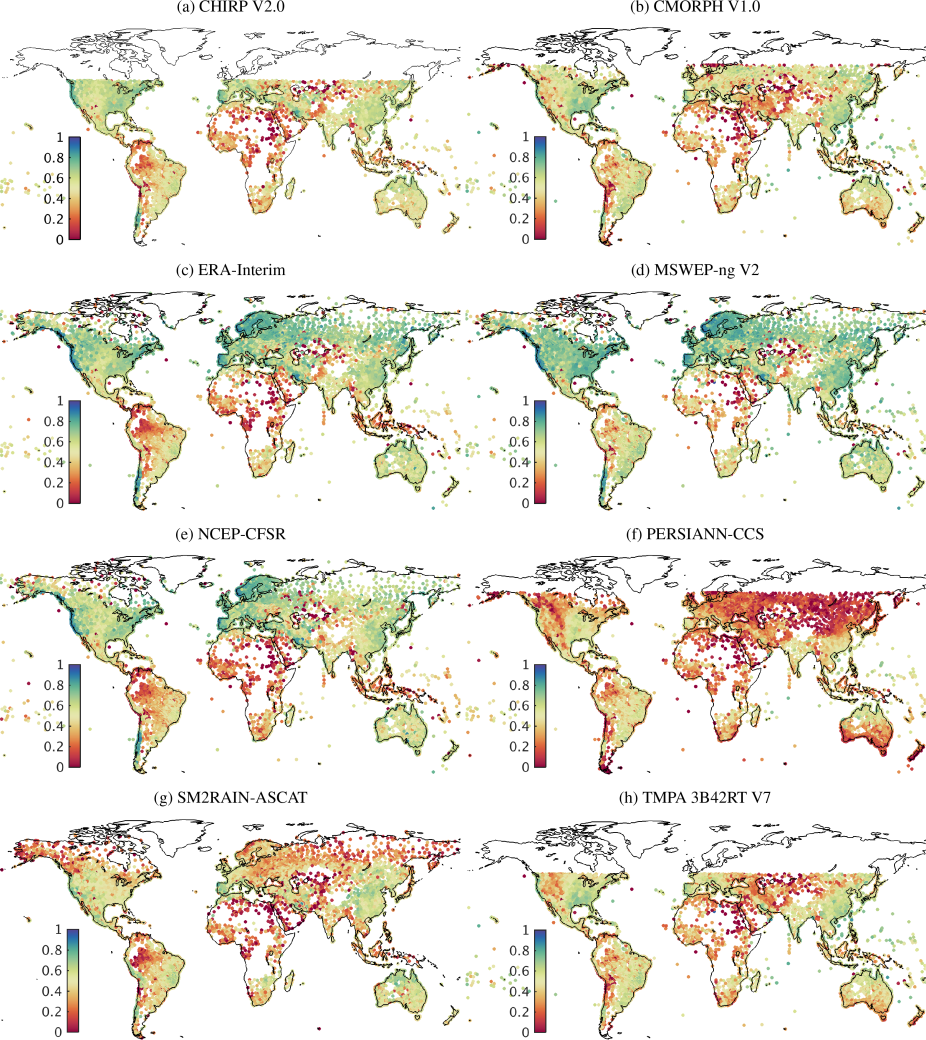
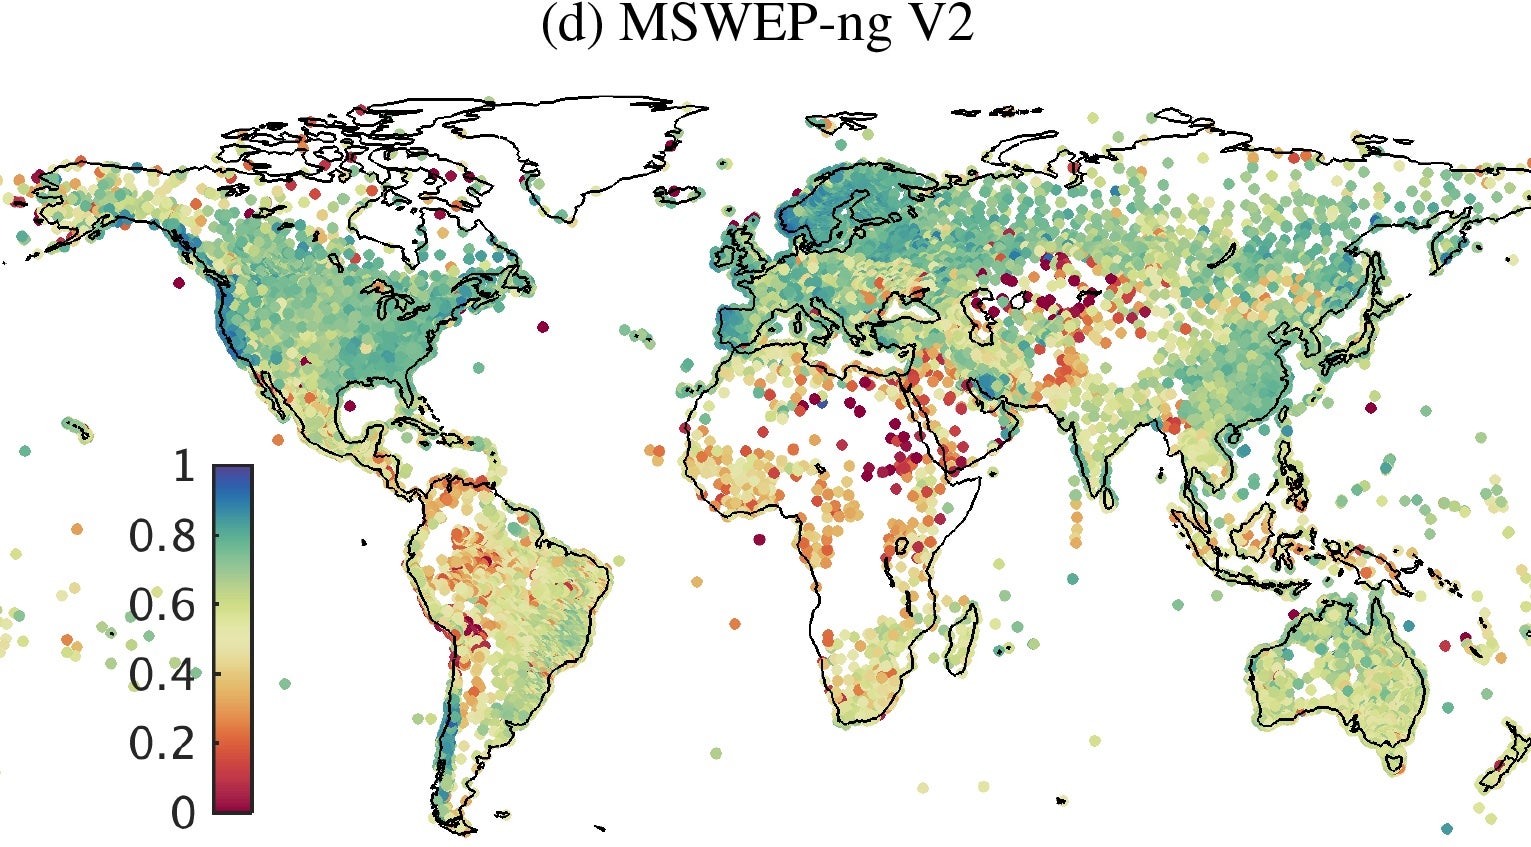
Figure 1. For a selection of the non-gauge-corrected gridded precipitation products, temporal correlations between 3-day mean rain gauge- and product-based time series. Each data point represents a rain gauge. Figure from Beck et al. (2017).
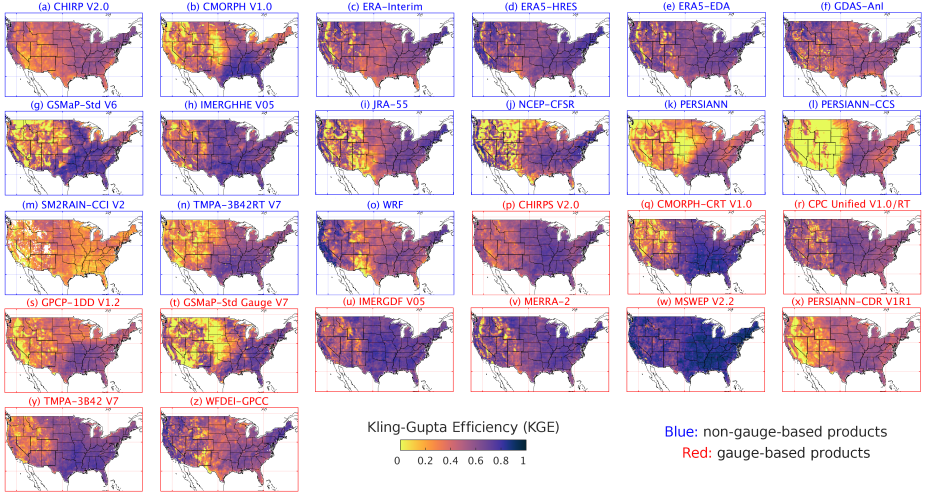
Kling-Gupta Efficiency (KGE) scores for 26 gridded precipitation products using the Stage-IV gauge-radar dataset as a reference. White indicates missing data. Higher KGE values correspond to better performance. Uncorrected products are shown in blue, whereas gauge-corrected products are shown in red. Figure from Beck et al. (2019b).
Other Information
- Beck, H. E., E. F. Wood, T. R. McVicar, M. Zambrano-Bigiarini, C. Alvarez-Garreton, O. M. Baez-Villanueva, J. Sheffield, and D. N. Karger, 2020: Bias Correction of Global High-Resolution Precipitation Climatologies Using Streamflow Observations from 9372
- Beck, H. E., and Coauthors, 2017: Global-scale evaluation of 22 precipitation datasets using gauge observations and hydrological modeling. Hydrol. Earth Syst. Sci., 21, 6201–6217, https://doi.org/10.5194/hess-21-6201-2017.
- Beck, H. E., E. F. Wood, M. Pan, C. K. Fisher, D. G. Miralles, A. I. J. M. van Dijk, T. R. McVicar, and R. F. Adler, 2019a: MSWEP V2 Global 3-Hourly 0.1° Precipitation: Methodology and Quantitative Assessment. Bulletin of the American Meteorological Soc
- Beck, H. E., and Coauthors, 2019b: Daily evaluation of 26 precipitation datasets using Stage-IV gauge-radar data for the CONUS. Hydrol. Earth Syst. Sci., 23, 207–224, https://doi.org/10.5194/hess-23-207-2019.