Precipitation Data Sets: Overview & Comparison table

Main content

Precipitation (rain, snow, hail, ...) is one of the key components of the hydrological cycle. Its societal importance cannot be over stated. For climate research, precipitation is one of the key terms for balancing the energy budget, and one of the most challenging aspects of climate modeling. Hence, high quality estimates of precipitation's distribution, amounts and intensity are essential. However, the very nature of precipitation and the limitations of the observing system make the quantification of precipitation challenging.  Unlike (say) temperature which has a high degree of spatial and temporal correlation, precipitation can be fractal in space and discontinuous in time. Further, regional variations in topography can affect precipitation amounts significantly. Most precipitation data sets may be categorized into one of three broad categories: gauge data sets (e.g. CRU TS, GPCC, APHRODITE, PREC/L), satellite-only data sets (e.g., CHOMPS) and merged satellite-gauge products (e.g. GPCP, CMAP, TRMM 3B42). 

Even with the near-global coverage of satellites, most satellites fly over a region only twice per day, potentially missing precipitation events. For this reason, many data sets combine observations from multiple satellite platforms that carry passive microwave and/or infrared instruments.  Infrared sensors are used to estimate cloud top temperatures, which must be calibrated to some other precipitation estimate. The microwave-based algorithms derive the precipitation signal from both scattering and emission but only the scattering signal is useful over land because of strong variations in surface emissivity that distort the emission. Microwave-only products include CHOMPS and the SSM/I datasets; PERSIANN and CMORPH combine information from passive microwave and infrared.

Climate-quality, gauge-based data sets can be difficult to construct due to the widely distributed and heterogeneous nature of the source data. Moreover, wind and evaporation effects on the gauge measurments, typically resulting in under-catch, need to be considered.

Despite many advances in observing systems and algorithms over the years, validating global precipitation observations, for example through the energy budget approach, has proven challenging. Adler et al (2012) estimate the global (ocean+land)-mean precipitation as 2.6 ± 7% mm/day. Over oceans only,Behrangi et al (2014),  'estimate for 3-yr (2007–09) near-global (80S-80N) oceanic mean precipitation rate is ~2.94 mm/day which is about 9% than the CPC/CMAP rate (2.68 mm/day) and 4% higher than the GPCP rate (2.82 mm/day)'.

Key Strengths

Key Strengths

Provide critical information on the hydrologic cycle and water resources

Key Limitations

Key Limitations

Considerable gaps occur in both satellite- and gauge-based observations

Low intensity and short duration precipitation events tend to be under-sampled

Large uncertainties (~50%) of mean precipitation polewards of 50 degrees in both hemispheres

Other Information

Earth system components and main variables
Type of data product
None
Dataset collections

Years of record
None
Data time period extended
None
Timestep
None
Domain
None
Formats:
None
Input Data
None
Vertical Levels:
None
Missing Data Flag
None
Ocean or Land
None
Spatial Resolution
None
Model Resolution (reanalysis)
None
Data Assimilation Method
None
Model Vintage (reanalysis)
None

Key Publications
  1. Gehne, M., T. M. Hamill, G. N. Kiladis, and K. E. Trenberth, 2016: Comparison of Global Precipitation Estimates across a Range of Temporal and Spatial Scales. Journal of Climate, 29, 7773–7795, https://doi.org/10.1175/jcli-d-15-0618.1.
  2. Sun, Q., C. Miao, Q. Duan, H. Ashouri, S. Sorooshian, and K. Hsu, 2018: A Review of Global Precipitation Data Sets: Data Sources, Estimation, and Intercomparisons. Rev. Geophys., 56, 79–107, https://doi.org/10.1002/2017rg000574.
  3. Adler, Robert F., Guojun Gu, George J. Huffman, 2012: Estimating Climatological Bias Errors for the Global Precipitation Climatology Project (GPCP). J. Appl. Meteor. Climatol., 51, 84–99.
  4. Behrangi, A. et al (2014): An Update on Oceanic Precipitation Rate and Its Zonal Distribution in Light of Advanced Observations from Space. J. Climate, 27(11)
  5. Bosilovich, Michael G., Junye Chen, Franklin R. Robertson, Robert F. Adler, 2008: Evaluation of Global Precipitation in Reanalyses. J. Appl. Meteor. Climatol., 47, 2279–2299
  6. Huffman, G. J. (2006): Satellite-Based Estimation of Precipitation Using Microwave Sensors. Encyclopedia of Hydrological Sciences
  7. Kidd, C., P. Bauer, J. Turk, G. J. Huffman, R. Joyce, K.-L. Hsu, D. Braithwaite, 2012: Intercomparison of High-Resolution Precipitation Products over Northwest Europe. J. Hydrometeor, 13, 67–83.
  8. Maggioni, V. et al (2014): An Error Model for Uncertainty Quantification in High-Time Resolution Precipitation Products. J. Hydrometeor., 15(3)
  9. Sapiano, M. R. P., P. A. Arkin, 2009: An Intercomparison and Validation of High-Resolution Satellite Precipitation Estimates with 3-Hourly Gauge Data. J. Hydrometeor, 10, 149–166.
  10. Trenberth, K. E., A. Dai, G. van der Schrier, P. D. Jones, J. Barichivich, K. R. Briffa, and J. Sheffield^, 2014: Global warming and changes in drought. Nature Climate Change, 4, 17-22
  11. Trenberth, K. (2011): Changes in Precipitation with Climate Change. Clim. Res. 47: 123-138
  12. Wang, J-J et al (2014): An Updated TRMM Composite Climatology of Tropical Rainfall and Its Validation. J. of Climate, 27(1), 273-284

Summary of precipitation datasets

Name Snapshot Source Domain Years of record Timestep Spatial Resolution Formats Input Data
An overview of paleoclimate information from high-resolution lake sediment records: Strengths, limitations and key databases Table showing Common physical, geochemical, and biological lake sediment proxy types. contributed by Laura Larocca and Ellie Broadman Global Annual, Decadal, Irregular ascii, csv, Linked Paleo Data (LiPD)
APHRODITE: Asian Precipitation - Highly-Resolved Observational Data Integration Towards Evaluation of Water Resources
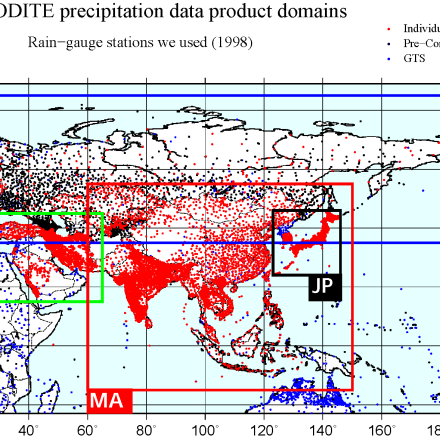
 Figure 1 (Contributed by A. Yatagai) Hirosaki University Asia to Climatology, Daily 0.25x0.25 , 0.5x0.5 (whole Asia), , 0.05x0.05 (Japan only) ascii, binary, netCDF
CHELSA high-resolution land surface temperature and precipitation CHELSA high resolution comparison  (contributed by D Karger) 
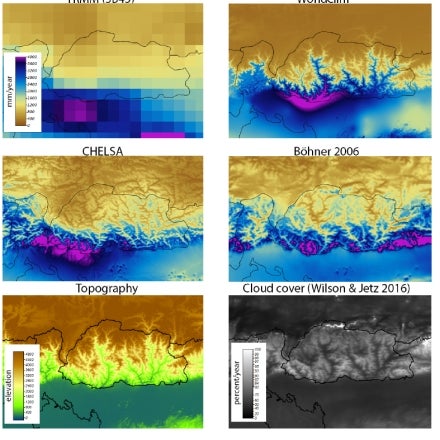
Swiss Federal Research Institute WSL , University of Hamburg , University of Zurich , University of Goettingen Global to Climatology, Monthly 30 arc sec GeoTIFF

ERA-Interim downscaled with geographic predictors and bias-corrected precip

CHIRPS: Climate Hazards InfraRed Precipitation with Station data (version 2) Pentad timeseries of the annual land climatological (1983-2014) hydroclimate in the Eastern Caribbean (Lesser Antilles). (provided by Carlos Martinez) 
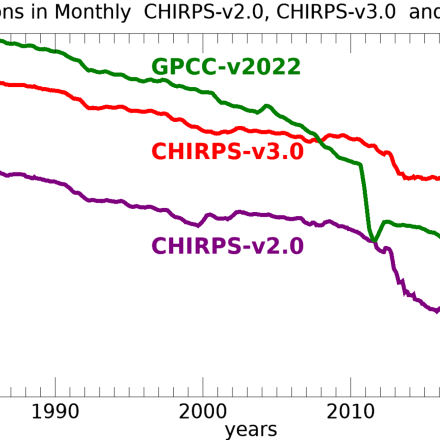
Climate Hazards Center - UC Santa Barbara Global to Climatology, Sub-daily, Daily, Monthly, Seasonal, Pentad 0.05 or 0.1 degree GeoTIFF, netCDF

microwave & infrared satellite data blended with station data

CMAP: CPC Merged Analysis of Precipitation
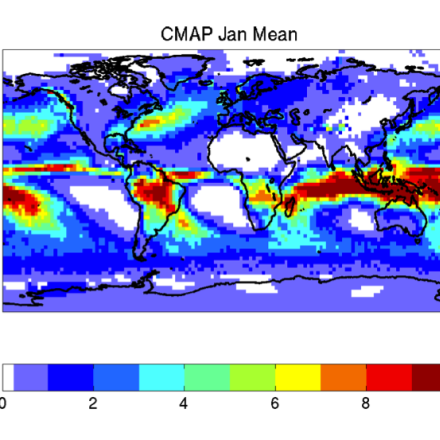
 CMAP precipitation in January NOAA CPC/Dr. Pingping Xie Global to Monthly, Pentad 2.5 x 2.5 ascii, netCDF

gague analysis; microwave and infrared observations from polar orbiting and geostationary satellites

CMORPH (CPC MORPHing technique): High resolution precipitation (60S-60N) Climate Data Guide Image: CMORPH 
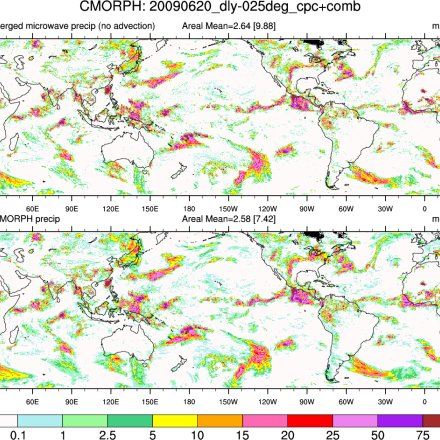
Climate Prediction Center/R. Joyce, J.Janowiak Global to Sub-daily, Daily 0.25x0.25 netCDF, binary

satellite microwave

Coral geochemical records: An overview of their use as climate proxies and of available databases Image of a fossil coral on a beach in Vanuatu (Image credit: R. Domeyko, UT Austin). Atlantic Ocean, Indian Ocean, Pacific Ocean, Tropics ascii, HTML Table, Linked Paleo Data (LiPD), Matlab
COREv2 Air-Sea Surface Fluxes NCAR / Bill Large & Steve Yeager Global to Monthly netCDF
CPC Unified Gauge-Based Analysis of Global Daily Precipitation
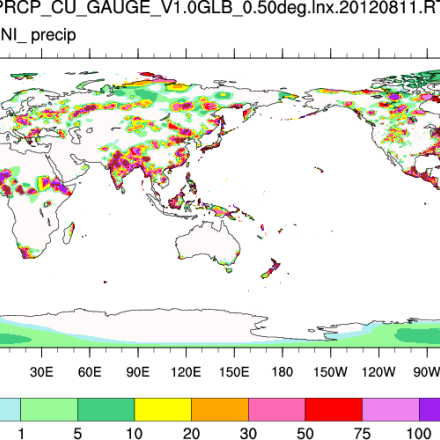
 Climate Data Guide: CPC Unified Guage Based precipitation Climate Prediction Center Global to Daily 0.5x0.5 binary

station gague data

CRU TS Gridded precipitation and other meteorological variables since 1901 
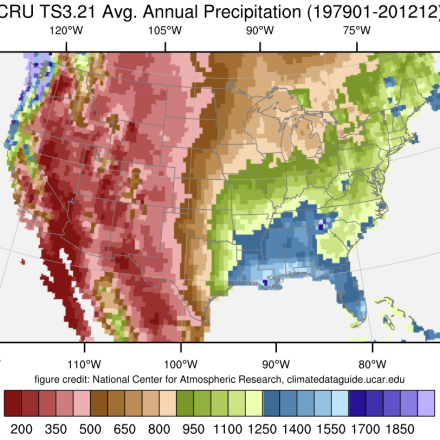
Climatic Research Unit (CRU) / Ian Harris, Phil Jones Global to Climatology, Monthly 0.5x0.5 netCDF, ascii

~4000 station records primarily from CLIMAT, Monthly Climatic Data from the World, and World Weather Records

Daymet: Daily Surface Weather and Climatological Summaries map of Tmin over eastern US (credit: Michele Thornton) 
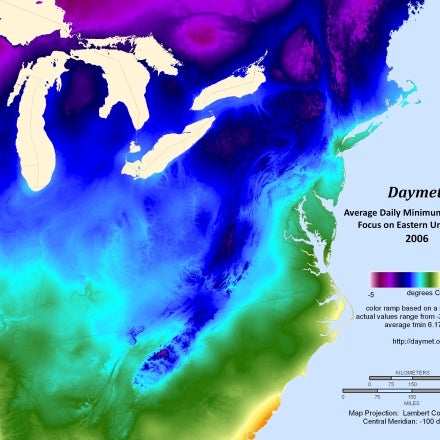
ORNL/ Michele Thornton and Peter Thornton North America to Climatology, Daily 1km x 1km in 2x2 tiles ascii, GeoTIFF, netCDF

in-situ station observations, specifically from GHCN-daily

E-OBS: High-resolution gridded mean/max/min temperature, precipitation and sea level pressure for Europe & Northern Africa E-OBS_sample_picture_Daily_Maximum_Temperature (contributed by G van Der Shrier) 
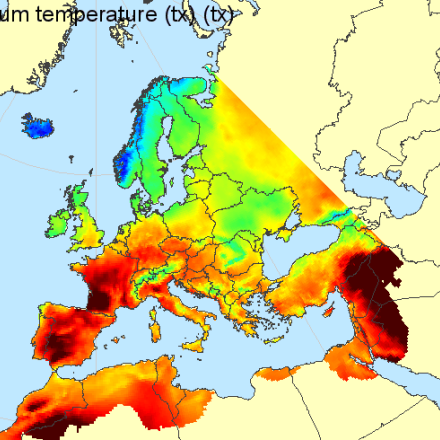
Copernicus Climate Change Service , Royal Netherlands Meteorological Institute Europe to Daily 0.1 x 0.1 degrees netCDF

station data

GHCN-D: Global Historical climatology Network daily temperatures
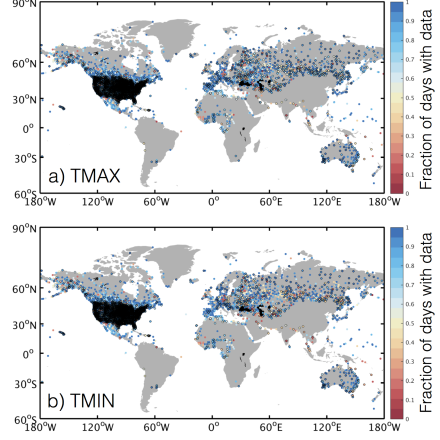
 Distribution of GHCN-D stations (contributed by K. McKinnon) NOAA/ NCEI Global to Daily ascii
Global (land) precipitation and temperature: Willmott & Matsuura, University of Delaware U. Delaware / Cort J. Willmott, Kenji Matsuura Global to Climatology, Monthly 0.5x0.5 degree ascii, netCDF

land stations from GHCNv2 and a few other sources

Global high-resolution precipitation: MSWEP Maps showing temporal correlations between 3-day mean rain gauge- and product-based time series. H.E. Beck, GloH2O.org, King Abdullah University of Science and Technology (KAUST) Global to Sub-daily 0.1° netCDF

gauge, satellite, and reanalysis precipitation estimates

GPCC: Global Precipitation Climatology Centre Climate Data Guide Image: GPCC precipitation for May,2012 GPCC operated by DWD under the auspices of the World Meteorological Organization (WMO) Global to Climatology, Daily, Monthly 0.5x0.5, 1x1, 2.5x2.5 ascii, netCDF

station gague data

GPCP (Daily): Global Precipitation Climatology Project Zonal-mean rain frequency in GPCC 1dd (contributed by A. Pendergrass) GSFC (NASA): G. Huffmann, D. Bolvin, R. Adler Global to Daily 1x1 netCDF, binary

station rain guage, satellite data

GPCP (Monthly): Global Precipitation Climatology Project Map of significant trends in precipitation, according to GPCP v2.2. (contributed by A. Pendergrass) GSFC (NASA) / G. Huffman, D. Bolvin, R. Adler, JJ Wang Global to Climatology, Monthly 2.5 x 2.5 (monthly) binary, netCDF

rain gauge stations, satellites, and sounding observations

HadISD: Sub-daily, non-interpolated weather station data Station coverage and length of record (note that short-length stations obscure long ones in some dense regions here) (contributed by Colin Raymond) 
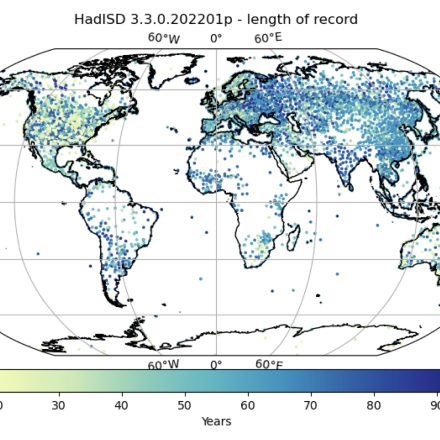
Met Office - Hadley Centre | Robert Dunn Global to Sub-daily netCDF
HOAPS: Hamburg Ocean Atmosphere Parameters and Fluxes from Satellite Data Climate Data Guide Image: HOAPS-3: Annual mean freshwater flux (E-P) for 2005. 
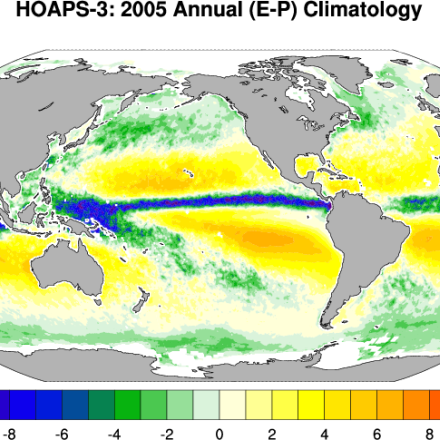
A. Andersson (DWD), S. Bakan (MPI), K. Fennig (DWD), C. Klepp (Uni. Hamburg) Global to Climatology, Sub-daily, Monthly, Pentad 0.5 x 0.5 netCDF

SSM/I passive microwave radiometers, except for the SST, which is taken from AVHRR

IMERG precipitation algorithm and the Global Precipitation Measurement (GPM) Mission A snapshot of the global precipitation field from IMERG V07 
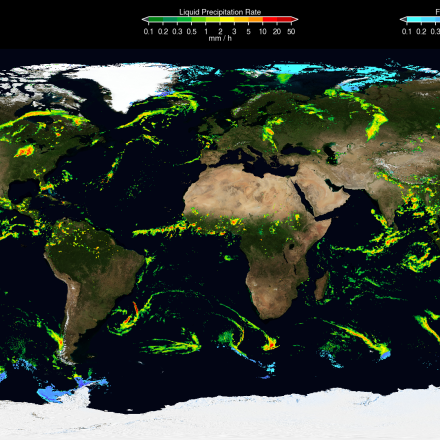
NASA & Japan Aerospace Explorartion Agency Global to Sub-daily, Daily, Monthly 0.1x0.1 GeoTIFF, HDF, netCDF, OPeNDAP

multiple bands (microwave, IR, visible) from multiple satellites

Livneh gridded precipitation and other meteorological variables for continental US, Mexico and southern Canada
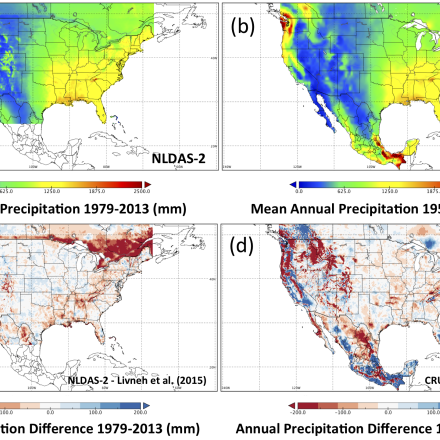
 Figure 1 (contibuted by B. Livneh) Dr. Ben Livneh, University of Colorado North America to Daily, Monthly 1/16 degree (~6 km) netCDF

GHCN-daily; Environment Canada; Servicio Meteorológico Nacional (Mexico); NCEP-NCAR Reanalysis

NLDAS: North American Land Data Assimilation System
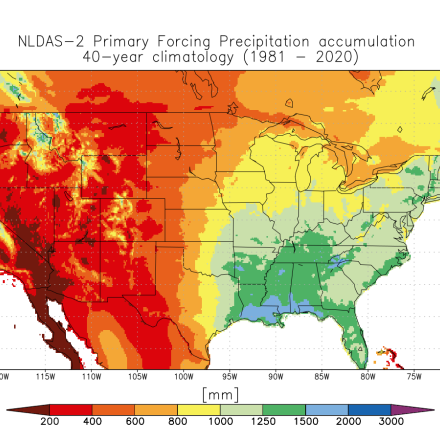
 NLDAS-2 Primary Forcing Precipitation annual climatology for 1981-2020. NASA, NOAA, Princeton, U. Washington North America to Climatology, Sub-daily, Monthly 0.125 (224 points latitude x 464 points longitude) GRIB, netCDF

observations & model reanalysis

PERSIANN-CDR: Precipitation Estimation from Remotely Sensed Information using Artificial Neural Networks - Climate Data Record infographic (contributed by R Cullather) UCI Center for Hydrometeorology & Remote Sensing (CHRS): S. Sorooshian Global to Sub-daily, Daily 0.25x0.25 binary, netCDF

directly: IR satellite, indirectly: NCEP stage IV precipitation data, rain gauge, PMW satellite data

PRISM High-Resolution Spatial Climate Data for the United States: Max/min temp, dewpoint, precipitation PRISM winter preciptiation in western Colorado. Oregon State Univ (USDA, NOAA)/ C. Daly North America to Climatology, Daily, Monthly 4 km, 800m ARC/INFO ASCII GRID, netCDF
TerraClimate: Global, high-resolution gridded temperature, precipitation, and other water balance variables 1981-2010 average Dec-February climatic water deficit for Tasmania as represented in TerraClim (contributed by J. Abatzoglou) John Abatzoglou, University of California - Merced Global to Climatology, Monthly ~4 km (1/24th degree) netCDF

WorldClim, CRUTS4.0

TRMM: Tropical Rainfall Measuring Mission TRMM and GPCP (contributed by A. Pendergrass) 
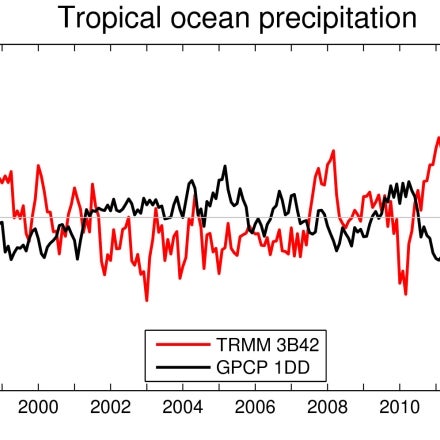
NASA & Japan's National Space Development Agency Tropics to Sub-daily, Daily, Monthly 0.25x0.x25 , ~40S - 40N and ~50S - 50N HDF, netCDF

satellite microwave and IR; gauge (for calibration)

Tropical Moored Buoy System: TAO, TRITON, PIRATA, RAMA (TOGA) USA, Japan, France, Brazil, Indonesia, China/ M.J. McPhaden, others Tropics to Sub-daily, Daily, Monthly, Weekly netCDF, ascii

Moored Bouy