ICOADS Surface Marine Weather Observations
ICOADS (International Comprehensive Ocean-Atmosphere Data Set) is the most comprehensive archive of global marine surface climate observations available. Variables include SST, SLP, air temperature, wind speed, cloud amount, and others. There is no processing beyond initial quality control. ICOADS data are packaged in several different formats with different time periods, timesteps, and grid resolutions. Scattered observations extend back to 1662, but climate scientists will probably be most interested in the monthly summary statistics that span 1800-current on a 2°x2° grid, or 1960-current on a 1°x1° grid.
Key Strengths
Very long timeseries of several climate variables available in many locations
Provides "ground truth" of the original measurements from which other, interpolated products are derived (e.g. NOAA ERSST; HadSLP2)
Statistics such as standard deviations, precentiles, and number of observations are published along with the monthly means
Key Limitations
No corrections (e.g., to account for changes in observing practices or instrumentation) are applied beyond basic quality control
Data coverage is sparse, and creating comprehensible maps of a given climate variable can take some processing and patience
see download websites
Expert User Guidance
#General Description
The International Comprehensive Atmosphere-Ocean Data Set (ICOADS) is the most extensive and widely used digital collection of quality-controlled surface weather observations available for the world oceans for studies of marine climate and its variability. The data set begins in 1800, and currently extends through 2007 with updates every several years. The ICOADS includes monthly values each year of sea surface temperature (SST), air temperature, wind, cloudiness, barometric pressure, and humidity, as well as derived variables such as turbulent heat and momentum pseudo-fluxes ("pseudo" because they neglect transfer coefficients). The number of observations and the standard deviation of the individual observations that make up each monthly value are also archived for each variable. This important data set forms the basis for our empirical knowledge of surface marine climate and its variability during the past two centuries.
The majority of the observations come from ships-of-opportunity, supplemented in recent years by research vessels, moored environmental buoys, drifting buoys, and near-surface measurements from hydrographic profiles. The data are binned into 2 x 2 latitude-longitude boxes (1x1 summaries are also available since 1960). Each variable is subjected to quality-control procedures to remove outliers and duplicates. The screened values are not corrected for changes in instrumentation, observing practice, ship type, etc; missing grid boxes are not filled in; and no "analysis" of the data is performed (e.g., no spatial or temporal smoothing or interpolation).
Due to the uneven distribution of commercial shipping routes and changes in those routes over time, data coverage is poor in certain regions and periods (see "Coverage Maps" for data distribution by variable by decade). Broadly speaking, the North Atlantic, western South Atlantic and northern Indian Oceans contain the highest density of observations, with reasonable coverage back to about 1870. Data coverage is limited in the North Pacific before about 1946 and in the Tropics before about 1960; the Southern Oceans remain poorly sampled throughout the record.
The lack of spatial and temporal smoothing in the ICOADS archive, along with large uncertainties in individual monthly mean values due to inadequate sampling, makes it difficult to produce comprehensible maps of a particular climatic variable for a specific month and year without additional processing of the data. Aggregating the data over many months and/or years, and use of judicious smoothing and/or interpolation in space, can dramatically enhance the large-scale coherency of anomaly patterns by reducing noise associated with random errors and sampling fluctuations (recall that the standard error of the mean decreases by the square-root of the number of observations: see Trenberth et al., 1992 for further discussion). Smoothing/interpolation procedures may be as simple as running means in the zonal and meridional directions, followed by linear interpolation across a specified number of missing grid boxes (c.f. Deser and Wallace, 1990; Mitchell and Wallace ?? for examples in the Tropical Pacific). More sophisticated procedures such as statistical optimization methods may also be employed. For example, Kaplan (1997, 1999) uses Empirical Orthogonal Function (EOF) analysis as a basis for interpolating across missing grid boxes and smoothing in space and time for SST and SLP (similar procedures are employed for SST in Rayner et al., 1996).
The quality-controlled surface marine climate observations that constitute the ICOADS archive also serve as input to more sophisticated "data sets" which employ statistical and empirical procedures directed at improving data homogeneity and signal-to-noise ratios; for example, filling in missing grid boxes, correcting for changes in instrumentation and observing practice, and smoothing in space and time. These "value-added" data sets are tremendously useful for certain applications (for example, as contourable fields or as model boundary conditions), but it should be remembered that observational analyses of climatic variations are limited ultimately by the quality, quantity and distribution of the original measurements (c.f., Hurrell and Trenberth, 1999). As such, the limited processing of the data contained in the ICOADS archive remains a virtue and serves as "ground truth" for our empirical knowledge of surface marine climate and its variability since the mid 19th century.
Strategies for making optimal use of ICOADS data
Physical consistency among variables
Because ICOADS contains many climatic variables which are measured independently but are physically related, evaluating the data for physical consistency provides a powerful tool for assessing the reliability of climatic signals. This approach has been adopted in many studies for wind and temperature: for example, SLP gradients may be compared with winds following a geostrophic or frictional momemtum balance, and SSTs may be compared against marine air temperatures due to the close coupling between these quantities via the turbulent flux of sensible heat. Relevant studies on wind and SLP comparisons include Ramage (1987), Wright (1988), Harrison (1989), Cardone et al., 1990, Deser and Blackmon (1993) and Ward and Hoskins (1996). Some of these studies report spurious trends in certain regions and time periods: for example, an upward trend in wind speed associated with the change from visual estimation of sea state to measurements by anemometers. Useful studies on SST and air temperature relationships include those of Wright (1986), Trenberth et al. (1992), Kent et al. (1993) and Folland and Parker (1995). These studies document an upward trend in SST associated with the change from bucket to engine-intake temperatures over much of the world oceans. Data sets which attempt to correct for these spurious trends include Bottomley et al. (1990) and da Silva et al. (1994). The former study also advocates the use of nighttime marine air temperatures due to the possible contamination of daytime air temperatures by solar heating of thermistor shields.
Removal of the mean annual cycle before averaging in space and time
If one is interested in climatic signals on time scales longer than the annual cycle, it is best to work with monthly anomalies rather than monthly totals, where monthly anomalies are defined as departures from the long-term mean annual cycle: e.g., the difference between a value for a given month and a particular year from the climatological value for that month based upon a sufficiently long period of record. If monthly totals are needed, the climatological annual cycle may then be added back in to the monthly anomalies. Before defining monthly anomalies, it may be desirable to form smoothed climatological background fields to further reduce noise levels. The reason that it is preferable to work with monthly anomalies rather than monthly totals in a data set such as ICOADS is that missing data may result in severe aliasing of variability associated with the annual cycle into variability on longer time scales (e.g., interannual and beyond). For example, time averages (seasonal, annual, etc.) of monthly totals in which different months are missing in different years will result in spurious signals associated with inadequate sampling of the annual cycle rather than real climatic variability. Similarly, inadequate sampling of spatial gradients due to missing grid boxes (with different boxes missing in different months/years) will alias signals associated with long-term mean spatial gradients into spurious temporal variability. The study by Bottomley et al. (1990) provides a nice illustration of the practical application of some of these procedures to SST data.
Additional comments by variable
SST
Trenberth et al. (1992) provide a comprehensive discussion of the sources of errors in estimating monthly mean SSTs from ship data, and provide a detailed analysis of noise levels by month and region. Comparison is also made between ICOADS SSTs and air temperatures, and between SSTs from ICOADS and Bottomley et al. (1990). Much of the discussion of errors and noise levels may be carried over to other variables such as SLP or wind. As far as we know, there are no analogous, comprehensive studies of noise levels in other ICOADS fields, although this is desirable.
(Clara Deser NCAR, May, 2001) [minor changes to the comments were made to reflect Release 2.5]##
Expert Developer Guidance
In addition to the ICOADS website, an excellent summary is provided by Woodruff et al. (2011):
Release 2.5 of the International Comprehensive Ocean-Atmosphere Data Set (ICOADS) is a major update (covering 1662–2007) of the world's most extensive surface marine meteorological data collection. Building on extensive national and international partnerships, many new and improved contributing datasets have been processed into a uniform format and combined with the previous Release 2.4. The new data range from early non-instrumental ship observations to measurements initiated in the twentieth century from buoys and other automated platform types. Improvements to existing data include replacing preliminary Global Telecommunication System (GTS) receipts with more reliable, delayed mode reports for post-1997 data, and in the processing and quality control (QC) of humidity observations. Over the entire period of record, spatial and temporal coverage has been enriched and data and metadata quality has been improved. Along with the observations, now updated monthly in near real time, Release 2.5 includes quality-controlled monthly summary products for 2° latitude × 2° longitude (since 1800) and 1° × 1° boxes (since 1960), together with multiple options for access to the data and products. The measured and estimated data in Release 2.5 are subject to many technical changes, multiple archive sources, and historical events throughout the more than three-century record. Some of these data characteristics are highlighted, including known unresolved errors and inhomogeneities, which may impact climate and other research applications. Anticipated future directions for ICOADS aim to continue adding scientific value to the observations, products, and metadata, as well as strengthen the cooperative enterprise through expanded linkages to international initiatives and organisations. Copyright © 2010 Royal Meteorological Society
Cite this page
Acknowledgement of any material taken from or knowledge gained from this page is appreciated:
Deser, Clara & National Center for Atmospheric Research Staff (Eds). Last modified "The Climate Data Guide: ICOADS Surface Marine Weather Observations.” Retrieved from https://climatedataguide.ucar.edu/climate-data/icoads-surface-marine-weather-observations on 2026-02-19.
Citation of datasets is separate and should be done according to the data providers' instructions. If known to us, data citation instructions are given in the Data Access section, above.
Acknowledgement of the Climate Data Guide project is also appreciated:
Schneider, D. P., C. Deser, J. Fasullo, and K. E. Trenberth, 2013: Climate Data Guide Spurs Discovery and Understanding. Eos Trans. AGU, 94, 121–122, https://doi.org/10.1002/2013eo130001
Key Figures

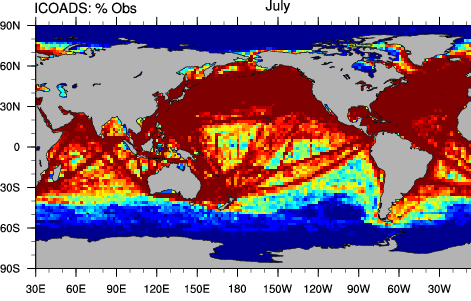
ICOADS 2 degree: Long term mean July sea surface temperature and percent of observations (1981-2010). (Climate Data Guide; D. Shea)
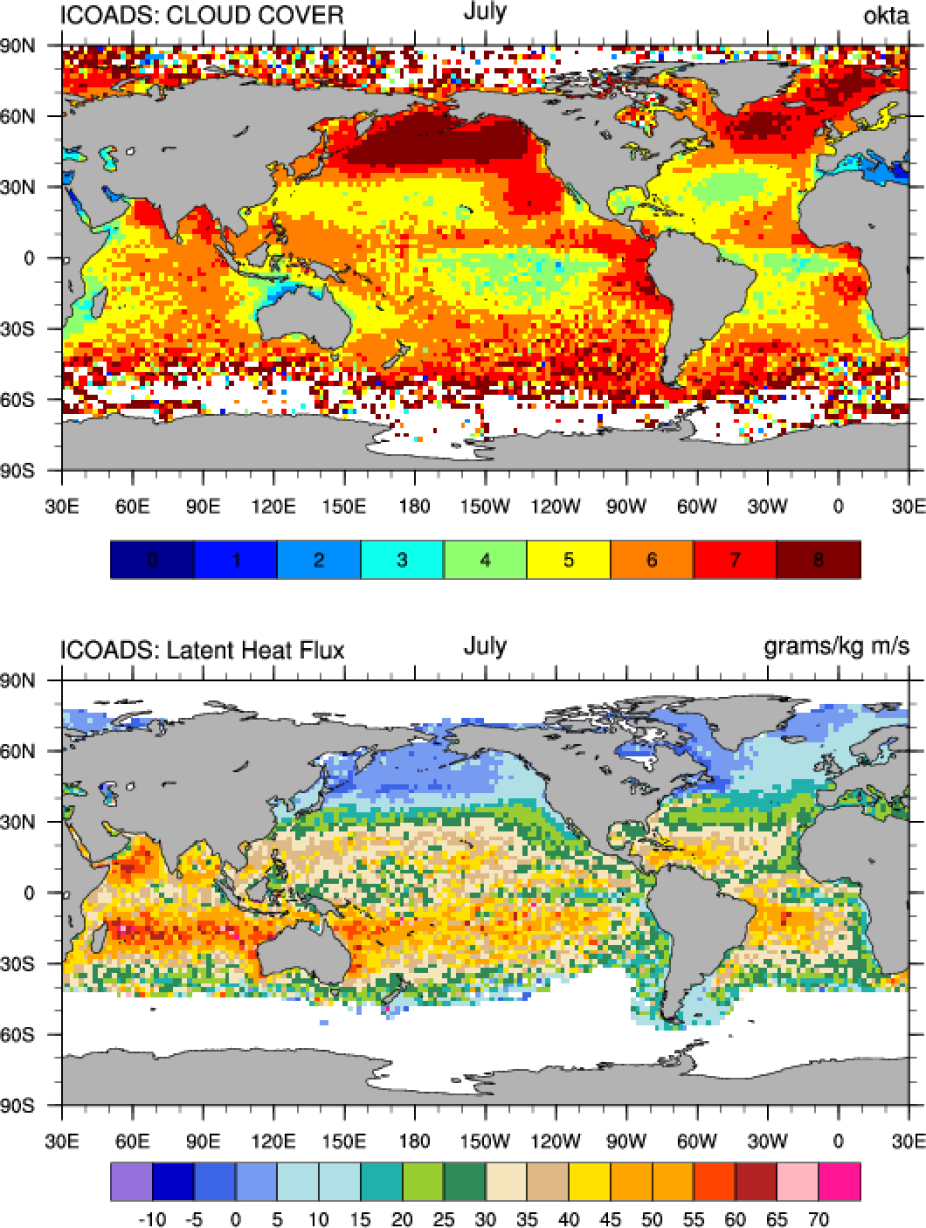
ICOADS 2 degree: Long term mean July cloud cover and latent heat flux (1981-2010). (Climate Data Guide; D. Shea)
Other Information
- Woodruff, S.D. and others, 2011: ICOADS Release 2.5: extensions and enhancements to the surface marine meteorological archive, Int. J. Climatol. 31, 951-967. doi:10.1002/joc.2103
- Please also see the publications on the ICOADS website
- Deser, C., A. S. Phillips, and M. A. Alexander, 2010: Twentieth Century Tropical Sea Surface Temperature Trends Revisited. Geophys. Res. Lett., 37, L10701, doi:10.1029/2010GL043321.
- Berry DI, Kent EC (2009) A new air–sea interaction gridded dataset from ICOADS with uncertainty estimates. Bull Am Meteorol Soc 90:645–656