Pacific Decadal Oscillation (PDO): Definition and Indices
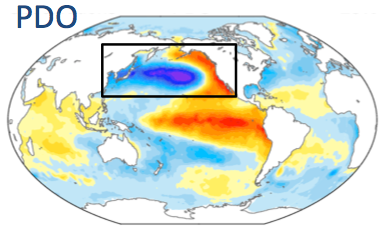
The Pacific Decadal Oscillation (PDO) is defined by the leading pattern (EOF) of sea surface temperature (SST) anomalies in the North Pacific basin (typically, polewards of 20°N). The SST anomalies are obtained by removing both the climatological annual cycle and the global-mean SST anomaly from the data at each gridpoint. Positive values of the PDO index correspond with negative SST anomalies in central and western North Pacific (extending eastwards from Japan), and positive SST anomalies in the eastern North Pacific (along the west coast of North America). The positive phase of the PDO is also associated with positive SST anomalies across the central and eastern tropical Pacific. A weak mirror image of these anomalies occur across the South Pacific. Overall, the PDO's spatial pattern resembles that of ENSO. The largest distinction between the PDO and ENSO is their timescales: While ENSO is primarily an interannual phenomenon, the PDO is decadal in scale. Thus, relatively long data records are needed to define and understand the PDO.
Key Strengths
Concise description of a spatially coherent, large-scale mode of decadal climate variability across the Pacific basin
Robust pattern across many datasets (e.g. HadISST, ERSST, Kaplan SST, etc.) and also simulated in models
Associated with societally relevant impacts on precipitation, temperature, snowpack, and drought, especially in western North America
Key Limitations
Requires a long timeseries to define (50+ years)
Can be difficult to distinguish PDO-related anomalies from interannual variability (ENSO) and long-term trends in sea surface temperature
Does not explicitly include the tropical and south Pacific oceans, but exhibits strong correlations with these regions
Expert User Guidance
The following was contributed by Dr. Clara Deser, NCAR, December, 2015:
The Pacific Decadal Oscillation (PDO), first defined by Mantua et al. (1997), is the dominant year-round pattern of monthly sea surface temperature (SST) anomalies in the North Pacific obtained via Empirical Orthogonal Function (EOF) analysis. The SST anomalies (denoted SST*) are defined as departures from the climatological annual cycle from which the global mean SST anomaly has been subtracted (as a way of removing any long-term trends that might be associated with changes in external forcing [see also commentary by Dr. Kevin Trenberth, below]). The PDO accounts for 27% of the SST* variance in the HadISST (Rayner et al., 2003) data set during the period 1870–2014. The spatial pattern is computed by linearly regressing SST anomalies at each location over the global oceans upon the associated normalized Principal Component (PC) time series. The EOF pattern and normalized PC record are displayed in the top row of Figure 1. The results are robust across different data sets, with small variations prior to 1920 when the data coverage is reduced (Newman et al., 2015). The minimum length of record needed to define the PDO is estimated to be about 50 years (Wen et al., 2014; Newman et al., 2015).
In its positive phase, the PDO pattern consists of negative SST* in the central and western North Pacific, and positive SST* in the eastern North Pacific (opposite signs obtain for the negative phase). The North Pacific PDO pattern is linked to SST* in other parts of the global ocean, most notably the tropical Pacific where it resembles the ENSO pattern, with positive SST* in the eastern equatorial Pacific surrounded by negative SST* in the subtropical western Pacific of both hemispheres. The PDO time series exhibits pronounced decadal-scale variability, clearly discernible even with monthly data. Periods of predominantly negative PDO phase include 1905-1925, 1947-1976 and 1998-2013, with periods of predominantly positive PDO phase in between. These prolonged intervals of mainly one sign give the PDO its name. The PDO is correlated with hydro-climate over North America, including precipitation, temperature, snowpack, streamflow and drought (e.g., Gershunov and Barnett, 1998; McCabe and Dettinger, 2002; McCabe et al., 2012; Dai 2012; Wang et al., 2014; among others). These impacts are primarily driven by associated variability in the large-scale atmospheric circulation, rather than directly by the PDO SST anomalies themselves.
The PDO can be compared with the global pattern of SST* associated with ENSO, here defined as the leading EOF of monthly SST* over the full Pacific basin (lower panel of Fig. 1) but a nearly identical pattern is obtained by regressing SST* on the canonical Nino3.4 SST Index (not shown). As discussed in Zhang et al. (1997), the spatial patterns of the PDO and ENSO are very similar, except for the relative magnitudes of SST* in the tropics vs. extra-tropics of the Pacific: ENSO emphasizes the equatorial region, while the PDO emphasizes the North Pacific. Despite their similar spatial patterns, the time series of ENSO and the PDO are distinct: ENSO is predominantly an interannual phenomenon while the PDO is primarily decadal in scale as confirmed by their power spectra (Fig. 2).
While the physical mechanisms underlying ENSO are relatively well understood (c.f. Neelin, 2012), the dynamics of the PDO are still under investigation. A recent review by Newman et al. (2015) advances the emerging consensus view that the PDO is not a single phenomenon, but rather a combination of atmospheric and oceanic processes that span the tropics and extratropics. These include: tropical ENSO dynamics; atmospheric teleconnections from the tropics to the North Pacific; and intrinsic plus tropically-driven atmospheric forcing of North Pacific SST* via surface energy fluxes, Ekman currents, and oceanic Rossby waves. The thermal and dynamical inertia of the ocean contributes to the PDO’s low-frequency temporal character, while atmospheric processes are responsible for the PDO’s large-scale spatial coherence. The Newman et al. (2015) paradigm of the PDO has implications for its predictability as well as paleo-reconstructions based on climate proxy indicators.
Another closely-related pattern of ENSO-like decadal variability is the “Interdecadal Pacific Oscillation” (IPO; Power et al., 1999; Folland et al., 2002, Parker et al. 2007; Henley et al. 2015). The IPO’s definition varies, but is typically obtained as the leading EOF of decadal low-pass filtered SST* over the full Pacific basin or the entire globe. The spatial patterns of the PDO and IPO are very similar except that the former emphasizes the North Pacific more than the latter; the monthly PDO and IPO time series are correlated at 0.74 (Newman et al., 2015).##
The following was contributed by Dr. Kevin Trenberth, NCAR, August, 2015:
The increasing human influence on climate, mainly through changes in atmospheric composition, produce global warming. Many variables and climate indices are therefore influenced by associated with externally-forced long-term trends and any analysis of variance can be dominated by these recent trends. It is therefore desirable to remove the trends to examine the underlying variability and associated patterns. One approach has been to fit a linear trend to a time series of an index, but this is a seriously flawed procedure because (i) it depends on the length of the time series; (ii) it implies the trend goes on indefinitely into the future and into the past; and (iii) there is no such trend evident in the earlier part of the 20th Century. A relatively simple approach instead is to use the global mean time series as a primary indicator of the non-stationary component, and remove that from each grid point prior to carrying out an analysis. This approach has been shown to work effectively by using model results, where the cause of the non-stationarity is known. A good example is the AMO, which is based on an index of area average SST over the North Atlantic from 0 to 60N (see Trenberth and Shea (2006)). The PDO is also derived from SSTs where the global mean has been removed, and a determination of the first mode of variability for 20-70N over the North Pacific (see Trenberth and Fasullo (2013)).##
Cite this page
Acknowledgement of any material taken from or knowledge gained from this page is appreciated:
Deser, Clara &, Trenberth, Kevin & National Center for Atmospheric Research Staff (Eds). Last modified "The Climate Data Guide: Pacific Decadal Oscillation (PDO): Definition and Indices.” Retrieved from https://climatedataguide.ucar.edu/climate-data/pacific-decadal-oscillation-pdo-definition-and-indices on 2026-06-24.
Citation of datasets is separate and should be done according to the data providers' instructions. If known to us, data citation instructions are given in the Data Access section, above.
Acknowledgement of the Climate Data Guide project is also appreciated:
Schneider, D. P., C. Deser, J. Fasullo, and K. E. Trenberth, 2013: Climate Data Guide Spurs Discovery and Understanding. Eos Trans. AGU, 94, 121–122, https://doi.org/10.1002/2013eo130001
Key Figures
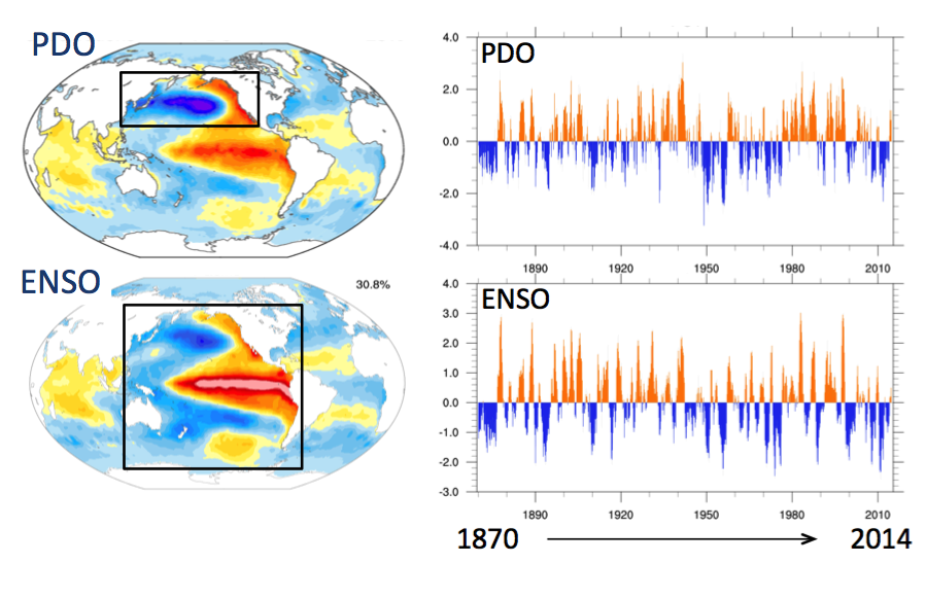
Figure 1. Global expression of the PDO (top left) and ENSO (bottom left), obtained by linearly regressing monthly SST* anomalies at each grid box upon the leading Principal Component (PC) time series based on the domains outlined in the black boxes. The PDO and ENSO time series, defined by their corresponding PCs, are shown in the top right and bottom right, respectively. Based on the HadISST data set (Rayner et al., 2003) for the period 1870-2014. Adapted from Deser et al. (2010). (Contributed by C. Deser)
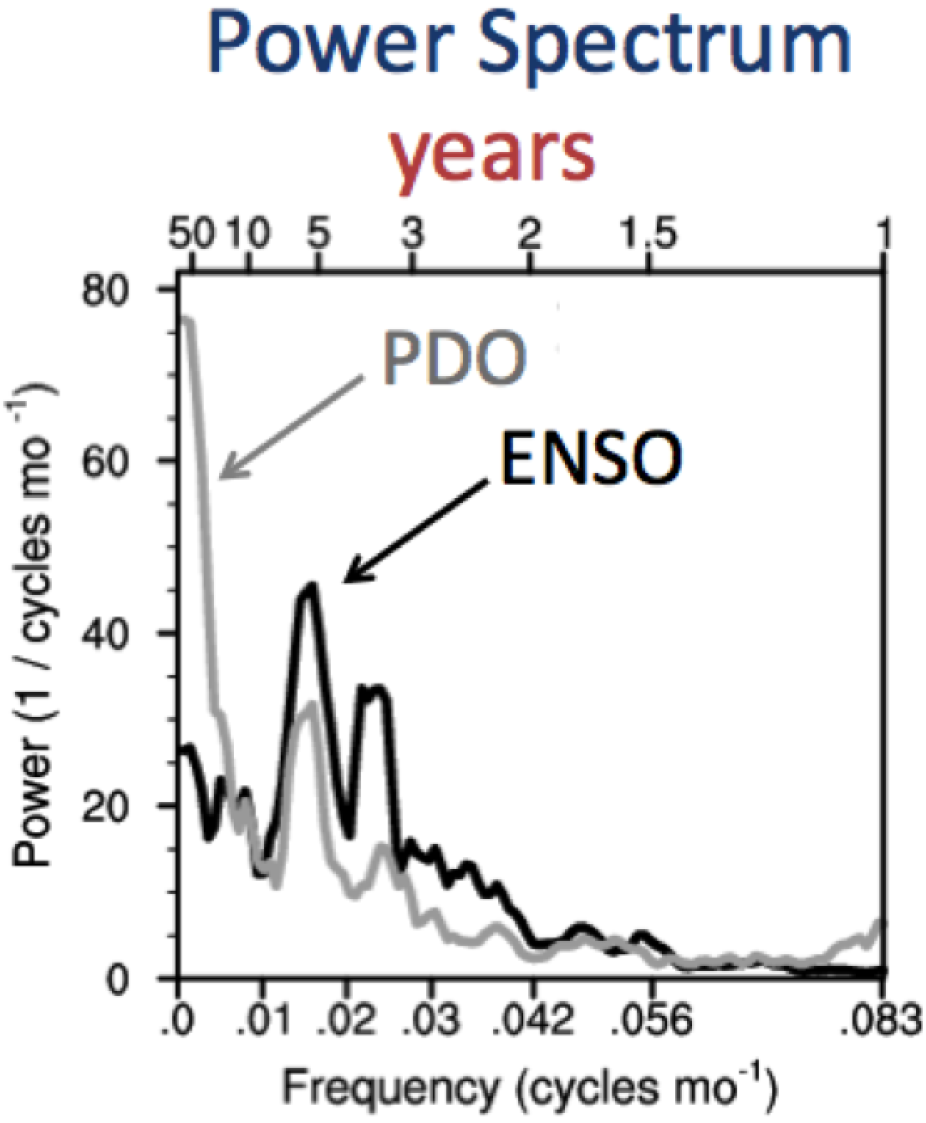
Figure 2. Power spectra of the normalized PDO and ENSO time series shown in Fig. 1. Adapted from Deser et al. (2012). (Contributed by C. Deser)