SST Data: NOAA Extended Reconstruction SSTs Version 5 (ERSSTv5)
Note: ERSST is currently on version 6. See the ERSSTv6 page here.
The NOAA Extended Reconstruction Sea Surface Temperature (ERSST) provides global, spatially complete SST data at a monthly timestep for 1854-present. Version5 is based upon statistical interpolation of the ICOADS release 3.0 data. Argo float data are used in the recent years (since ~2000). The data are distributed as anomalies; climatologies (absolute values) are available for 1971-2000. The creators of version 5 took some steps to alleviate the overly smooth and damped anomaly fields in ERSSTv4. ERSST forms the basis for NOAA's merged global land-ocean surface temperature analysis.
In ERSSTv5, corrections to reconcile different measurement types (ship engine room intakes, ship bucket, buoys) are based on comparisons of the binned but unadjusted SST data with an independent dataset of nightime marine air temepratures for data thru 2010. The ship-based data after 2010 are adjusted using buoy SSTs. This statistics-based approach is relatively broad-brush compared with the fine-grained, physics-based corrections employed in HadSST4 and its infilled derivative datasets (e.g. Cowtan & Way, Berkeley Earth).
Globally-averaged timeseries from the latest versions of the Hadley and ERSST datasets agree very well since 1980; before 1980 there are differences that may be important for some applications.
Key Strengths
Long record spanning 1854-present with global coverage
Greater weight to more reliable measurements (Argo and buoy data vs. ship data) in recent years, putting the record in good agreement with SST estimates based on satellite data or air temperatures at island & coastal weather stations
Less smoothing than in previous version; more variance resolved in features like Nino-region SST anomalies
Key Limitations
Potential biases and large uncertainties around the WW2 period and before 1900 (is relatively warm before 1900 compared with other SST datasets)
Large uncertainties in the Arctic and Southern Oceans
Relatively coarse adjustments (based on a statistical model) employed to reconcile different measurement types
To cite use of dataset: Boyin Huang, Peter W. Thorne, Viva F. Banzon, Tim Boyer, Gennady Chepurin, Jay H. Lawrimore, Matthew J. Menne, Thomas M. Smith, Russell S. Vose, and Huai-Min Zhang (2017): NOAA Extended Reconstructed Sea Surface Temperature (ERSST), Version 5. [indicate subset used]. NOAA National Centers for Environmental Information. doi:10.7289/V5T72FNM [access date].
Expert User Guidance
The following was contributed by Zeke Hausfather in Janurary 2019:
The US National Oceanic and Atmospheric Administration (NOAA) produces the Extended Reconstruction Sea Surface Temperature (ERSST) dataset. ERSST provides a monthly global spatially-complete sea surface temperature record as a 2°x2° gridded dataset from 1854 through present for both absolute temperatures and temperature anomalies, with anomalies calculated with respect to a 1971–2000 monthly climatology.
The latest version of the record – version 5 – incorporates ship and buoy observations from the ICOADS database (version 3.0), near-surface data from Argo floats, and an estimate of sea ice coverage from HadISST2. ERSSTv5 also features improved bias correction to ship observations, using more homogeneous buoy observations as a baseline. It also improves the spatial interpolation approaches used to estimate temperatures in data-sparse regions.
ERSSTv5 builds upon improvements made in ERSSTv4, which included the use of nighttime marine air temperatures in addition to ship metadata to detect and correct for biases associated with changes in measurement practice, corrections for the transition from ship-based to buoy-based measurements over the past few decades, and greater weight given to more reliable buoy-based measurements.
ERSSTv5 provides a temperature record quite similar to that of ERSSTv4, as shown in the second figure. There are a number of notable differences between ERSSTv5 and HadSST3, particularly around the World War 2 period (shaded in grey), where ERSSTv5 shows a much larger jump in temperatures. Recent papers have questioned the magnitude of this jump, and coastal and island land records support the HadSST3/COBE-SST2 corrections during the period over those of ERSST.
ERSSTv5 features more rapid warming over the past two decades than HadSST3, during the period when buoy-based measurements began to predominate over ship-based measurements. ERSSTv5’s reconstruction, which gives a greater weight to more homogenous buoy measurements in recent years, agrees better with buoy-only estimates, satellite-based estimates, island and coastal land-station estimates, and Argo-based estimates of sea surface temperatures in recent years.
ERSSTv5 will shortly provide an ensemble of realizations to encompass the spatial and structural uncertainty associated with the global sea surface temperature reconstruction, similar to the 1000-member ensemble currently provided by ERSSTv4. Gridded ERSSTv5 data is available in both ASCII and NetCDF formats.
KEY STRENGTHS:
- Global coverage at a 2° resolution
- Wide range of measurements used as inputs
- Ensemble of runs to capture uncertainty
- Greater weight to more reliable measurements in recent years
KEY LIMITATIONS:
- Potential biases and large uncertainties around the WW2 period
- Limited data and coverage prior to the 1880s
- Large uncertainties in the Arctic and Southern Oceans
##
Cite this page
Acknowledgement of any material taken from or knowledge gained from this page is appreciated:
Hausfather, Zeke & National Center for Atmospheric Research Staff (Eds). Last modified "The Climate Data Guide: SST Data: NOAA Extended Reconstruction SSTs Version 5 (ERSSTv5).” Retrieved from https://climatedataguide.ucar.edu/climate-data/sst-data-noaa-extended-reconstruction-ssts-version-5-ersstv5 on 2026-07-13.
Citation of datasets is separate and should be done according to the data providers' instructions. If known to us, data citation instructions are given in the Data Access section, above.
Acknowledgement of the Climate Data Guide project is also appreciated:
Schneider, D. P., C. Deser, J. Fasullo, and K. E. Trenberth, 2013: Climate Data Guide Spurs Discovery and Understanding. Eos Trans. AGU, 94, 121–122, https://doi.org/10.1002/2013eo130001
Key Figures

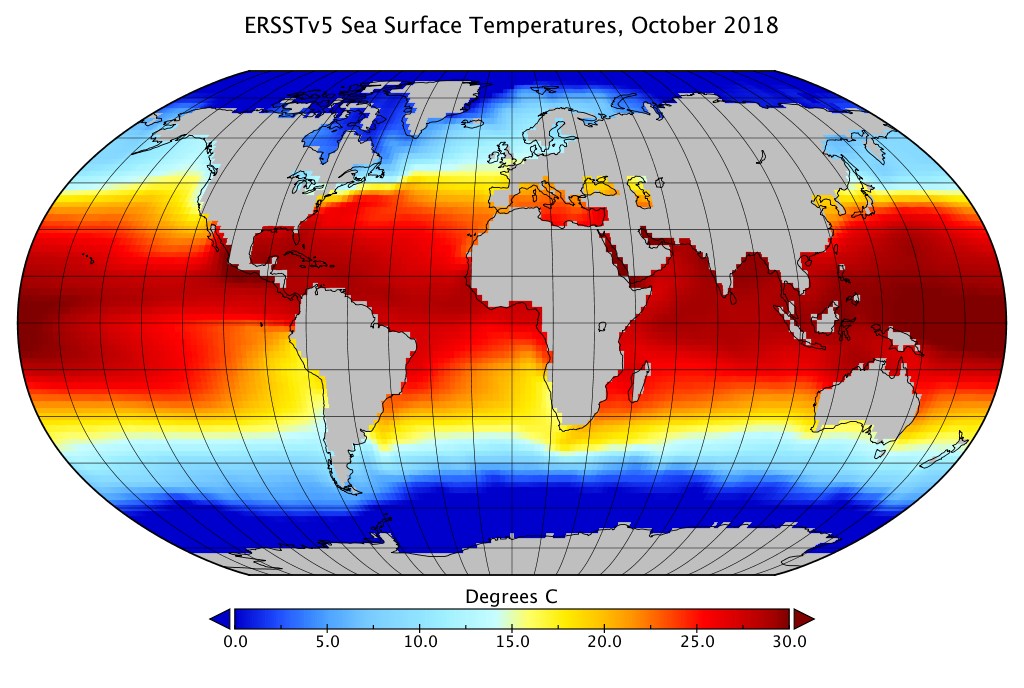
ERSSTv5 climatology for October 2018 (contributed by Z Hausfather)
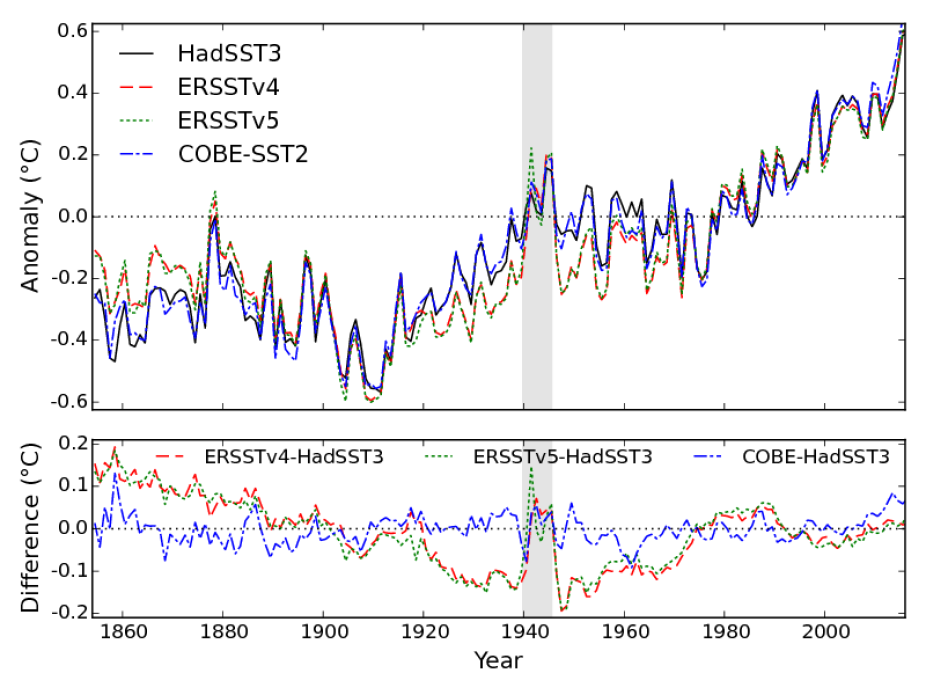
Comparison of annual anomalies for ERSSTv5 (green), ERSSTv4 (red), HadSST3 (black), and COBE-SST2 (blue) over the 1854-2016 period, using a common 1961-1990 baseline. Bottom: Differences for each series from HadSST3. Figure 1 from Cowtan et al 2018. (contributed by Z Hausfather)
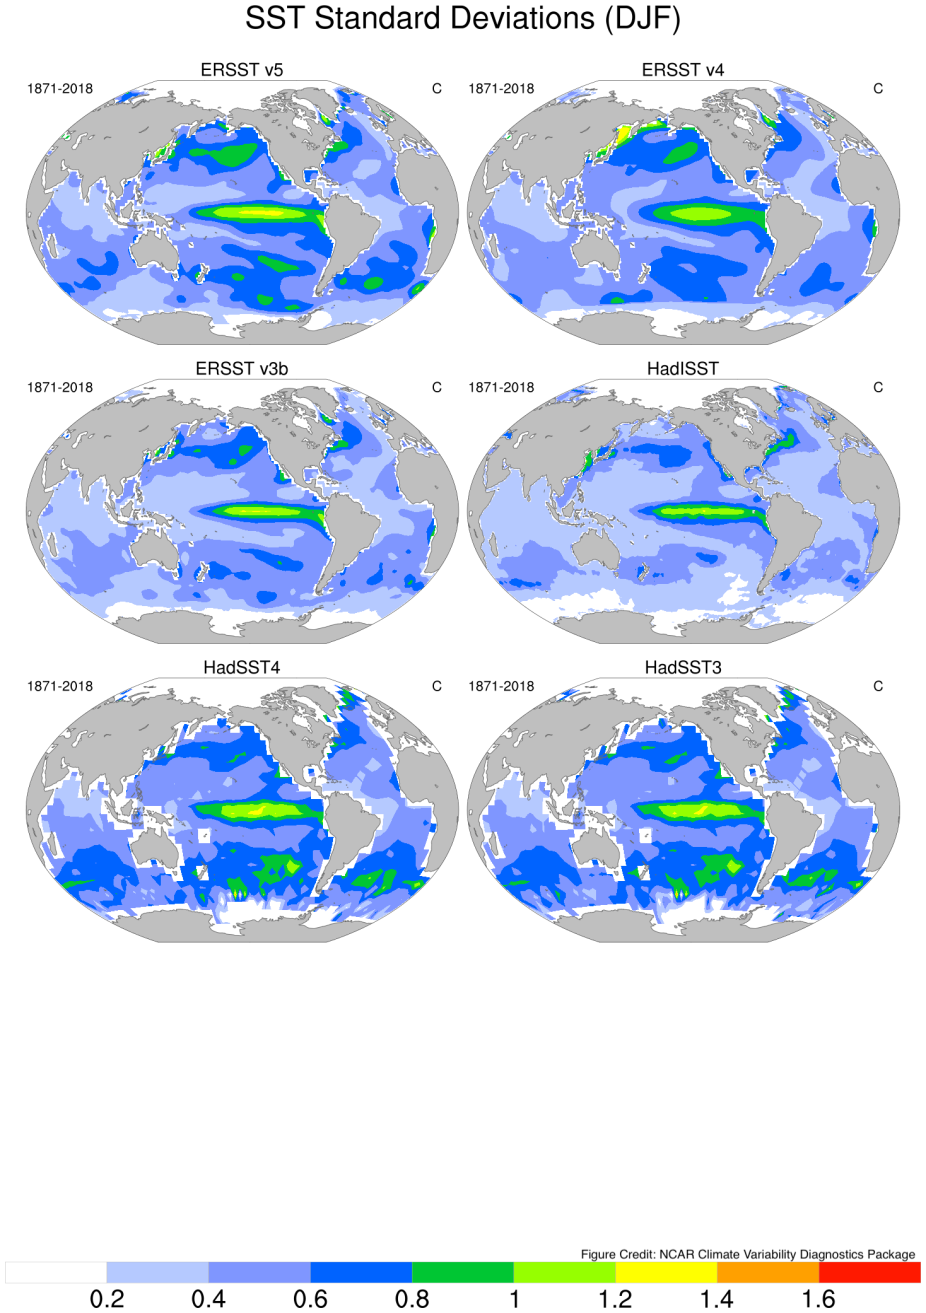
Standard deviation of SST in DJF in 6 different SST datasets over 1871-2018. Note the higher variance in ERSSTv5 compared with ERSSTv4, putting ERSSTv5 in better agreement with non-interpolated data like HadSST4.(contributed by A Phillips using NCAR Climate Variability Diagnostics Package)
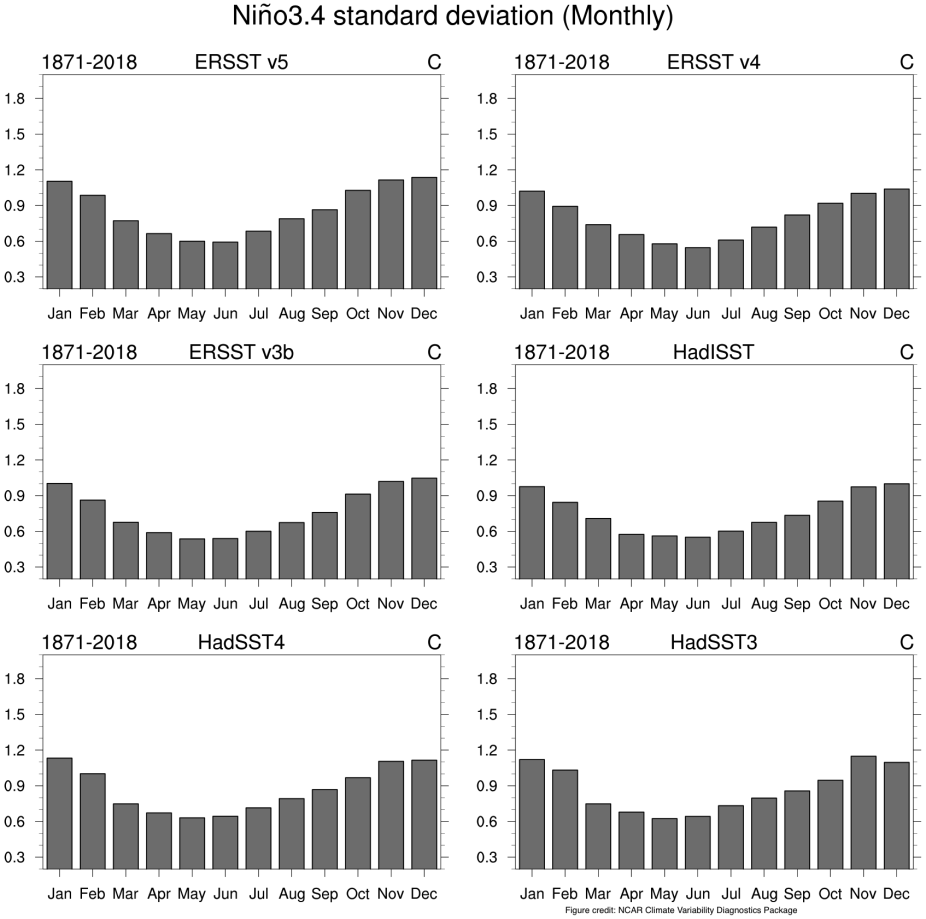
Monthly standard deviation of the Nino 3.4 index in 6 different SST datasets over 1871-2018. Note the higher variance in ERSSTv5 compared with ERSSTv4, putting ERSSTv5 in better agreement with non-interpolated data like HadSST4.(contributed by A Phillips using NCAR Climate Variability Diagnostics Package)
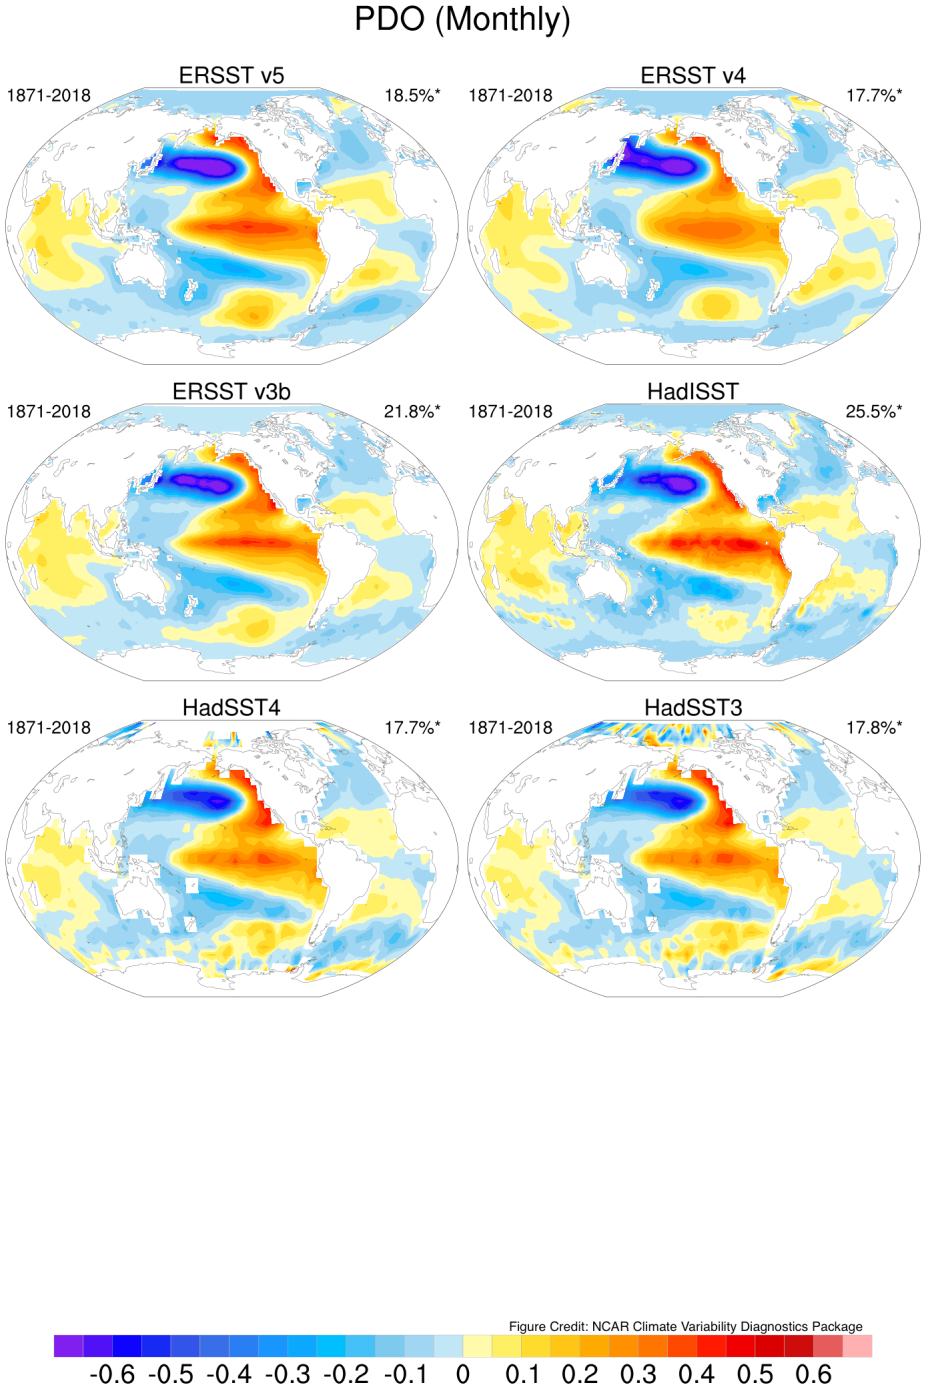
Spatial pattern of Pacific Decadal Oscillation (PDO) in six different SST datasets. Note the greater variance depicted in ERSSTv5 vs ERSSTv4. (contributed by A Phillips using NCAR Climate Variability Diagnostics Package)
Other Information
- Huang, B., Peter W. Thorne, et. al, 2017: Extended Reconstructed Sea Surface Temperature version 5 (ERSSTv5), Upgrades, validations, and intercomparisons. J. Climate, doi: 10.1175/JCLI-D-16-0836.1
- Huang, B., C. Liu, G. Ren, H.-M. Zhang, and L. Zhang, 2018: The role of buoy and Argo observations in two SST analyses in the global and tropical Pacific oceans. J. Climate, 32, 2517-2535, doi:10.1175/JCLI-D-18-0368.1.
- Huang, B., W. Angel, T. Boyer, L. Cheng, G. Chepurin, E. Freeman, C. Liu, and H.-M. Zhang, 2018: Evaluating SST analyses with independent ocean profile observations. J. Climate, 31, 5015-5030, doi:10.1175/JCLI-D-17-0824.1
- Cowtan, K, Rohde R, Hausfather Z. Evaluating biases in sea surface temperature records using coastal weather stations. Q J R Meteorol Soc. 2018; 144:670–681. doi:10.1002/qj.3235
- Hausfather, Z., K. Cowtan, D. C. Clarke, P. Jacobs, M. Richardson, and R. Rohde, 2017: Assessing recent warming using instrumentally homogeneous sea surface temperature records. Science Advances, 3, e1601207, doi:10.1126/sciadv.1601207.
- Kent, E. C., and Coauthors, 2017: A Call for New Approaches to Quantifying Biases in Observations of Sea Surface Temperature. Bulletin of the American Meteorological Society, 98, 1601–1616, doi:10.1175/bams-d-15-00251.1.