SST data: NOAA Extended Reconstruction SSTs, version 3 (ERSSTv3 & 3b)
Note: ERSST is currently on version 6. See the ERSSTv6 page here.
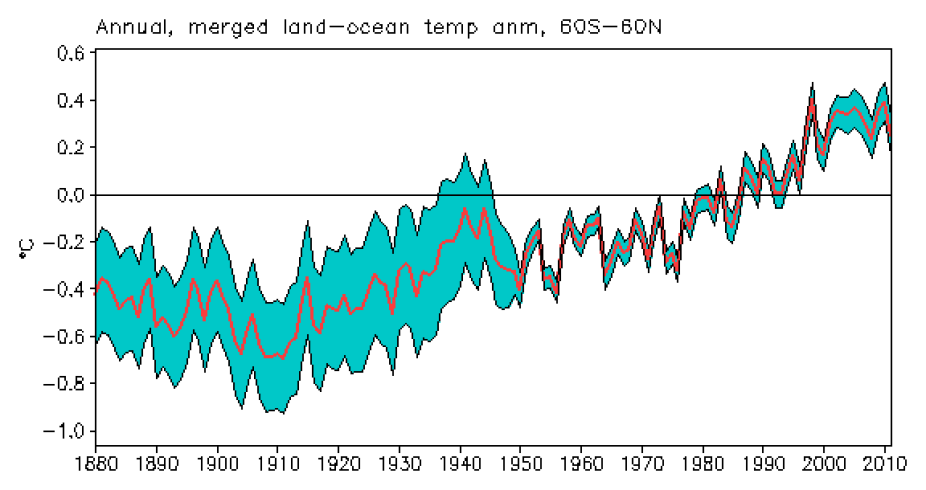
The NOAA Extended Reconstruction Sea Surface Temperature (ERSST) provides global, spatially complete SST data at a monthly timestep for 1854-present. Version3 is based upon statistical interpolation of the ICOADS release 2.4 data. Version 3 includes satellite AVHRR SST data for 1985 onwards. Version 3b does not include satellite data due to a cold bias in the satellite-derived SSTs that proved difficult to correct. The data are distributed as anomalies; climatologies (absolute values) are available for 1971-2000. ERSST v3 forms the basis for NOAA's merged global land-ocean surface temperature analysis.
Version 4 was released in October, 2014. Version 4 makes use of ICOADS release 2.5. and employs new bias adjustments, quality control procedures, and analysis methods (Huang et al., 2014). Version 5 is available as of July, 2017. Both ERSSTv4 and ERSSTv5 show more warming since ~1980 than does ERSSTv3b, putting them in better agreement with SST estimates from satellites, buoys, and island and coastal land station estimates.
Key Strengths
Long record spanning 1854 to present
Global coverage; completely infilled
Uncertainty estimates provided
Key Limitations
Large uncertainties in the Arctic and Southern oceans
Low spatial and temporal resolutions; some features are highly smoothed or damped
Cold bias in recent decades
Expert Developer Guidance
The following was contributed jointly by Boyin Huang, Tom Smith and Jay Livermore of NOAA National Climatic Data Center, August, 2013:
1. Data Description
The most recent version of the Extended Reconstruction of Sea Surface Temperature (ERSST) analysis is v3b (ERSST.v3b). The analysis is based on the International Comprehensive Ocean-Atmosphere Data Set (ICOADS) Release 2.4. At the end of every month, the ERSST analysis is updated with the available GTS ship and buoy data for that month. The anomalies are computed with respect to a 1971-2000 climatology.
The monthly analysis extends from January 1854 to the present, but because of sparse data in the early years, the analyzed signal is damped before 1880. After 1880, the strength of the signal is more consistent over time. ERSST is suitable for long-term global and basin wide studies; local and short-term variations have been smoothed in ERSST. The spatial resolution is 2° in latitude and longitude, and temporal resolution is monthly.
2. Key strengths
Long historic analysis from January 1854 to present
Global coverage
Regular gridded data without missing values on ocean grids
Provides uncertainty at global and hemispheric scales
Updated on the 3rd day of every month for the data of previous month
3. Key limitations
Low spatial resolution of 2°×2° and low temporal resolution of monthly
Large uncertainty in the Arctic Ocean and the Antarctic circumpolar oceans
No uncertainty estimation at 2° grid scale.
6. ERSST construction
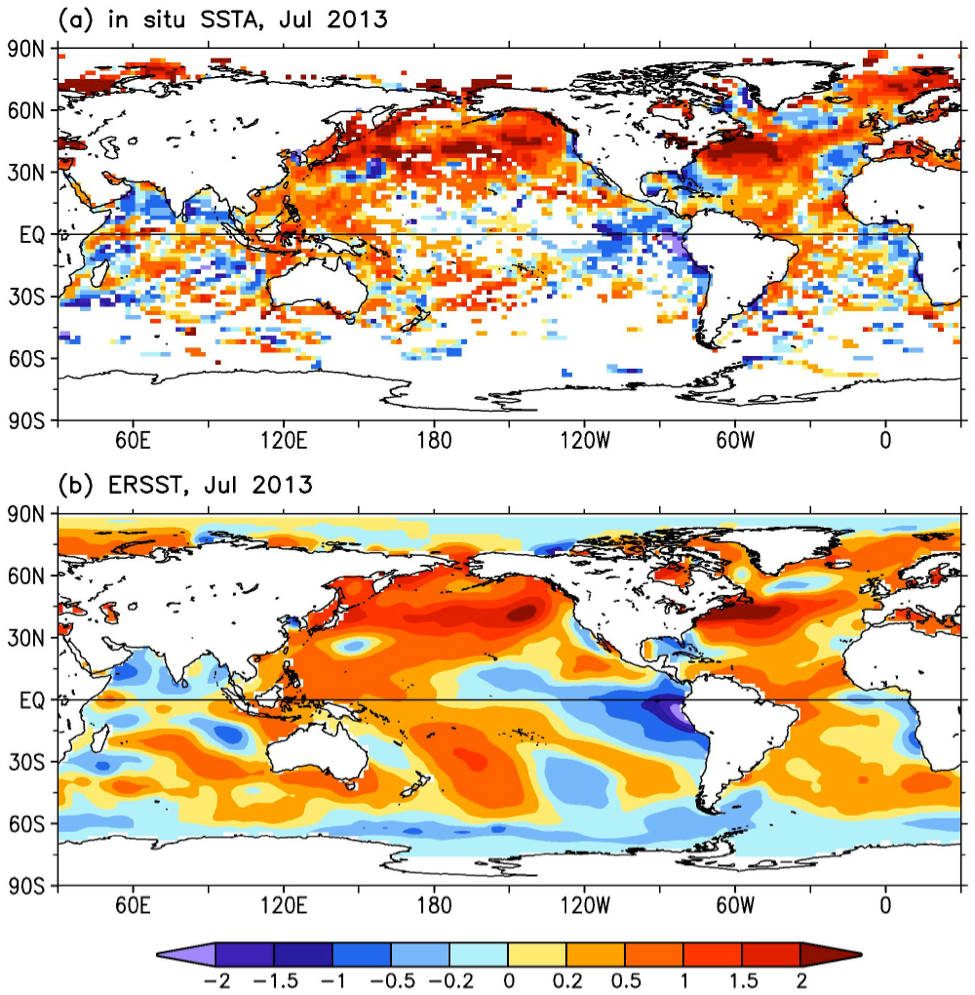
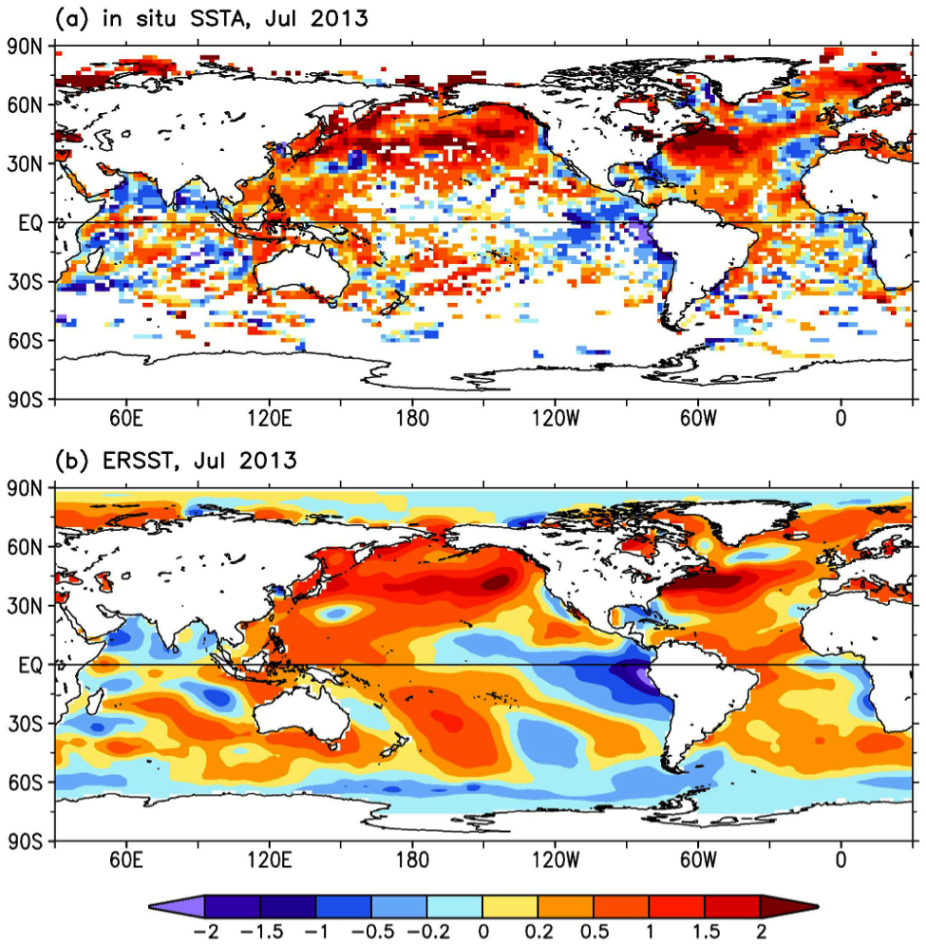
The SSTs from in situ buoy and ship observations are used to reconstruct monthly SSTA in ERSST from 1854 to present. Buoy and ship observations between 1854 and 2007 are taken from ICOADS R2.4. The SST data from 2007 to present are collected from Global Telecommunications System (GTS) transmissions. The SSTs from ship or buoy are rejected under a quality control (QC) criterion that observed SSTs differ from climatology by more than 4 times STD of SST. Satellite observations are excluded due to difficulties in satellite SST bias adjustment. For example, in situ SST observations over the Southern Hemisphere oceans are too sparse to support necessary adjustments of the satellite observations.
The ship and buoy SSTs passing QC are first converted into monthly SSTAs by subtracting the 1971-2000 2°×2° SST climatology. The ship SSTA are adjusted to remove inhomogeneities associated with changing observing practices through time based on night marine air temperature (NMAT). For example, SSTs are observed by un-insulated wood buckets, canvas buckets in the earlier time, and by insulated buckets, engine room intake, hull sensor, and buoys in the modern time. Therefore, observed in situ SSTs need to be adjusted to eliminate potential biases. In ERSST, the SST bias is estimated based on the difference between observed SSTs and collocated NMATs that were believed to be less biased or easily adjusted since the instruments observing the NMATs did not change much in the past.
The ship and buoy SSTAs are merged and bin-averaged into superobservations on 2°×2° grids. The merging of ship and buoy SSTAs is based on their proportions of the total number of observations. During the merging process, the number of buoy observations is weighted by a factor of 6.8 because of the higher reliability of buoy observations. The SSTA of super observations is further decomposed into low and high frequency components. The low frequency component of SSTA is constructed by applying a 26°×26° spatial running mean using monthly superobservations where the sampling ratio is larger than 3% (5 superobservations). The annual mean SSTA is then defined with a minimum of two months of valid data. The annually averaged SSTA is first filtered with a 3-point binomial average in both longitudinal and latitudinal directions, and then filtered with a 15-yr median filter. Finally, the SSTA is damped towards zero in high latitudes north of 80°N and south of 50°S. These processes are designed to filter out high frequency noise in time and space.
The high frequency component of SSTA, defined as the difference between original and low frequency SSTAs, is reconstructed by first applying a 3-month running filter that replaces invalid data with an average of pre- and post- month valid data. The filtered SSTA is then fitted to as many as 130 Empirical Orthogonal Teleconnections (EOTs) based on monthly SST from 1982 to 2005. The spatial patterns of EOTs look to be similar to those of EOF modes, but EOTs are damped across a scale of 5000 km in zonal and 3000 km in meridional directions. An EOT mode is accepted only if the ratio between its projection onto the grids containing superobservations and its projection onto all grids is great than 0.2. The EOT weighting coefficients are calculated by solving linear equations using LU decomposition method; and the invalid coefficients are filtered out by an average of pre- and post- month valid coefficients weighted with a lag-1 auto-correlation coefficient of EOT weighting coefficients. The high frequency SSTA is finally calculated by summing the accepted EOTs with fitted weighting coefficients. The SST data constructed from low and high frequency components are finally adjusted towards the freezing point of -1.8°C over the regions where the sea ice concentration is greater than 60%.
The uncertainty (E) of averaged SSTA is associated with low frequency (LF) and high frequency (HF) variance and bias adjustment:
E = Elf + Ehf + Eb
The LF variance is estimated using coupled model simulation sampled where historic observations were available. The HF variance is defined as the difference of two variances: one is the SST variance from 1980 to 2000, the other is the variance of 15 yr (7yr before and after current year) detrended SST. The variance of bias adjustment is defined as the difference of bias adjustments from NCDC and UK Met Office.
6. User guide
SST data in both NetCDF and ASCII formats can be downloaded from the ERSST web site in ASCII and NetCDF formats. A Readme file is provided and sample FORTRAN code is included for users to read the ASCII formatted data. In addition, a file (readme.status.changes) is provided on the ERSST web site. This file provides updated information on the latest ERSST data and changes. It is recommended that users read these files before using the data sets. Users can register when they download data to ensure they are kept informed on future ERSST changes and developments. ##
Cite this page
Acknowledgement of any material taken from or knowledge gained from this page is appreciated:
Huang, Boyin &, Livermore, Jay &, Smith, Tom & National Center for Atmospheric Research Staff (Eds). Last modified "The Climate Data Guide: SST data: NOAA Extended Reconstruction SSTs, version 3 (ERSSTv3 & 3b).” Retrieved from https://climatedataguide.ucar.edu/climate-data/sst-data-noaa-extended-reconstruction-ssts-version-3-ersstv3-3b on 2026-07-14.
Citation of datasets is separate and should be done according to the data providers' instructions. If known to us, data citation instructions are given in the Data Access section, above.
Acknowledgement of the Climate Data Guide project is also appreciated:
Schneider, D. P., C. Deser, J. Fasullo, and K. E. Trenberth, 2013: Climate Data Guide Spurs Discovery and Understanding. Eos Trans. AGU, 94, 121–122, https://doi.org/10.1002/2013eo130001
Key Figures


Other Information
- Smith, T.M., and R.W. Reynolds, 2003: Extended Reconstruction of Global Sea Surface Temperatures Based on COADS Data (1854-1997). Journal of Climate, 16, 1495-1510.
- Smith, T.M., and R.W. Reynolds, 2004: Improved Extended Reconstruction of SST (1854-1997). Journal of Climate, 17, 2466-2477.
- Smith, Thomas M., Richard W. Reynolds, Thomas C. Peterson, Jay Lawrimore, 2008: Improvements to NOAA’s Historical Merged Land–Ocean Surface Temperature Analysis (1880–2006). J. Climate, 21, 2283–2296.
- Huang, B. and Coauthors, 2014: Extended Reconstructed Sea Surface Temperature version 4 (ERSST.v4), Part I. Upgrades and Intercomparisons, J. Climate.
- Hausfather, Z., K. Cowtan, D. C. Clarke, P. Jacobs, M. Richardson, and R. Rohde, 2017: Assessing recent warming using instrumentally homogeneous sea surface temperature records. Science Advances, 3, e1601207, doi:10.1126/sciadv.1601207.