SST data: HadSST4
HadSST4 provides monthly SST anomalies on a 5°x5° grid for 1850-present. The anomalies are derived from a 30-year climatology spanning 1961-90. Coverage is global but there is no interpolation; Thus, missing data occur in the final product. This means that uncertainties due to limited spatial coverage and systematic errors are relatively easy to identify compared with interpolated SST products; it also minimizes the loss of variance in SST anomalies that occurs in interpolated products. The primary input data to HadSST4 are from ICOADS release 3.0 prior to 2021, after which ship data are sourced from the Met Office GTS collection, and buoy data from iQuam (until mid-2025) and CMEMS. Bias adjustments to the ICOADS SSTs account for changes in measurement methods (e.g. engine room intake, bucket measurements, or buoy data). These adjustments are carried forward to the present. Uncertainties in these adjustments have complex spatial and temporal dependencies. The uncertainties are represented in an ensemble of 200 realizations of the data set. This allows the spatial and temporal characteristics of the uncertainties and their effects on climate signals to be explored. In addition to the ensemble, a median estimate is provided. Additional uncertainty arises from local measurement errors and local sampling errors; these errors are represented as gridded fields. Correlated measurement errors are represented in error-covariance matrices. Unadjusted raw data are provided but their use for climate studies is discouraged.
Derivative products: HadSST4 is used in the HadCRUT5 global combined land-ocean surface temperature data set. It has also been used in the Cowtan & Way global combined land-ocean surface temperature data set and will likely also be used in a forthcoming version of the Berkeley Earth global land-ocean data set.
Key Strengths
Long record, extending back to 1850 and up to present with regular updates
Quantification of systematic uncertainties (due to measurement methods) in space and time presented as a 200-member ensemble; bias adjustments extend up to the present. For ~2000 to present, HadSST4 in good agreement with trends in ERSSTv4/v5 and data from satellites, buoys, and floats
No interpolation so anomalies in a grid cell can be traced to original observations. Also, no loss of variance that often arises from statistical reconstruction and interpolation methods.
Key Limitations
Coarse resolution; features like western boundary currents and eddies not resolved
Substantial coverage gaps exist, especially early in the record
Uncertainty estimates can be difficult to use
Kennedy, J. J., Rayner, N. A., Atkinson, C. P., & Killick, R. E. ( 2019). An ensemble data set of sea‐surface temperature change from 1850: the Met Office Hadley Centre HadSST.4.0.0.0 data set. Journal of Geophysical Research: Atmospheres, 124. https://doi.org/10.1029/2018JD029867
Sandford, C., and N. Rayner, 2026: Addressing the World War 2 Warm Anomaly in HadSST.4.2.0.0. International Journal of Climatology. https://doi.org/10.1002/joc.70388.
Expert Developer Guidance
The following was contributed by Dr. John Kennedy, in September, 2019 and Dr. Caroline Sandford in May 2026:
Summary
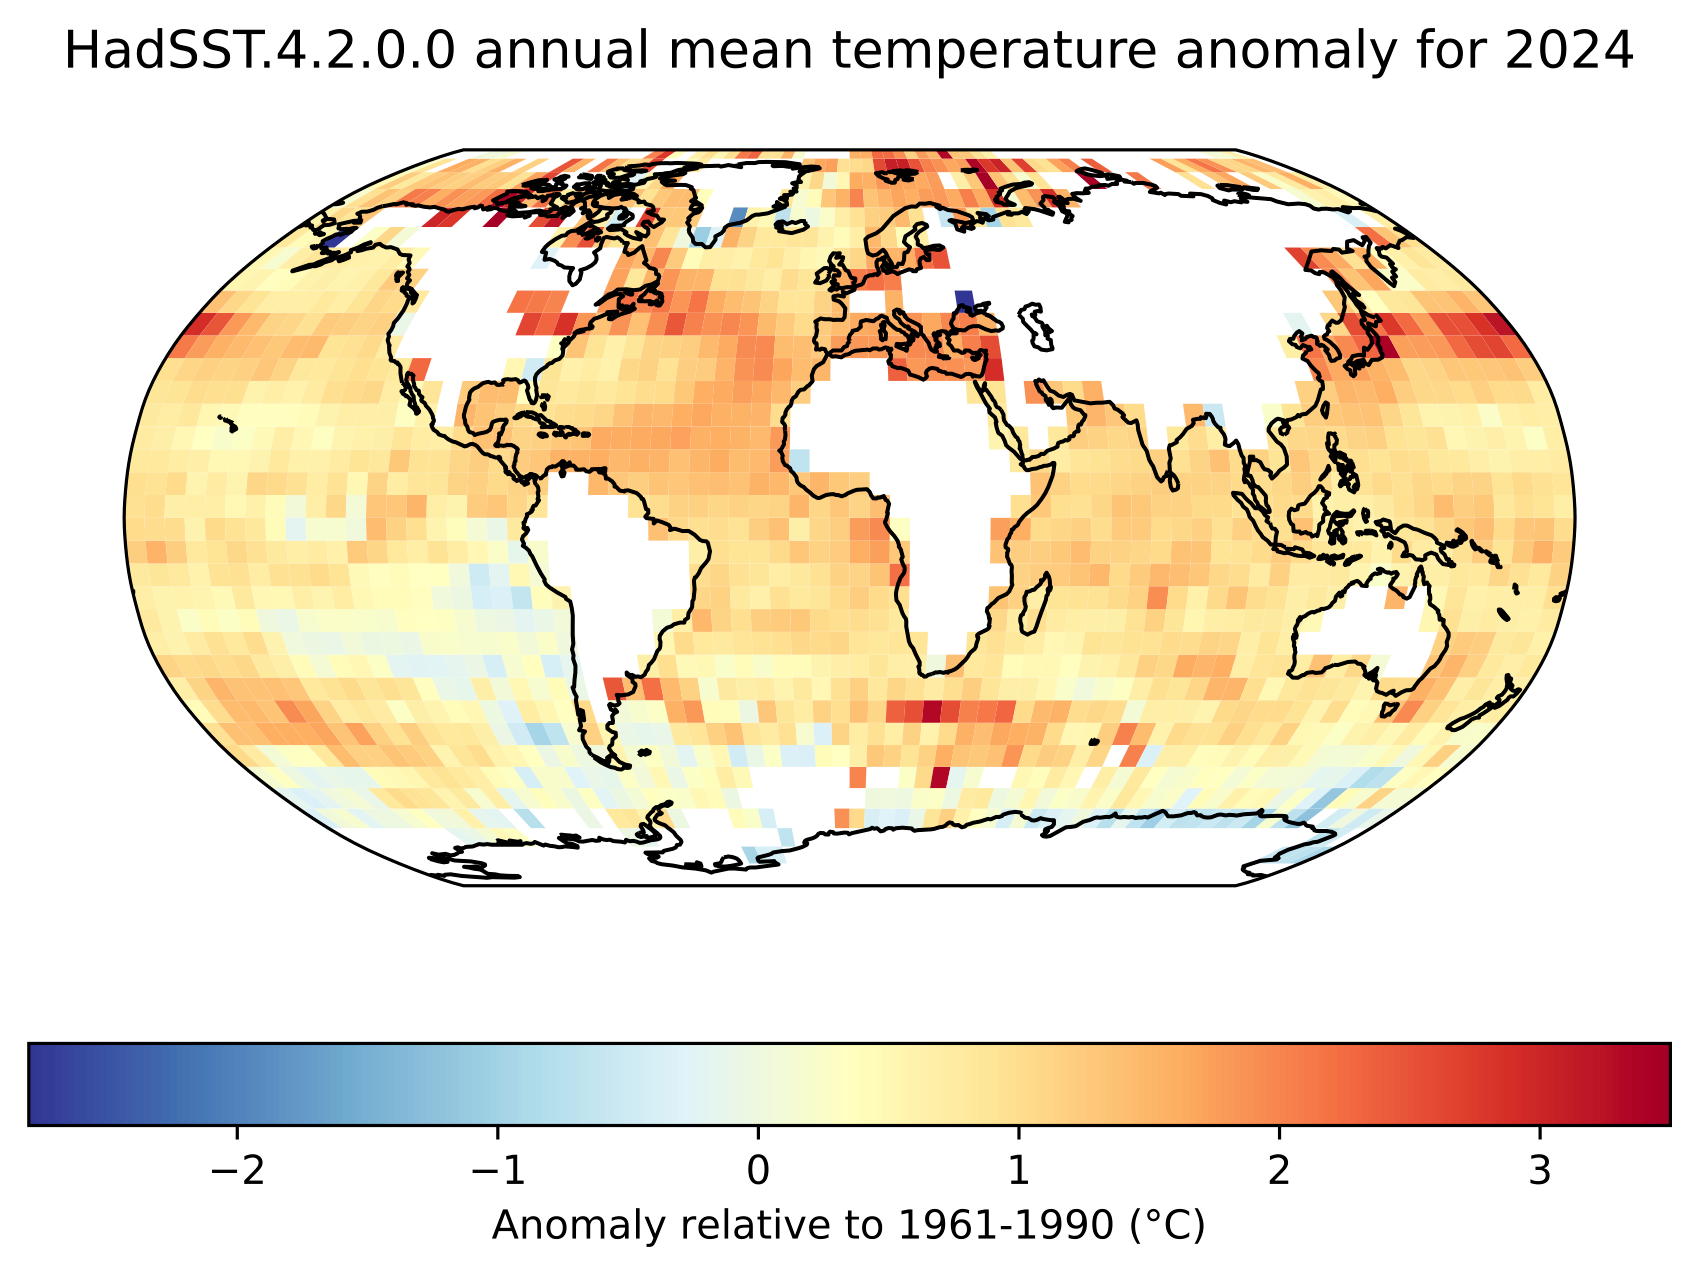
HadSST.4.2.0.0 (the Hadley Centre Sea-Surface Temperature data set version 4, Kennedy et al. 2019; Sandford and Rayner, 2026) is a gridded data set of sea-surface temperature anomalies (that is, temperature difference from the 1961-1990 average) from January 1850 to present. The monthly grids have a resolution of 5° latitude by 5° longitude.
The HadSST.4.2.0.0 record prior to 2021 is based on quality-controlled in situ measurements of sea-surface temperature from the International Comprehensive Ocean Atmosphere Data Set (ICOADS) release 3 (3.0.0 to 2014, 3.0.1 from 2015 to 2021). Since 2021 it has been updated using ship data from the Met Office GTS collection, moored buoy data from iQuam (the NOAA In situ Quality Monitor, 2022-2025), and moored and drifting buoy data provided by the Copernicus Marine Environmental Monitoring Service.
In situ measurements are those made at the surface by ships, drifting buoys and moored buoys. Ship measurements are made using a variety of methods and adjustments have been applied to the data to minimise the impact of artificial variability caused by changes in instrumentation. Uncertainties associated with bias adjustments, measurement errors and sampling error have been estimated and are provided with the data. Grid-box SST anomalies are only estimated in those grid boxes that contain observations. Consequently, the data set is not globally complete.
What are the key strengths of this data set?
- The data set starts in 1850 and is therefore relatively long compared to most instrumental data sets.
- It is based on the latest release of the International Comprehensive Ocean Atmosphere Data Set, ICOADS release 3.0.0.
- SSTs are only estimated for a grid box when there are observations in that grid box. Therefore, every data point is based directly on observed values and uncertainties are easier to quantify.
- The grid-box average is estimated using simple resistant statistics that are less sensitive to outliers in the input data.
- Adjustments have been applied to the data set from 1850 to present to minimise the effect of changes in measurement method. Residual errors in the adjustments are included in the uncertainty estimation.
- Detailed uncertainty information is included and a product user guide describes how to use them along with example processing code in Python.
- Uncertainties associated with the bias adjustments are presented as an ensemble of 200 data sets which are presented in a set of NetCDF files in a consistent format.
What are the key limitations of this data set?
- The resolution of the data sets is limited. Monthly fields are presented on a monthly 5° latitude by 5° longitude grid.
- There are gaps in the data, particularly: early in the record; at high latitude; and during the two world wars. In general, coverage of the northern hemisphere is better than that in the southern hemisphere.
- No smoothing or interpolation is applied beyond aggregating observations onto a regular grid. Consequently, the data are noisier than more heavily processed data sets. However, the uncertainty estimates can be used to understand the relative reliability of the grid box values.
- The uncertainties associated with systematic errors from individual ships lead to large scale correlations in the errors. This uncertainty component is likely under-estimated because many observations lack appropriate metadata (ship callsigns).
- There are limitations to the uncertainty analysis. Therefore, it is best to use HadSST4 in combination with at least one other long term analysis such as ERSSTv5 or COBE-SST-2 to assess the structural uncertainty.
- Some users find the ensemble of 200 data sets unwieldy. Therefore a ‘median’ estimate is also provided.
What are the typical research applications of this data set?
HadSST4 is intended for use in studies looking at long-term changes in sea-surface temperature, or where detailed uncertainty information is required such as:
- Climate monitoring
- Detection and attribution
- As an input for globally infilled datasets.
What are the most common mistakes that users encounter when processing or interpreting these data?
- A common mistake is not to use all the uncertainty information provided. A product user guide shows how to process and combine the different uncertainty components to get an estimate of the total uncertainty.
- Because there are gaps in the data, where historically there were no observations, area-averages calculated from the data can suffer from coverage biases. When comparing data sets or comparing HadSST4 to model data, it is a good idea to ensure that all data sets are reduced to their common coverage.
What are some comparable data sets, if any?
There are many SST data sets that cover the satellite period from 1980 to the present. Data sets that are of comparable length to HadSST4 are:
- ERSST NOAA Extended Reconstruction SST version 6, 1850-present (Huang et al. 2025a,b)
- COBE-SST-3 Centennial Observation Based Estimates of Sea Surface Temperature, 1870-2014 (Ishii et al 2025)
- HadISST1, 1870-present (Rayner et al 2003).
- ICOADS summaries (Freeman et al. 2017), though note that these are not bias adjusted.
How is uncertainty characterized in these data?
Uncertainty arising from three sources has been quantified: sampling error, measurement error and residual data biases.
- Uncertainties associated with sampling and uncorrelated measurement errors are provided as simple gridded fields of uncertainty, in a consistent format to the SST anomaly fields.
- Uncertainties associated with correlated measurement errors are provided as error-covariances, one per month, which can be used to propagate the uncertainties appropriately.
- Residual data bias errors are expressed using a 200-member ensemble. Each ensemble member has a different set of bias adjustments applied to it. Together these provide information about the uncertainty in the adjustments.
Were corrections made to account for changes in observing systems or practices, sampling density, satellite drift, or similar issues?
Yes. Corrections were made to reduce the effect of instrumentation changes during the historical period, which are described in Kennedy et al. (2019) and Sandford and Rayner (2026). The update from 4.0 to 4.2 in particular provides improved corretions of known biases during the WWII period in the early 1940s (Sandford and Rayner 2026).
How useful are these data for characterizing means as well as extremes?
The data are based on point observations aggregated onto a monthly 5° latitude by 5° longitude grid. They can be used to assess changes in monthly mean sea-surface temperature. No information about specific extreme values is included in the data set.
How do I best compare these data with model output?
It depends on what you are doing. There are two main things to bear in mind.
First, there are gaps in the data and the gaps are not randomly-distributed in time. Early in the record and during the two World Wars, the coverage is very sparse. Some analyses have accounted for this by masking the model output to have a similar coverage to that of the observations.
Second, there are uncertainties in the data. The data set has been presented as an ensemble of 200 data sets that characterise the uncertainties in the bias adjustments and, used together with separate fields of uncertainties associated with other measurement and sampling errors, these provide information about the estimated total uncertainty in the gridded fields.
The idea behind providing an ensemble was that it would be relatively easy to assess the sensitivity of an analysis to observational uncertainty by re-running the analysis on some, or all, of the observational ensemble. We very much welcome feedback from users on this general approach of using ensembles of observational data sets.
Are there spurious (non-climatic) features in the temporal record?
Probably. Although every effort has been made to minimise the effects of known changes in measurement methods, information concerning how measurements were made is limited. An attempt to quantify the uncertainty has made, but the period between 1935 and 1970 is particularly problematic as there were large, but poorly-documented changes in the way that measurements were made as well as discontinuities in the data sources used to form the ICOADS data base. It is recommended that users test their analyses using a range of long-term SST data sets in order to get a broader understanding of the uncertainties.
How do I access these data?
Data are available from https://www.metoffice.gov.uk/hadobs/hadsst4/data/download.html
How frequently are the data updated?
The HadSST4 dataset is updated monthly with typically a two week lag. The final month in each update is a preliminary estimate, which is refined with more recent observations in the following month. For example, an update in mid-April 2026 includes a preliminary monthly SST field for March 2026, which is finalised in the May 2026 monthly update.
References
Chan, D., Gebbie, G., Huybers, P. et al. 2024: A Dynamically Consistent ENsemble of Temperature at the Earth surface since 1850 from the DCENT dataset. Sci Data 11, 953. https://doi.org/10.1038/s41597-024-03742-x
Freeman, E., Woodruff, S.D., Worley, S.J., Lubker, S.J., Kent, E.C., Angel, W.E., Berry, D.I., Brohan, P., Eastman, R., Gates, L., Gloeden, W., Ji, Z., Lawrimore, J., Rayner, N.A., Rosenhagen, G. and Smith, S.R., 2017: ICOADS Release 3.0: a major update to the historical marine climate record. Int. J. Climatol., 37, 2211-2232. https://doi.org/10.1002/joc.4775
Huang, B., X. Yin, T. Boyer, C. Liu, M. Menne, Y. D. Rao, T. Smith, R. Vose, and H-M Zhang, 2025a: Extended Reconstructed Sea Surface Temperature, Version 6 (ERSSTv6). Part I: An Artificial Neural Network Approach. J. Climate, 38, 1105-1121. https://doi.org/10.1175/JCLI-D-23-0707.1
Huang, B., X. Yin, T. Boyer, C. Liu, M. Menne, Y. D. Rao, T. Smith, R. Vose, and H-M Zhang, 2025b: Extended Reconstructed Sea Surface Temperature, Version 6 (ERSSTv6). Part II: Upgrades on Quality Control and Large-Scale Filter. J. Climate, 38, 1123–1136. https://doi.org/10.1175/JCLI-D-24-0185.1
Ishii, M., A. Nishimura, S. Yasui, and S. Hirahara, 2025: Historical High-Resolution Daily SST Analysis (COBE-SST3) with Consistency to Monthly Land Surface Air Temperature. Journal of the Meteorological Society of Japan. Ser. II, 103 (1), 17-44. https://doi.org/10.2151/jmsj.2025-002
Kennedy, J. J., N. A. Rayner, C. P. Atkinson, and R. E. Killick, 2019: An Ensemble Data Set of Sea Surface Temperature Change From 1850: The Met Office Hadley Centre HadSST.4.0.0.0 Data Set. Journal of Geophysical Research: Atmospheres, 124, 7719-7763. https://doi.org/10.1029/2018JD029867
Rayner, N. A., D. E. Parker, E. B. Horton, C. K. Folland, L. V. Alexander, D. P. Rowell, E. C. Kent, and A. Kaplan, 2003: Global analyses of sea surface temperature, sea ice, and night marine air temperature since the late nineteenth century. Journal of Geophysical Research: Atmospheres, 108, 4407. https://doi.org/10.1029/2002JD002670
Sandford, C., and N. Rayner, 2026: Addressing the World War 2 Warm Anomaly in HadSST.4.2.0.0. International Journal of Climatology. https://doi.org/10.1002/joc.70388
Cite this page
Acknowledgement of any material taken from or knowledge gained from this page is appreciated:
Kennedy, John &, Sandford, Caroline & National Center for Atmospheric Research Staff (Eds). Last modified "The Climate Data Guide: SST data: HadSST4.” Retrieved from https://climatedataguide.ucar.edu/climate-data/sst-data-hadsst4 on 2026-07-16.
Citation of datasets is separate and should be done according to the data providers' instructions. If known to us, data citation instructions are given in the Data Access section, above.
Acknowledgement of the Climate Data Guide project is also appreciated:
Schneider, D. P., C. Deser, J. Fasullo, and K. E. Trenberth, 2013: Climate Data Guide Spurs Discovery and Understanding. Eos Trans. AGU, 94, 121–122, https://doi.org/10.1002/2013eo130001
Key Figures

Figure 2: 30-year mean sea-surface temperature anomalies (°C) from HadSST.4.2.0.0 (the most recent period is 26 years). Means are only calculated for grid points where at least 20% of contributing months contain valid data.

Figure 3: Global annual mean SST anomalies (°C) since 1850 from four up-to-date long term climate datasets (DCSST, COBE-SST3, ERSSTv6 and HadSST.4.2.0.0) and the previous version of HadSST4, for comparison. Datasets have been matched to their shared spatial coverage before averaging. Reproduced from Sandford and Rayner (2026).
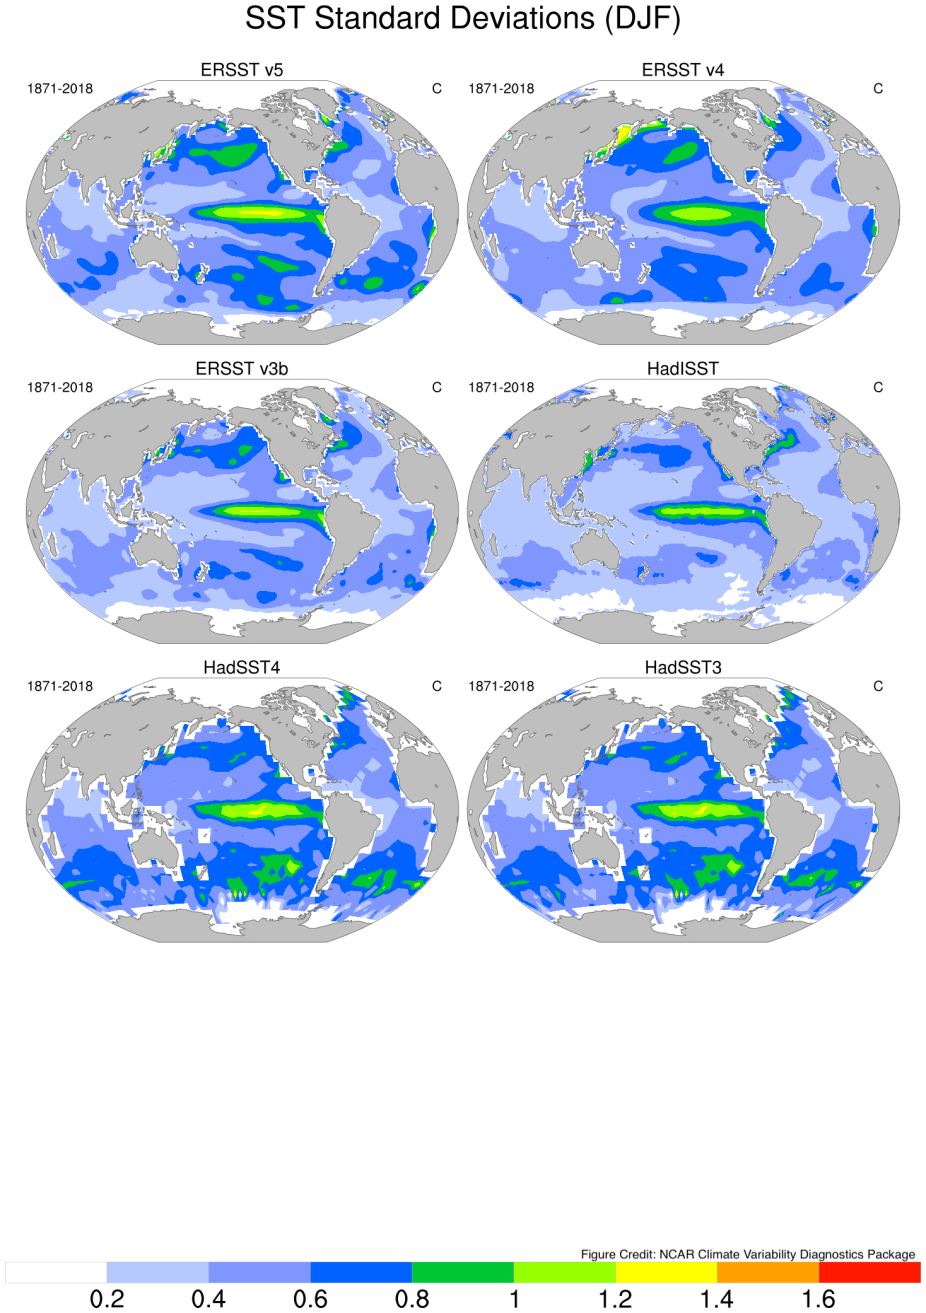
intyerannual standard deviation of SST in DJF in 6 different SST datasets; HadSST4 is on the lower left(created with NCAR Climate Variability Diagnostics Package)