CMAP: CPC Merged Analysis of Precipitation
CMAP refers to a collection of precipitation data sets, though the 2.5°x2.5° global monthly version is probably the most widely used. This data set is constructed from an analysis of gauge data and satellite-derived precipitation estimates. An "enhanced" version (CMAP/A) is also available, which provides global coverage by filling in gaps with precipitation forecasts from the NCEP/NCAR reanalysis. The overlapping satellite- and/or reanalysis- based estimates are weighted according to their fit with the gauge-based analysis, which is assumed to have the most accurate values. Thus, the quality of the analysis is strongly dependent on the amount of gauge data available as well as the accuracy of the satellite estimates. In general, the quality is best in the tropics and weakens towards the polar regions.
Key Strengths
Global, nearly spatially complete coverage
Long period of record
Key Limitations
Quality of the analysis is highly dependent on the amount and type of input data, which vary in space and time
Generally, greater uncertainty with increasing latitude; poorest quality in polar regions
Expert Developer Guidance
The following was contributed by Phil Arkin and Pingping Xie, November, 2013:
Datasets that represent the space/time variation of precipitation over the globe, including land and ocean, are essential for understanding the characteristics of global precipitation variability and for validating climate model simulations and projections. While many methods exist for observing precipitation at a location and for estimating it over larger areas, none of them produces complete global fields for extended time periods. Combining different observations and estimates to construct time series of global gridded fields of time-averaged precipitation for the globe has been possible since 1979, when consistent global coverage of satellite observations began. While a reasonably stable set of rain gauge observations has been available throughout the period, satellite-derived estimates of precipitation have changed significantly during that time. A global dataset derived from the available products must cope with these changes in the satellite observing system over time. Two datasets have been constructed with this goal: CMAP and GPCP (Global Precipitation Climatology Project). Both CMAP and GPCP constitute a suite of products with different spatial and/or temporal resolutions, but the monthly 2.5°x2.5° products are the most widely used.
The CMAP products include time series of monthly and pentad (5-day) mean precipitation for 2.5° x2.5° grid areas for the globe. Both datasets are updated quasi-regularly: the pentad data are complete through mid-2013 and the monthly dataset through December 2011 at present (the monthly dataset is scheduled for updating before the end of 2013).
CMAP is available in two versions. One version is based entirely on a combination of rain gauge observations and satellite-derived estimates and is referred to as CMAP/O; since observations are not available for some areas, particularly the polar caps, a spatially complete version (CMAP/A) incorporating model forecasts of precipitation from the NCEP/NCAR reanalysis is also available. The inputs used and some of their characteristics are:
1. An analyzed field derived from available gauge observations, using inverse distance weighting and directional shadowing (Xie et al. 1996).
2. Estimates derived from a variety of satellite observations, including geostationary and polar orbiting infrared and passive microwave.
3. Except in the "observation only" data sets, forecasts of precipitation from the NCEP/NCAR reanalysis.
The gauge-based analysis is best when a number of gauges are available in each grid area; this is the case only in limited regions. The estimates based on infrared observations are essentially based on variations in cold cloudiness, and are best suited for identifying changes in deep convective precipitation. They are most accurate in the tropics and warm season mid-latitudes, and are less accurate in colder conditions. Two types of passive microwave-based estimates are used: scattering and emission. Scattering estimates are best suited to detecting deep convection over both land and ocean, while emission estimates are sensitive to liquid rain over the oceans. All microwave-based estimates are significantly limited by sparse sampling.
The analysis technique used comprises two phases. In the first, all estimates except the gauge-based analysis are combined using a maximum likelihood estimate with weights derived by comparison to the gauge analysis for the same month (over land), or varying with season and latitude and based on earlier investigations (over oceans). In the version that uses model-derived precipitation (CMAP/A), the weights are constrained so that the reanalysis values receive very little weight unless no other observations are available. This process reduces the overall random error, but systematic errors remain. The analysis philosophy is to consider raingauge-derived values as accurate measures of the actual value of area-averaged monthly precipitation when sufficient gauge observations are available. Over land, this is implemented by using grid areas with more than a threshold number of gauge observations as fixed points while preserving the gradients derived form the other inputs. Over the tropical oceans, the mean value of the analysis is adjusted to equal the mean of raingauge observations from low islands and atolls in the western and central tropical Pacific Ocean. The full adjustment is applied between 20°N-20°S, and is smoothly reduced to zero between 20°-40°. The algorithm is described in Xie and Arkin (1996) and preliminary results in Xie and Arkin (1997).
Crucial points to be kept in mind by potential users:
1. The quality of the analysis is highly dependent on the quality and amount of input data used. Areas with sparse or no gauges, or areas where the satellite estimates have large errors or poor sampling, are likely to exhibit larger errors.
2. All of the satellite estimates used are significantly flawed. The infrared-based estimates depend upon an empirical relationship between cloudiness and precipitation that is poorly known, and which surely varies in space and time. The microwave-based observations are derived from sparse sampling, and also depend, although to a lesser degree, on empirical calibrations.
3. In general, the data set is best suited to identifying and quantifying in a relative manner the spatial and temporal variability of precipitation in the tropics. Variability in mid-latitudes is characterized less well, but still usefully. Great care is required in using the data at latitudes poleward of 60 degrees.
4. The absolute values given are generally less worthy of confidence than the variability. Global averages appear to be accurate to within 5-10%, but individual grid area values probably have much greater uncertainties.
5. The data set is not consistently useful for analysis of trends in global or large-scale precipitation. The merging of varying data sources relies to some extent on a presumption of stationarity, probably incorrect, that makes residual trends untrustworthy.
6. The use of island and atoll raingauge observations from a limited part of the tropical oceans to adjust global tropical oceanic values in the analysis is problematic. If the ratio of the gauge values used to collocated satellite estimates is not representative of the ratio over the entire global tropical oceans then an additional unknown error will be introduced to the analysis. Berg et al. (2002) have shown that significant differences exist in the characteristics of rainfall-producing systems in the western and eastern Pacific, and that those differences could “result in time-dependent regional biases in available long-term satellite precipitation datasets.”
7. The differences between CMAP and GPCP products, except where clearly associated with algorithm or data differences, are likely to be the best estimate of uncertainty in the analysis.
8. While CMAP and GPCP are valuable because of their long record, it is likely that more recently developed datasets are more accurate for the common periods of record, due to greater uniformity of input data sources and more advanced satellite-derived products. Both the GPCP and CMAP developers are working on newer products.##
Cite this page
Acknowledgement of any material taken from or knowledge gained from this page is appreciated:
Arkin, Phil &, Xie, PIngping & National Center for Atmospheric Research Staff (Eds). Last modified "The Climate Data Guide: CMAP: CPC Merged Analysis of Precipitation .” Retrieved from https://climatedataguide.ucar.edu/climate-data/cmap-cpc-merged-analysis-precipitation on 2026-05-24.
Citation of datasets is separate and should be done according to the data providers' instructions. If known to us, data citation instructions are given in the Data Access section, above.
Acknowledgement of the Climate Data Guide project is also appreciated:
Schneider, D. P., C. Deser, J. Fasullo, and K. E. Trenberth, 2013: Climate Data Guide Spurs Discovery and Understanding. Eos Trans. AGU, 94, 121–122, https://doi.org/10.1002/2013eo130001
Key Figures
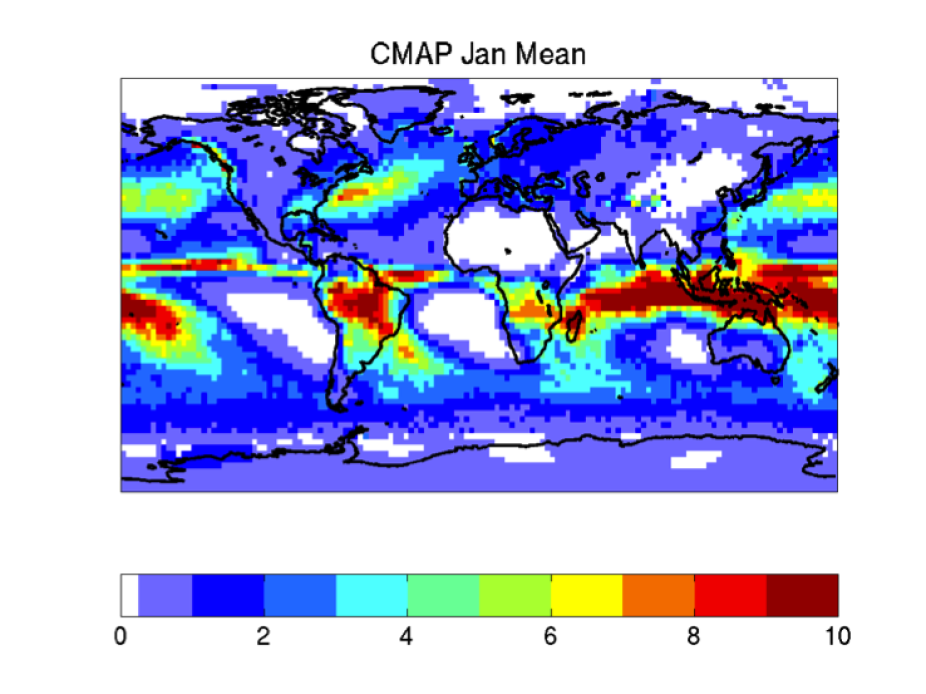
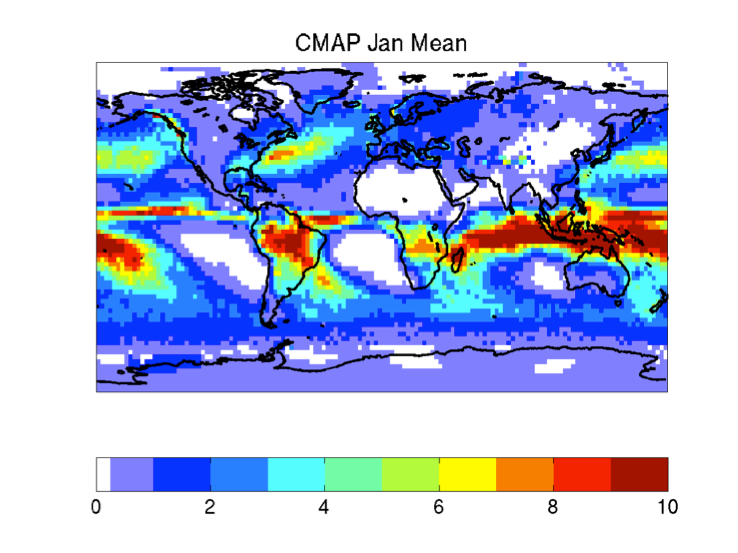
January mean precipitation in CMAP (contributed by P Arkin)
Other Information
- Xie, P., and P.A. Arkin, 1997: Global precipitation: A 17-year monthly analysis based on gauge observations, satellite estimates, and numerical model outputs. Bull. Amer. Meteor. Soc., 78, 2539 - 2558
- Xie, P. and P. A. Arkin, 1996: Analysis of global monthly precipitation using gauge observations, satellite estimates, and numerical model predictions, J. Climate, 9, 840-858.
- Xie, P. B. Rudolf, U. Schneider, and P.A. Arkin, 1996: Gauge-based monthly analysis of global land precipitation from 1971 – 1994. J. Geophy. Res., 101(D14), 19023-19034.
- Berg, W., C. Kummerow, C. A. Morales, 2002: Differences between East and West Pacific Rainfall Systems. J. Climate, 15, 3659–3672.