TRMM: Tropical Rainfall Measuring Mission
The Tropical Rainfall Measuring Mission (TRMM) is a joint space mission between NASA and Japan's National Space Development Agency designed to monitor and study tropical and subtropical precipitation and the associated release of energy. The mission uses 5 instruments: Precipitation Radar (PR), TRMM Microwave Imager (TMI), Visible Infrared Scanner (VIRS), Clouds & Earths Radiant Energy System (CERES) and Lightning Imaging Sensor (LSI). The TMI and PR are the main instruments used for precipitation. These instruments are used in an algorithm that forms the TRMM Combined Instrument (TCI) calibration data set (TRMM 2B31) for the TRMM Multi-satellite Precipitation Analysis (TMPA), whose TMPA 3B43 monthly precipitation averages and TMPA 3B42 daily and sub-daily (3hr) averages are probably the most relevant TRMM-related products for climate research. 3B42 and 3B43 are available in 0.25° spatial resolution, covering 50°N to 50°S for 1998-present.
As discussed in the Expert Guidance, the TMPA combines microwave data from multiple satellites including SSMI, SSMIS, MHS, AMSU-B and AMSR-E, each inter-calibrated to the TCI. Coverage gaps in space and time are filled in with calibrated infrared (IR) data (which are generally available with near-global coverage every 3 hours); coefficients are derived from co-located IR brightness temperatures and the microwave-based precipitation estimates. The final data products reflect scaling the multi-satellite estimates to rain gauge data on a monthly basis, and ensuring that the 3-hourly averages in 3B42 sum to the monthly totals in 3B43.
Due to the fact that TMPA timeseries are bulit up with estimates from constantly varying data sources, it is likely that inhomegeneities in the temporal record exist. Each precipitation field should be interpreted as the best estimate of precipitation in each grid point at the observation time. In general, as a high-resolution precipitation product, TMPA does not have the same homogeneity goals as a climate dataset like GPCP v2.2. Indeed, significant discrepancies in the interannual variability of rainfall over the ocean have been reported between TMPA version 7 and GPCP v2.2; see the Figures below for illustration.
After 17 years (1997-4/2015) the TRMM mission came to an end. The Global Precipitation Mission (GPM) is the successor mission. New products to supersede the TMPA datasets are being produced under the Global Precipitation Measurement (GPM) umbrella with the Integrated Multi-satellitE Retrievals for GPM (IMERG) algorithm. TRMM-era data have been reprocessed using the IMERG algorithm for 2000-present, creating a long-term continuous record. Likewise, the TMPA 3B42 and 3B43 analyses have continued into the GPM era, but are slated to end production at the end of 2019.
Key Strengths
Uniquely offers high spatial and temporal resolution precipitation estimates over a relatively long period of record (since 1998)
Useful for investigating the climatological distribution of rainfall, and its frequency and intensity
Useful for validation of tropical precipitation in climate models, provided that care is taken to put the data on comparable grids using conservative regridding and to use accumulated (rather than instantaneous) precipitation
Key Limitations
Complex algorithms are required to translate indirect and infrequent satellite measurements into high-resolution gridded precipitation estimates at regular time intervals
TRMM precipitation radar algorithm likely underestimates precipitation in (a) regions of intense convection over land and (b) higher latitudes
As a Climate Data Record with global coverage, GPCP should be preferred over TRMM for large-scale climate variability studies
Huffman, G.J., E.F. Stocker, D.T. Bolvin, E.J. Nelkin, R.F. Adler, 2012, last updated : TRMM Version 7 3B42 and 3B43 Data Sets. NASA/GSFC, Greenbelt, MD. Data set accessed at http: // mirador.gsfc.nasa.gov/cgibin/mirador/presentNavigation.pl
tree=project&project=TRMM&dataGroup=Gridded&CGISESSID=5d12e2ffa38ca2aac6262202a79d882a.
As an “Acknowledgment”, one possible wording is: "The TMPA data were provided by the NASA/Goddard Space Flight Center's Mesoscale Atmospheric Processes Laboratory and PPS, which develop and compute the TMPA as a contribution to TRMM."
Expert User Guidance
The following was contributed by Dr. Angeline Pendergrass (NCAR), July, 2014:
"TRMM 3B42 3-h precipitation data
TRMM 3B42 is a high-resolution (in both time and space) gridded record of precipitation. It provides rain rate in mm/hr with a spatial resolution of 0.25 degrees in latitude and longitude, with coverage from 50 S to 50 N, every 3 hours starting 1 January 1998 (when TRMM data became available) through a few months before present (with a lag for data processing). The rain rates are not instantaneous, but rather add up to monthly rainfall estimates found in TRMM 3B43. The product is at version 7 at the time of writing.
The measurements that go into the TRMM 3B42 precipitation estimates are from the TRMM passive microwave radiometer and precipitation radar, infrared radiometers, infrared brightness temperatures from geostationary satellites, and rain gauge measurements in a final step. The TRMM data are used to make monthly IR calibration tables, which are applied to the IR geostationary data to obtain the 3-hourly data, and then rescaled to agree with co-located microwave measurements and monthly rain gauge observations.
Typical research applications of this dataset include examining the climatological distribution of rainfall, and its frequency and intensity (e.g., Dai et al 2007, Biasutti and Yuter 2013, Pendergrass 2013), precipitation extremes (e.g., Rossow et al 2013), and properties of precipitating systems (e.g., Roca et al 2014). It can be used for validation of the distribution of tropical rain in climate models (e.g., Lin et al 2013, Donner et al 2011). Because of its high temporal resolution, the dataset can be used to explore the diurnal cycle (e.g., Chen et al 2012).
The key limitation of this dataset (like all merged-satellite precipitation products) is the indirect and complex nature of translating sparse satellite precipitation measurements into high-resolution gridded precipitation estimates. Satellites can only indirectly measure quantities related to rain rate at the surface: microwave and infrared satellites measure brightness temperature, which is then converted to rain rate indirectly, while radars measure energy reflected by cloud and rain drops throughout the depth of the column. Then, these indirect measurements (along with direct gauge measurements over land) are used as an input to a complex algorithm that produces estimates of surface rain rate on a regular grid in time and space. Finally, the satellite data used in TRMM misses many light rain events (Behrangi et al 2012, 2014).
To quantify the uncertainty of the rainfall estimates in TRMM3B42, the relative error in mm/hr is available for each datapoint in time and space. See Huffman (1997) for a complete description. However, these methods cannot account for the structural uncertainty in measuring precipitation, especially over the ocean where there is very limited opportunity for ground validation.
The TRMM 3B42 data are available in binary format via ftp. The MIRADOR web-based interface can convert the data to NetCDF (http://mirador.gsfc.nasa.gov/cgi-bin/mirador/presentNavigation.pl?tree=project&project=TRMM). The TOVAS web-based interface can plot the data as well as prepare data files for download in NetCDF and HDF formats (http://gdata1.sci.gsfc.nasa.gov/daac-bin/G3/gui.cgi?instance_id=TRMM_3B42_Daily). The data are also available in HDF format via ftp at ftp://trmmopen.gsfc.nasa.gov/pub/TMPA/TRMMstandard/3B42/.
Precipitation rate depends strongly on resolution in time and space, which is the source of the most common errors processing and interpreting this and other precipitation datasets (see Chen and Knutson 2008 for a thorough analysis of the effect of resolution on precipitation extremes). Errors in calculation and interpretation abound when precipitation datasets of different spatial resolutions are compared. Rain rates, and especially the distribution of rain rates at a particular location, depend strongly on the spatial resolution of the dataset. For example, a measure of extreme rain (e.g., 99th percentile rain rate) is expected to be very different in a time series observed from a surface rain gauge and in a co-located pixel of a gridded precipitation dataset such as TRMM 3B42, even if the data have the same temporal resolution.
In order to compare two precipitation datasets on grids with different resolutions, one should typically regrid one or both of the datasets to a common grid using a regridding method that conserves the total amount of rain falling in an area. Often, the default interpolation in an analysis software package is bilinear interpolation (e.g., Matlab), which is not conservative. One conservative regridding method is described in Jones (1999). The NCL language offers two methods to perform conservative regridding: area_conserve_remap or, the more robust, Earth System Modeling Framework (ESMF) regridding. See also the Climate Data Guide's regridding page (https://climatedataguide.ucar.edu/climate-data-tools-and-analysis/regridding-overview).
The uniform spatial grid of this dataset lends itself to comparison with climate models, as long as care is taken to put the data on comparable grids. The model precipitation data should be accumulated, rather than instantaneous, precipitation rate for comparison with TRMM 3B42. One could compare climatologies over the same time period, or compare variations in time by examining model integrations forced with prescribed SSTs (AMIP experiments) and historical forcing (see, e.g., Pendergrass 2013 for composites over warm and cold ENSO phases in CMIP5 AMIP experiments).
Other combined satellite-gauge precipitation datasets are listed by the International Precipitation Working Group and can be found here: http://www.isac.cnr.it/~ipwg/data/datasets1.html. One notable dataset which also combines satellite and rain gauge measurements, but with lower resolution in time and space (daily, one degree in latitude and longitude with global coverage) is GPCP 1dd. PERSIANN and CMORPH are other datasets with sub-daily temporal resolution and high spatial resolution. The Climate Data Guide has an overview of these and many more precipitation datasets here.
The research-grade standard TRMM 3B42 product should not be confused with the real-time product TRMM 3B42RT (documented in Huffman and Bolvin 2012). The main difference is that the standard delayed product incorporates further calibration.
Some corrections have been made to account for the changes in satellites used to generate this dataset over time. Direct estimates of rain rate come from TRMM’s precipitation radar and microwave radiometer, which are sparse in time and space, so much of the utility of this datasets is it’s extension from these sparse measurements of rain rate onto higher temporal resolution infrared measurements from geostationary satellites. Different IR datasets are used before 6 Feb 2000 and from 7 Feb onward. Separate calibrations for each satellite (of which there are many) are involved, separately over land and ocean and for different latitude bands. These are documented here: http://trmm.gsfc.nasa.gov/3b42.html.
There are some potentially spurious features in the temporal record. Liu and Allan (2012), Figure 2c, shows substantial disagreement of the monthly-mean, deseasonalized tropical precipitation anomalies over ocean between version 6 of TRMM 3B42 and other satellite-based precipitation datasets, including GPCP. This is particularly relevant for studies of inter annual precipitation variability over the ocean. See the figure here for an updated figure with version 7 data (the most recent). Note that the datasets show much more agreement over land than over ocean, which is expected because both datasets incorporate monthly rain gauge measurements over land (but not ocean)." ##
Expert Developer Guidance
The following was contributed by Dr. George J. Huffman (NASA), October, 2014:
(updated December 5, 2018 and February 14, 2021)
"TRMM Multi-Satellite Precipitation Analysis (TMPA)
Suitability for Climate Research
A long-term, near-global gridded precipitation dataset may be categorized as a High-Resolution Precipitation Product (HRPP), which strives to provide the best instantaneous precip estimates, or as a Climate Data Record (CDR), which emphasizes homogeneity over instantaneous accuracy. Of course, each approach tries to maintain the “other” goal, but it is secondary. The TMPA is an HRPP, while the GPCP conforms to CDR standards. As such, the TMPA depends on a continuously varying “virtual constellation” of satellites of opportunity, currently some 11 microwave satellites operated by 6 agencies. Particularly early in the TMPA record, there were relatively few microwave satellites. The flip side of this is that the early part of the TMPA record has over 50% coverage by microwave-calibrated IR estimates, and the IR coverage declines to 20% coverage in some recent years. Such variations should steer users away from the TMPA to the GPCP for climate studies. Additionally, the TMPA’s ~20-year record is really not sufficient for climate studies. On the other hand, analyzing the TMPA in parallel with the GPCP can give some insight by confirming particular results or not. One result that is nearly automatic is that the GPCP and TMPA agree rather closely at the monthly scale over most land areas because they both use the same GPCC monthly gauge analyses, and in similar ways. Finally, precipitation analyses in general, and satellite algorithms specifically, emphasize some version of “most likely” statistics. This fact implies that studies of extremes need to be realistic about what these products can be asked to do.
Interpreting Rainfall Estimates as a Function of Rain Rate
If you plot observed versus satellite precipitation grid values at the full 0.25° 3-hourly resolution the skill is modest, with huge relative error at small precipitation rates. Studies show that time and/or space averaging substantially reduces the random error, characteristically collapsing the scatterplot toward the 1:1 line. The point of handing out the data at fine scales with large uncertainty is that the user has the freedom to create averages in ways that best correspond to the problem at hand. In contrast, the relatively well-behaved 3B43 (monthly TMPA) forces the user to use data in calendar-month units; a monthly average from one month’s mid-point to the next is not possible. At the fine scales in full-resolution 3B42, we usually observe that random error dominates the error budget – that is, the part of the error that averages out with sufficiently long averaging. The bias (the persistent part of the error that tends to bedevil climate studies) is hard to estimate, although we have tried to make a fair estimate of the “real” climatology for TRMM:
Wang, J.-J., R.F. Adler, G.J. Huffman, D.F. Bolvin, 2014: An Updated TRMM Composite Climatology of Tropical Rainfall and Its Validation. J. of Climate, 27(1), 273-284.
It is fair to say that error estimates are lagging behind where we expected them to be. However, recent work shows some promise of getting a handle on error estimation, for example using the work by Maggioni and collaborators:
Maggioni, V., M.R.P. Sapiano, R.F. Adler, Y. Tian, G.J. Huffman, 2014: An Error Model for Uncertainty Quantification in High-Time Resolution Precipitation Products. J. Hydrometeor., 15(3), doi:10.1175/JHM-D-13-0112.1, 1274-1292.
There is some hope that this approach will naturally encompass both random and bias errors. The cost is that we’re going to end up with quantiles of estimated precip at each time at each grid box. Such detail will not be suitable for all users, so we will need to produce a simplified error estimate as well.
The Behrangi et al. (2014) paper
Behrangi, A., G. Stephens, R.F. Adler, G.J. Huffman, B. Lambrigtsen, M. Lebsock, 2014: An Update on Oceanic Precipitation Rate and Its Zonal Distribution in Light of Advanced Observations from Space. J. Climate, 27(11), doi: 10.1175/JCLI-D-13-00679.1, 3957-3965.
provides a more-quantitative view of the bias errors that we’ve long suspected. The seriousness of the results depend on which statistics you’re trying to use: how important is it to get the lightest precip rates right that give 5% of the amount, but 40% of the events, or whatever the numbers are in the area of interest? Essentially all the precip data set algorithms have focused on getting the averages right, and it’s a much more challenging problem to also get the distribution of precip rates quantitatively correct.
Algorithm and Processing
See the accompanying Technical Notes and links therein for a description of the steps involved in producing the TMPA products. To summarize, The Tropical Rainfall Measuring Mission (TRMM) is a joint U.S.-Japan satellite mission to monitor tropical and subtropical precipitation and to estimate its associated latent heating. TRMM was successfully launched on November 27, 1997 at 4:27 PM (EST) from the Tanegashima Space Center in Japan. The precipitation-relevant instruments on the TRMM satellite include the Precipitation Radar (PR), an electronically scanning radar operating at 13.8 GHz; TRMM Microwave Image (TMI), a nine-channel passive microwave radiometer; and Visible and Infrared Scanner (VIRS), a five-channel visible/infrared radiometer.
The purpose of the 3B42 algorithm is to produce TRMM- and raingauge-adjusted multi-satellite precipitation rate (in mm/hr) and root-mean-square (RMS) precipitation-error estimates. The algorithm combines multiple independent precipitation estimates from the TMI, Advanced Microwave Scanning Radiometer for Earth Observing Systems (AMSR-E), Special Sensor Microwave Imager (SSMI), Special Sensor Microwave Imager/Sounder (SSMIS), Advanced Microwave Sounding Unit (AMSU), Microwave Humidity Sounder (MHS), and microwave-adjusted merged geo-infrared (IR). All input microwave data are intercalibrated to TRMM Combined Instrument (TCI) precipitation estimates (TRMM product 2B31); the IR estimates are computed using monthly matched microwave-IR histogram matching; then missing data in individual 3-hourly merged-microwave fields are filled with the IR estimates. After the preprocessing is complete, the 3-hourly multi-satellite fields are summed for the month and combined with the monthly accumulated Global Precipitation Climatology Centre (GPCC) rain gauge analysis using inverse-error-variance weighting to form a monthly best-estimate precipitation rate, which is TRMM Product 3B43. The final step is to scale all the 3-hourly estimates for the month to sum to the monthly value (for each gridbox separately). The final 3B42 precipitation (in mm/hr) estimates have a 3-hourly temporal resolution and a 0.25°x0.25° spatial resolution. The spatial coverage is the latitude band 50°S to 50°N.
Limits are imposed on the scaling to avoid unphysical results, so particularly in low-rain areas, the 3B42 values in a month may not sum exactly to the corresponding 3B43. For this reason, 3B43 is the preferred dataset for monthly values.
Version 7 Updates
The TRMM data system was designed to provide episodic, complete reprocessings of the TRMM products to take advantage of ongoing research to improve the various scientific algorithms. [Subsequently, such reprocessing has come to be viewed as a best practice for data archives in general.] The latest reprocessing for TRMM moved the products from Version 6 to 7, and the current data set has been processed using the Version 7 algorithms.
Quoting from the technical document for the TMPA,
Huffman, G.J., D.T. Bolvin, 2018: TRMM and Other Data Precipitation Data Set Documentation. NASA/GSFC, https://pmm.nasa.gov/sites/default/files/document_files/3B4XRT_doc_V7_180426.pdf , 51 pp.
and noting well that there are differences over both land and ocean:
The *transition from Version 6 to Version 7* for TRMM datasets occurred on 30 June 2011, with June 2011 being the final month of Version 6 data. Thereafter, the Precipitation Processing System (PPS) was reconfigured to start the parallel activities of Version 7 “initial processing” (IP) for new data (starting 1 July 2011), and Version 7 reprocessing (RP) for the entire archive starting 1 January 1998. The TMPA lagged the other TRMM products to allow for calibration and to finalize use of SSMIS data. This release incorporated several important changes as part of the upgrade to Version 7:
• Additional satellites, including the early parts of the MHS record, the entire operational SSMIS record, and slots for future satellites.
• A new IR brightness temperature dataset for the period before the start of the CPC 4-km Merged Global IR Dataset (i.e., January 1998 – February 2000). Unlike the old GPCP histograms used in Version 6, the NCDC GridSat-B1 features spatial resolution finer than the TMPA 0.25 grid and full coverage of the TMPA domain.
• Uniformly reprocessed input data using current algorithms, most notably for AMSU and MHS, but also including TCI, TMI, AMSR-E, and SSMI.
• Use of a single, uniformly processed surface precipitation gauge analysis using current algorithms as computed by the Global Precipitation Climatology Centre (GPCC).
• Use of a latitude-band calibration scheme for all satellites (see “HQ”).
• Additional output fields in the data files, including sensor-specific source and overpass time.
The complete Version 6 archive was maintained for public access throughout and beyond the cutover to Version 7. For Initial Processing (IP), our switch to the GPCC gauge analysis necessitates increasing the latency of the products from 10 days after the month, which was the case in Version 6, to about two months after the end of the month. The initial Version 7 release occurred in May 2012, while the second set was posted in December 2012.
Initial testing showed that the revisions eliminated the unrepresentatively low bias in ocean values for 2001-2007 that were related to how we treated an early version of AMSU-based precipitation in Version 6. However, we found that the V7 tropical-ocean average precipitation is consistently some 5% higher than the combined TMI-PR product (2B31) that serves as the calibrator. The basis for this difference is not explicated at this point, but the value is small enough and consistent enough that we chose to release the data.
Note: As discussed below, up through September 2014 calibration to TCI was computed on a month-to-month basis. Thereafter, the shutdown of the PR required a climatologically based calibration. This change introduces a data boundary that must be examined for impact on each user’s application.
Making the Transition from TRMM to GPM Data Sets
TRMM ran out of fuel in mid-2014 and began a slow descent. As well, there were some battery issues. By 7 October 2014, the satellite descended to an altitude that precluded useful radar data, which necessitated a different calibration procedure for 3B42 starting with October 2014 data. This implies at least a slight inhomogeneity, primarily over the oceans because we know that calibrations involving PR have a different interannual behavior than calibrations based solely on passive microwave. All TMPA production ceased with the last datafile date/time for 2019.
We recognized that the real-time version of 3B42, 3B42RT, had a strong application focus, and expect to run it until the equivalent IMERG products are satisfactory, which happened in mid-2020. Undoubtedly, users wanted the old product forever, but at some point we had to stop.
The retrospective processing for IMERG that we released in mid-2020 took us back to June 2000. The goal is January 1998, the start of TRMM, but one of the critical input datasets for IMERG is not now available before mid-February 2000 in the correct form. This is equally true for all runs, including the Final. Given the sea change in algorithms, this first general GPM reprocessing across the TRMM era stands as the final TRMM reprocessing, since the GPM products (including IMERG) cover the same period and are better than the old TRMM-specific algorithms.
For more details on the TRMM-to-GPM transition, see
https://gpm.nasa.gov/resources/documents/transition-multi-satellite-products-trmm-gpm-tmpa-imerg .
As things move along, the Global Precipitation Measurement mission (GPM) web site,
https://gpm.nasa.gov/data/news,
is the right general source for news. As well, it hosts has a one-stop set of web pages specifically aimed at new users, listing all of the basic and derived TRMM and GPM datasets available through Goddard Space Flight Center:
https://gpm.nasa.gov/data/directory.
These pages include documentation about the data sets and algorithms, and contact information. IMERG-specific announcements will be posted to the IMERG mailing list, to which precipitation data users may subscribe (just ask through https://gpm.nasa.gov/contact).
##
Cite this page
Acknowledgement of any material taken from or knowledge gained from this page is appreciated:
Huffman, George J. &, Pendergrass, Angeline & National Center for Atmospheric Research Staff (Eds). Last modified "The Climate Data Guide: TRMM: Tropical Rainfall Measuring Mission.” Retrieved from https://climatedataguide.ucar.edu/climate-data/trmm-tropical-rainfall-measuring-mission on 2026-06-22.
Citation of datasets is separate and should be done according to the data providers' instructions. If known to us, data citation instructions are given in the Data Access section, above.
Acknowledgement of the Climate Data Guide project is also appreciated:
Schneider, D. P., C. Deser, J. Fasullo, and K. E. Trenberth, 2013: Climate Data Guide Spurs Discovery and Understanding. Eos Trans. AGU, 94, 121–122, https://doi.org/10.1002/2013eo130001
Key Figures
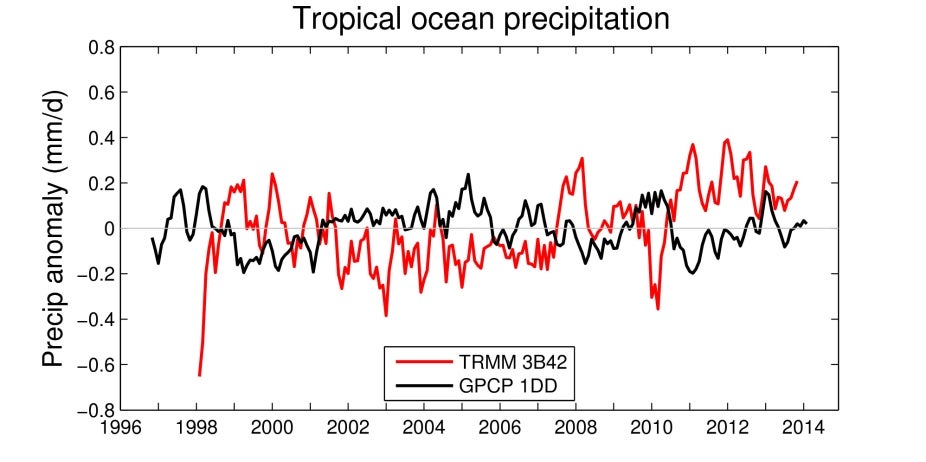
Timeseries of deseasonalized 3-month running mean tropical (30 N - S) rainfall in TRMM 3B42 version 7 and GPCP 1DD data, following Figure 2c of Liu and Allan (2012), who used version 6. (contributed by A. Pendergrass)

Rain frequency distribution at each latitude in TRMM (TMPA) 3b42 version 7 data, coarsened to 1 degree resolution and daily averages (for comparison with GPCP 1DD and also for presentation), 1998-2013. Left: dry day frequency (%). Right: Rain frequency with logarithmically-spaced rain rate bins. Units are percent per increment of rain rate, so evenly spaced increments of rain rate can be compared. Striations at light rain rates occur because the data contain discrete values of daily rain rate for light rain over the ocean. (contributed by A. Pendergrass)

Comparison of TMPA 3B43V7, TMPA V6, and GPCP v2.2 precipitation timeseries (5-month running average) over 50N-50S. Top panel :ocean & land; middle panel: ocean; bottom panel: land (includes timeseries from GPCC Renav6 and CRU TS3.21). Credit: Climate Data Guide, NCAR, D. Shea.
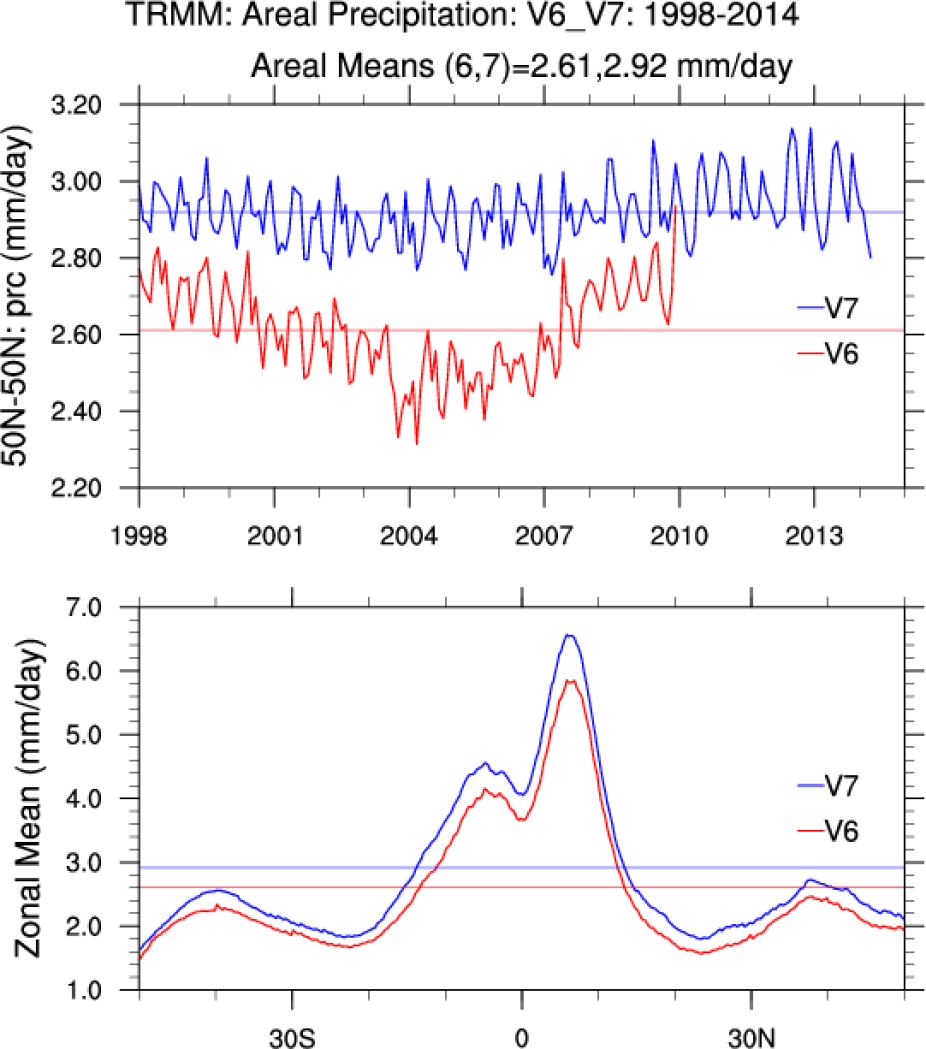
Top: Areal weighted mean of 3B43 precipitation rate for V6 (1998-2009) and V7 (1998-2014). Bottom: zonal mean precipitation (mm/day) for versions V6 and V7. The thin horizontal line is the climatological long term mean. Climate Data Guide; D.Shea
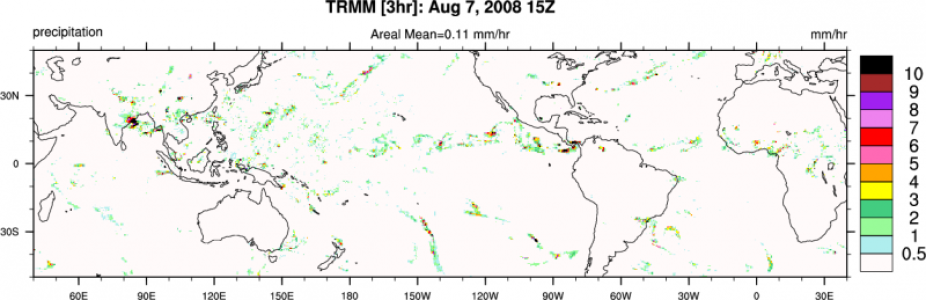
A 3-hourly snapshot for August 7, 2008 (15Z). This illustrates the spatial discontinuity of precipitation. Climate Data Guide; D.Shea
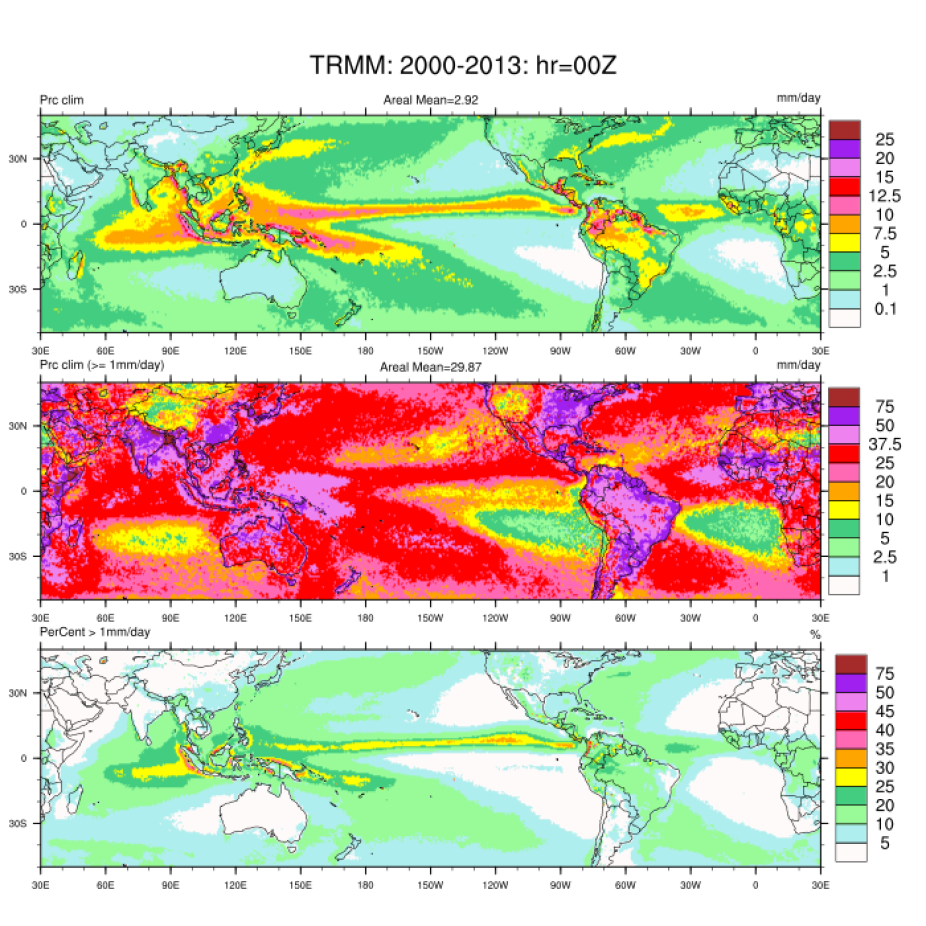
TRMM 3-hourly rain rate (mm/day) centered at 00Z: TOP: time average over all years (here 2003-2013); MIDDLE: time average using only values when precipitation rate >= 1.0 mm/day ( i.e. ... when it rains ... what is the mean rain rate); BOTTOM: % of the time is it raining [rain is >= 1.0mm/day]. Climate Data Guide; D.Shea
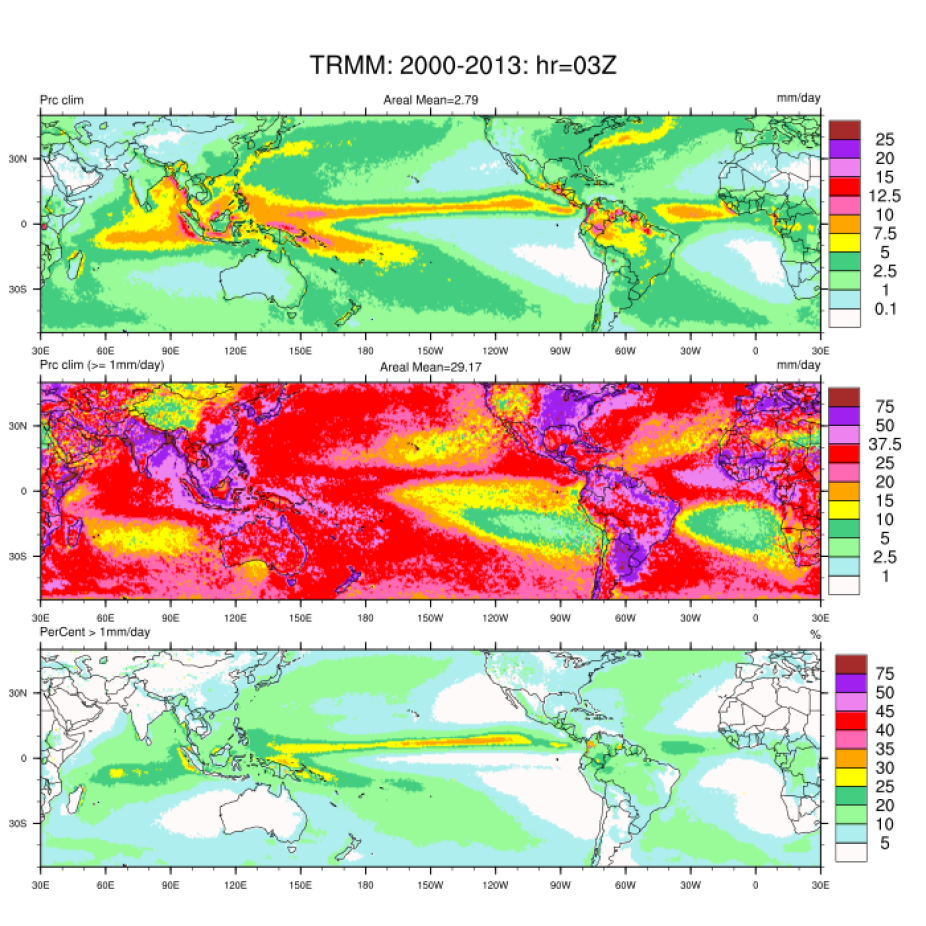
TRMM 3-hourly rain rate centered at 03Z. See 00Z description. Climate Data Guide; D.Shea
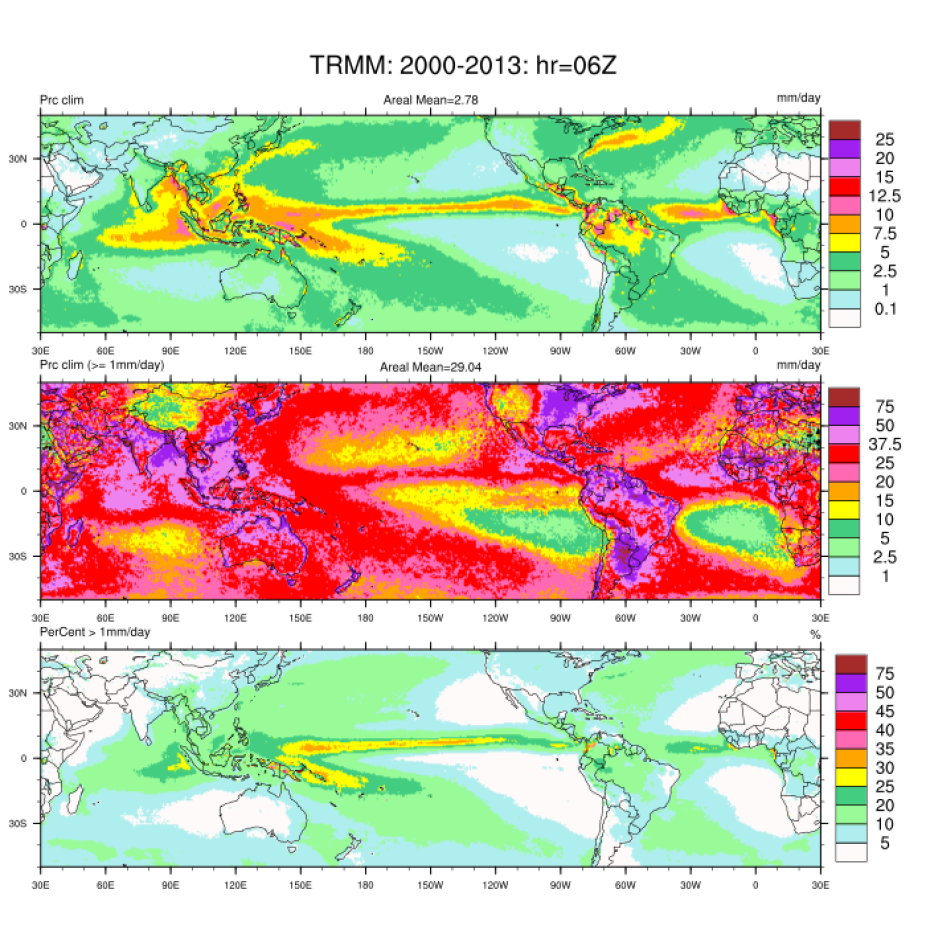
TRMM 3-hourly rain rate centered at 06Z. See 00Z description. Climate Data Guide; D.Shea
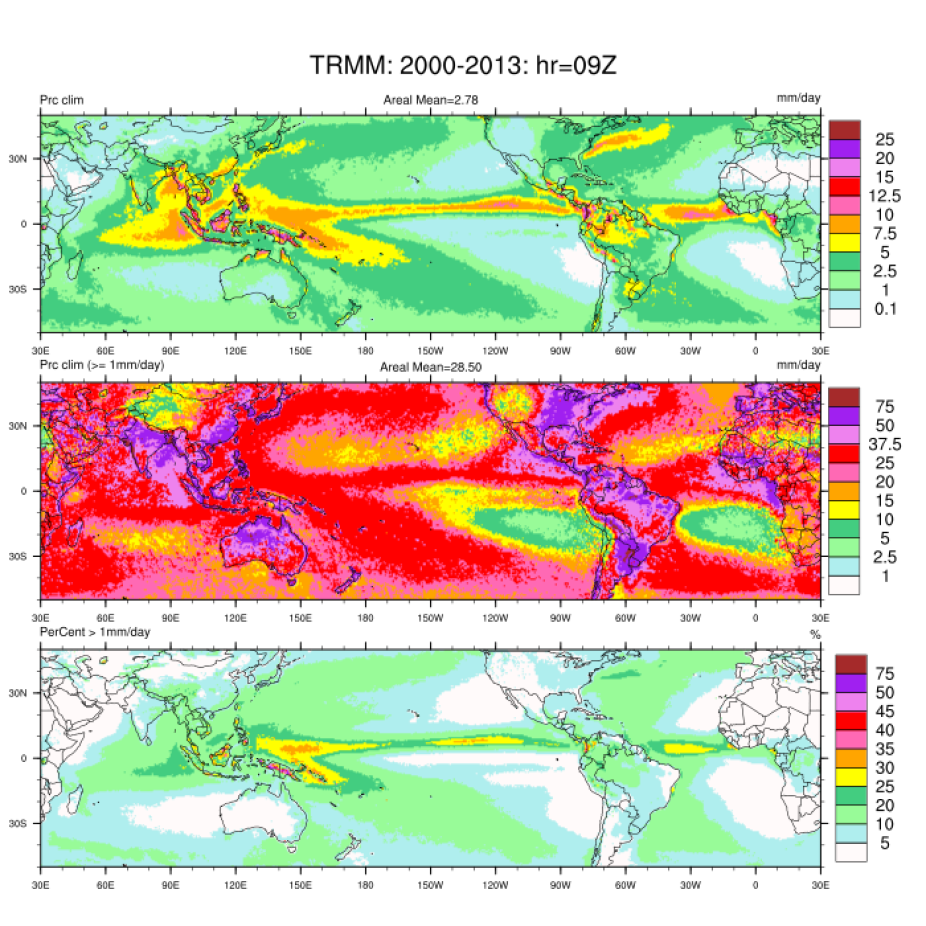
TRMM 3-hourly rain rate centered at 09Z. See 00Z description. Climate Data Guide; D.Shea
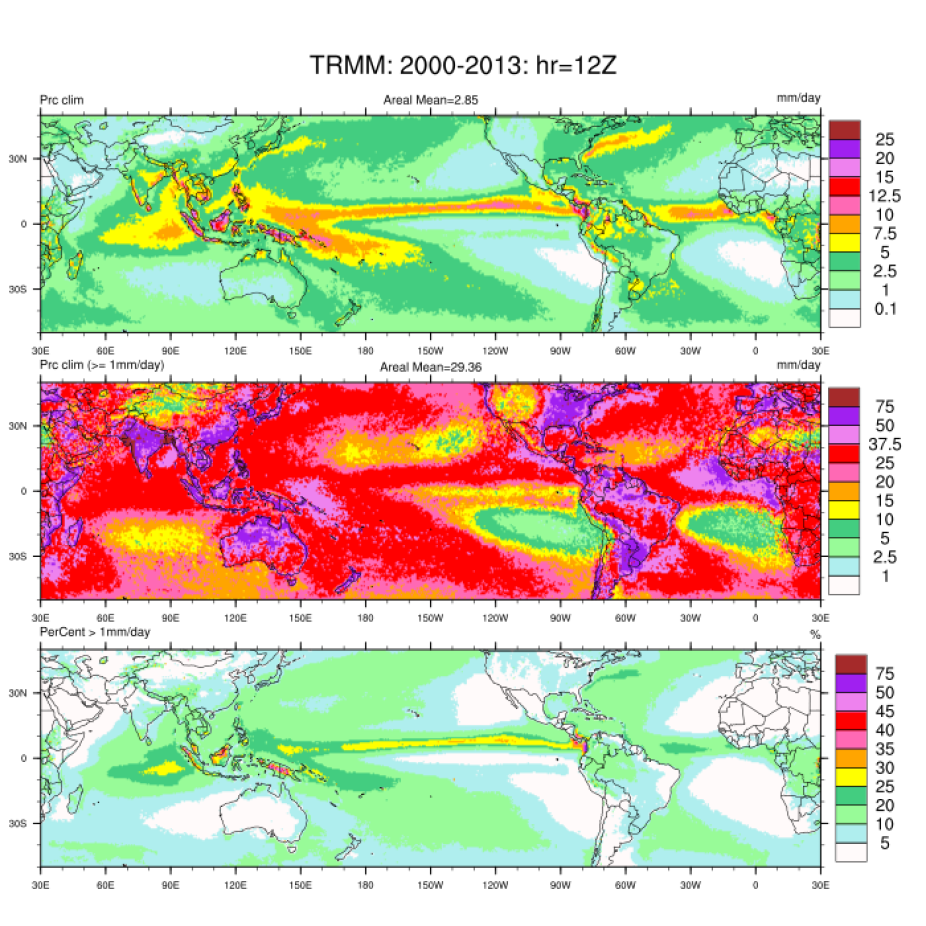
TRMM 3-hourly rain rate centered at 12Z. See 00Z description. Climate Data Guide; D.Shea
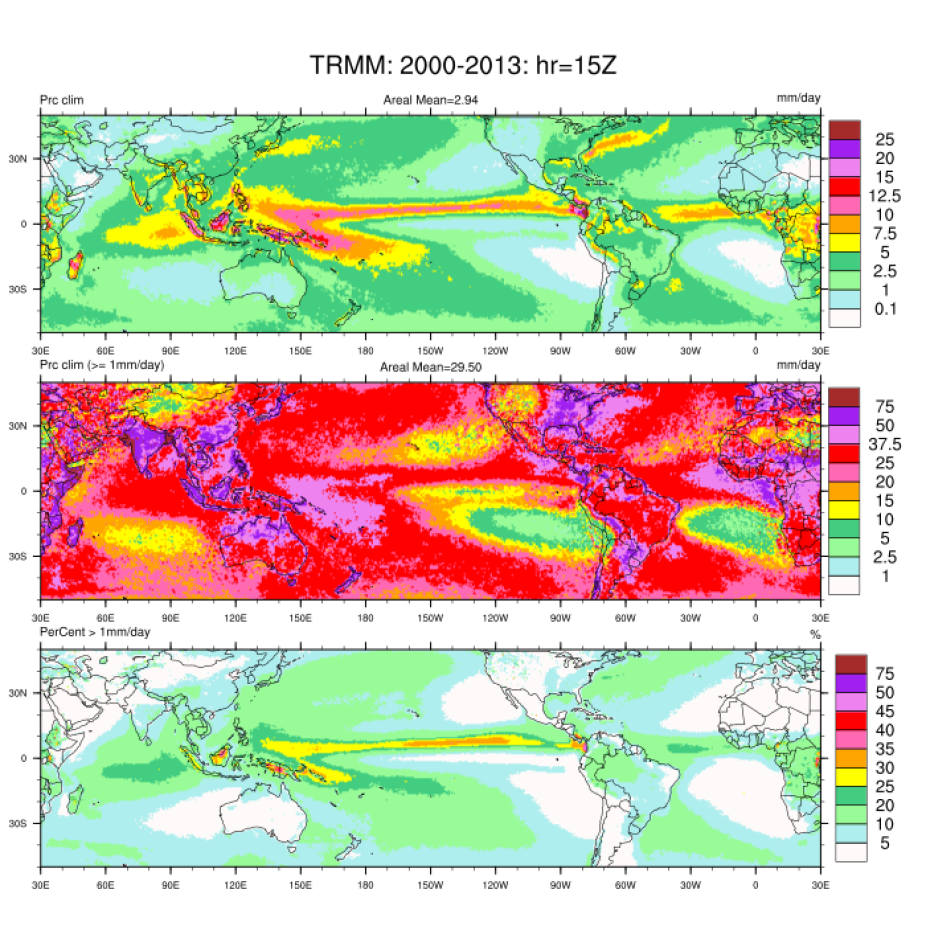
TRMM 3-hourly rain rate centered at 15Z. See 00Z description. Climate Data Guide; D.Shea

TRMM 3-hourly rain rate centered at 15Z. See 00Z description. Climate Data Guide; D.Shea
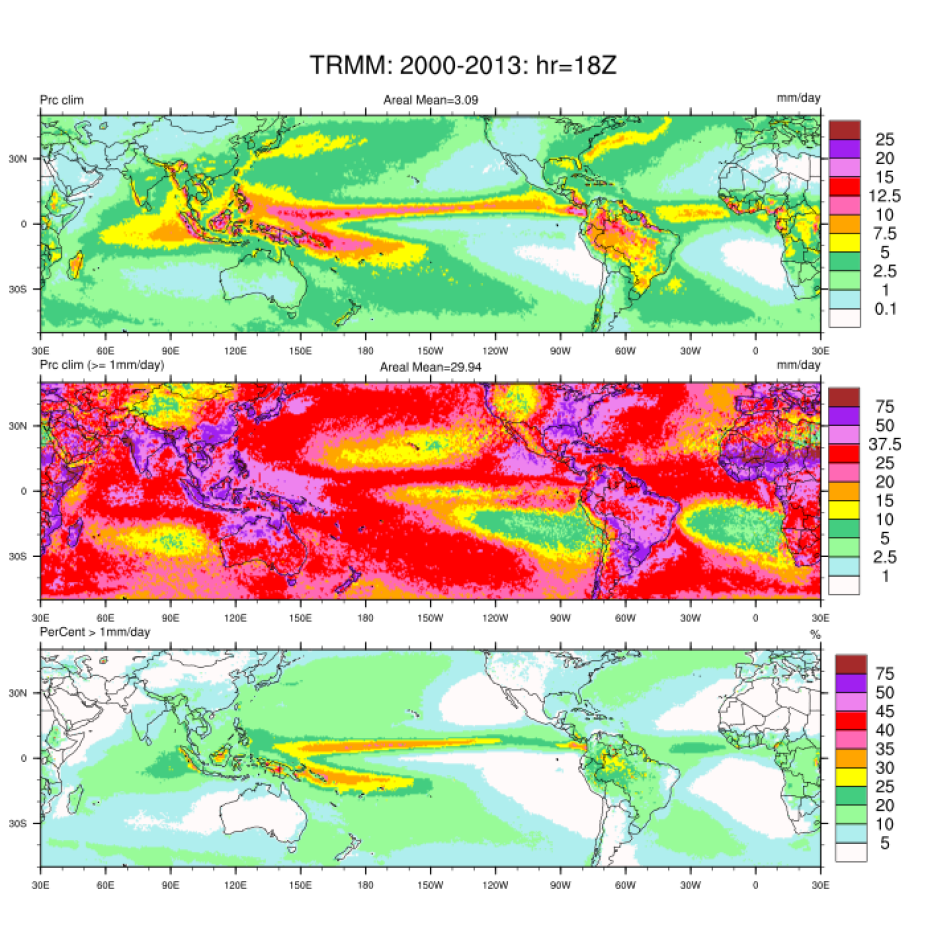
TRMM 3-hourly rain rate centered at 18Z. See 00Z description. Climate Data Guide; D.Shea
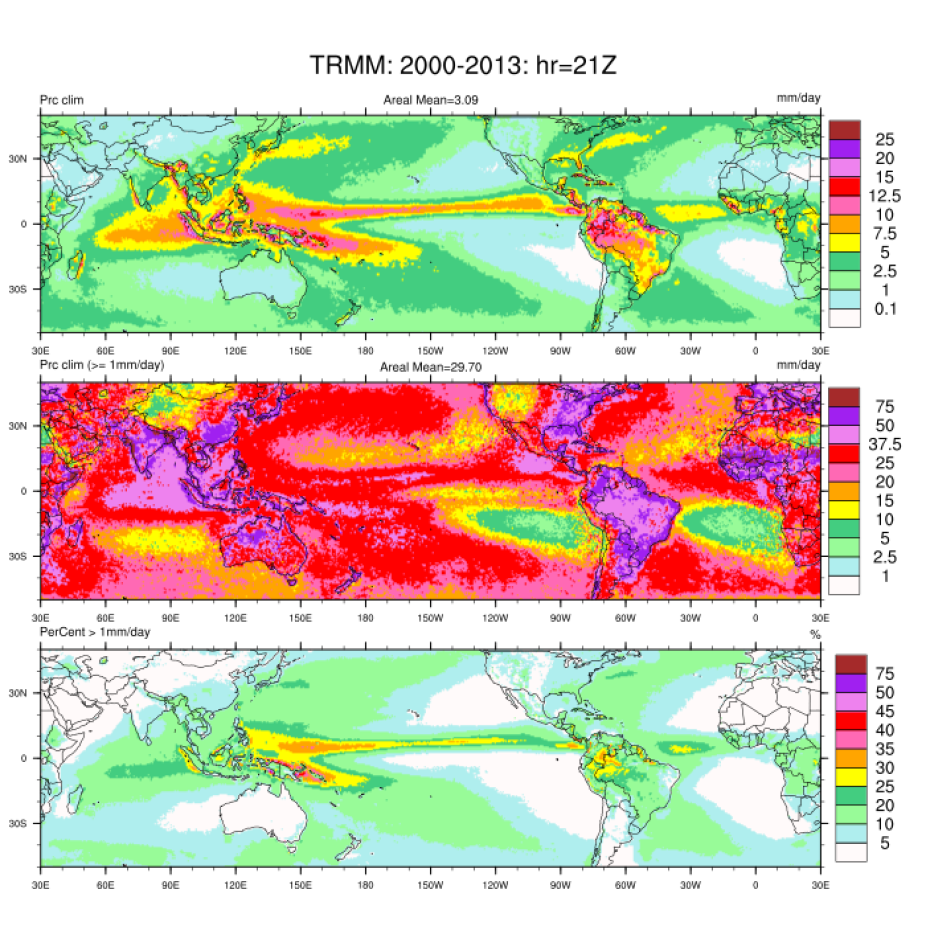
TRMM 3-hourly rain rate centered at 21Z. See 00Z description. Climate Data Guide; D.Shea

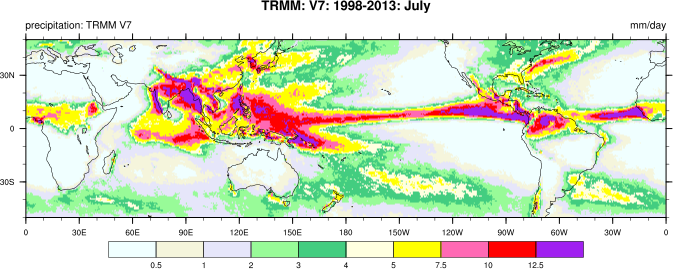
TRMM 3B43 V7: July 1998-2013 climatology. Climate Data Guide; D.Shea
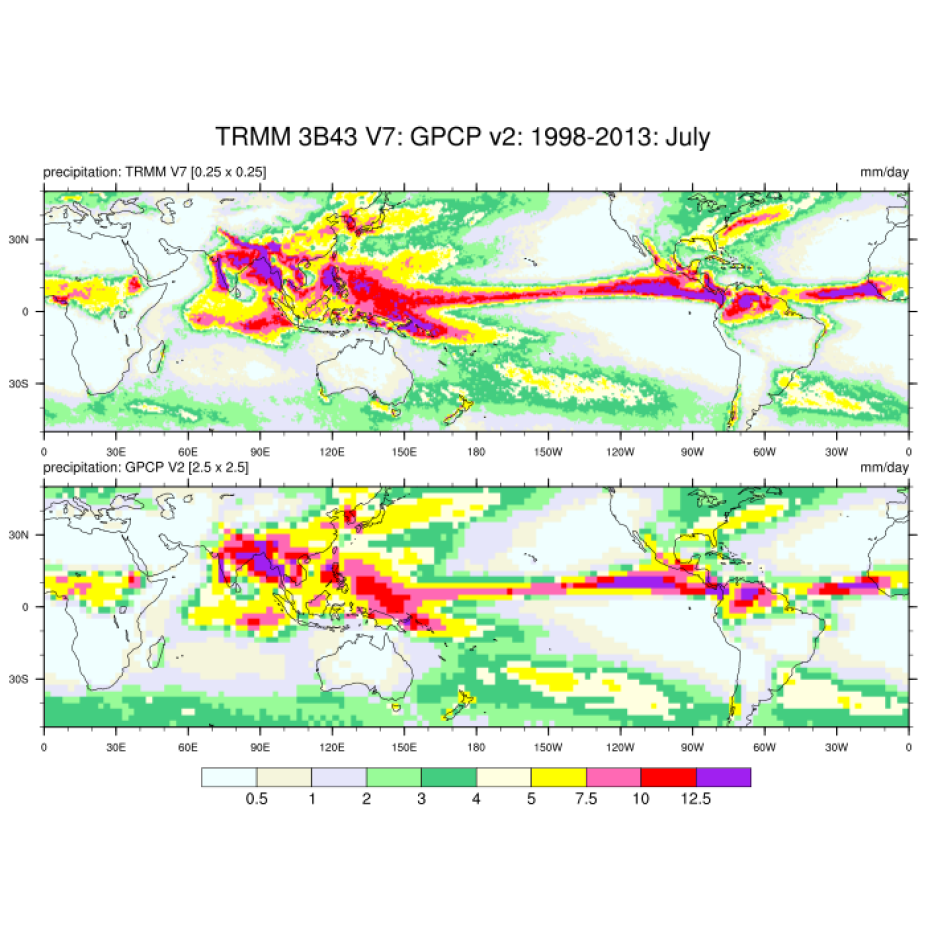
July climatology (July climatology (1998-2013): TRMM 3B43 (top), GPCP V2 (bottom). Climate Data Guide; D.Shea
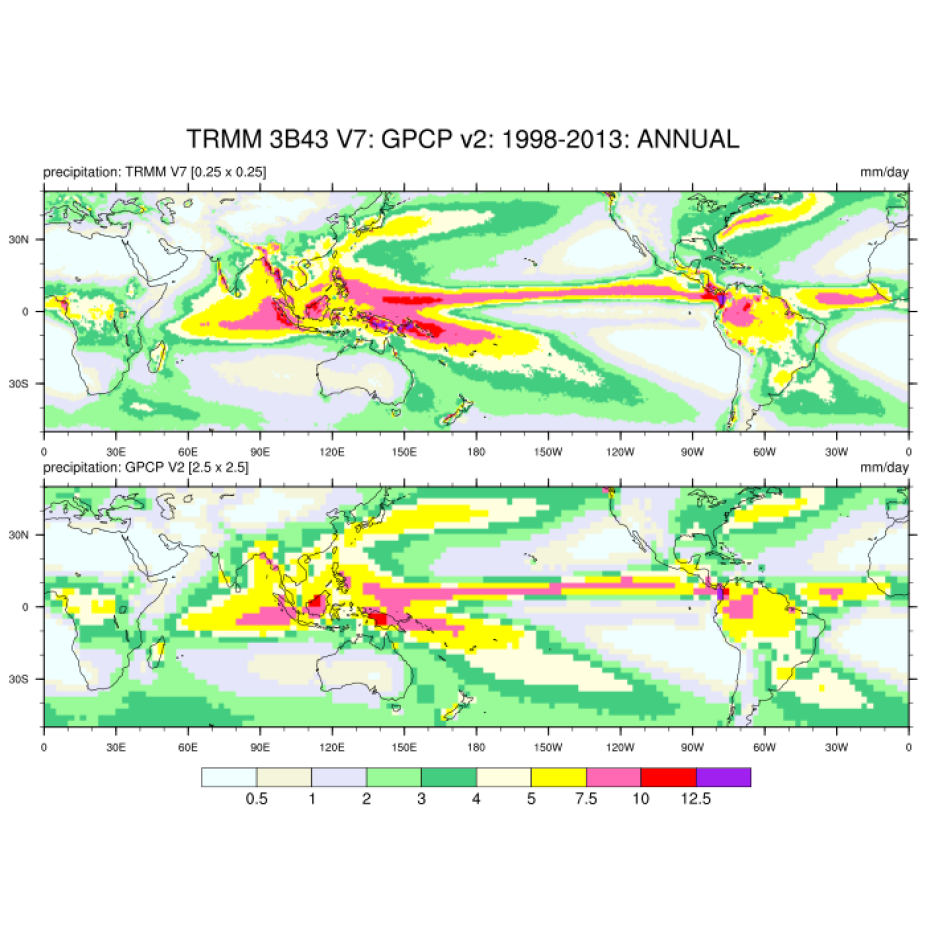
Annual climatology (1998-2013): TRMM 3B43 (top), GPCP V2 (bottom). Climate Data Guide; D.Shea
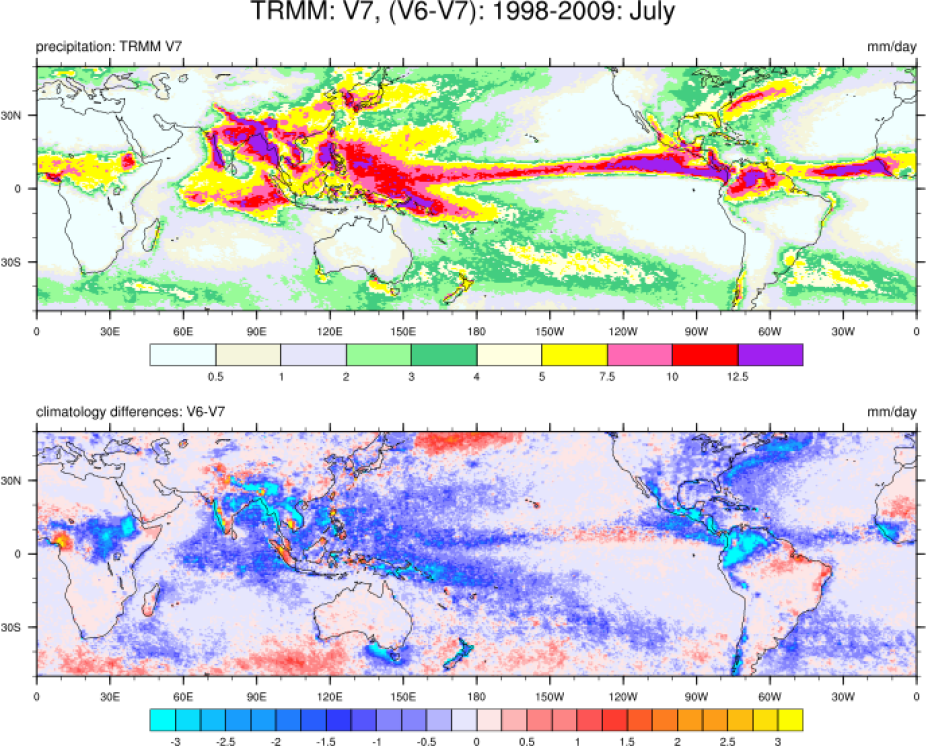
TRMM 3B43 V7 July 1998-2009 climatology (top); Difference (V6-V7) between July climatologies. Climate Data Guide; D.Shea
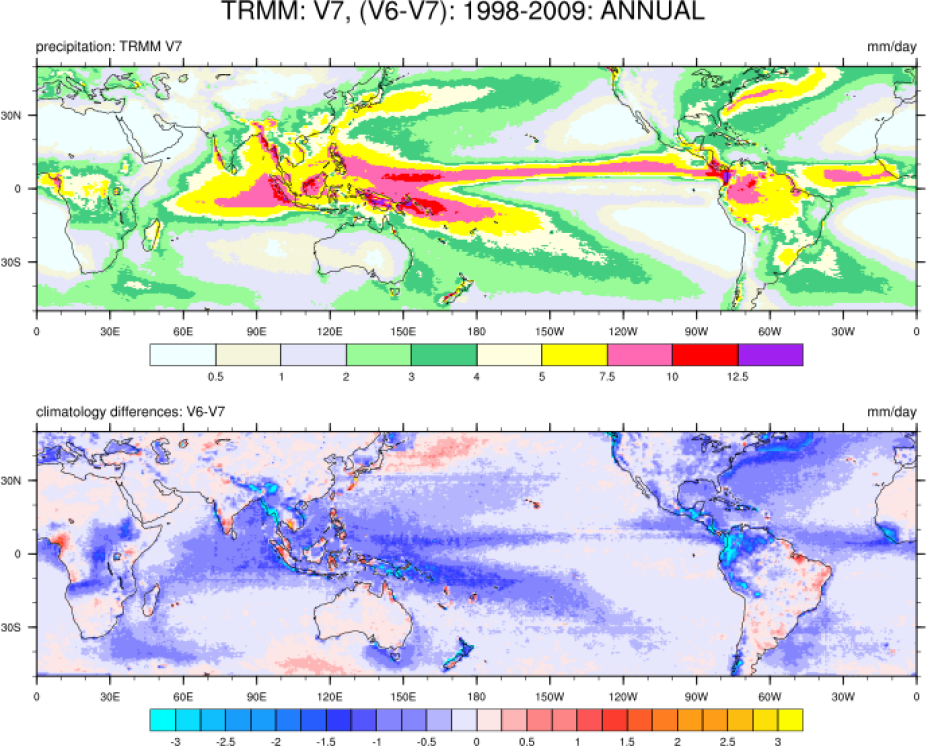
TRMM 3B43 V7 July 1998-2009 climatology (top); Difference (V6-V7) between Annual climatologies. Climate Data Guide; D.Shea