GPCP (Monthly): Global Precipitation Climatology Project

Data from rain gauge stations, satellites, and sounding observations have been merged to estimate monthly rainfall on a 2.5-degree global grid from 1979 to the present. The careful combination of satellite-based rainfall estimates provides the most complete analysis of rainfall available to date over the global oceans, and adds necessary spatial detail to the rainfall analyses over land. In addition to the combination of these data sets, estimates of the uncertainties in the rainfall analysis are provided as a part of the GPCP products. The August 2012 GPCP v2.2 uses upgraded emission and scattering algorithms, the GPCC precipitation gauge analysis, and inclusion of the DMSP F17 SSMIS. The December 2012 update contains "recomputed" October 2012 values.
GPCP v2.2 has ceased production.
The current version is GPCPv2.3; please see the expert guidance from Jian-Jian Wang for a discussion of the strengths and limitations of version 2.3.
GPCP v2.3 does not include the precipitation estimates from TRMM, GPM, or Cloudsat, which will be used in GPCP V3, which is under development.
Key Strengths
Provides global coverage; one of the most-used precipitation data sets for climate variability studies.
Provides estimates of uncertainty due to random errors (but not systematic errors). Regularly updated.
Useful for validation of global precipitation in climate models, provided that care is taken to put the data on comparable grids using conservative regridding.
Key Limitations
Complex algorithms are required to translate indirect and infrequent satellite measurements into high-resolution gridded precipitation estimates at regular time intervals
Debate about whether the global-mean precipitation amount is under-estimated, due possibly to missing light rain over ocean (especially the Southern Ocean) and to missing orographic precipitation over land.
Different satellites are used at different latitudes, leading to some spatial heterogeneity.
Adler, R., and Coauthors, 2016: Global Precipitation Climatology Project (GPCP) Climate Data Record (CDR), Version 2.3 (Monthly). https://doi.org/10.7289/V56971M6.
Adler, R., and Coauthors, 2018: The Global Precipitation Climatology Project (GPCP) Monthly Analysis (New Version 2.3) and a Review of 2017 Global Precipitation. Atmosphere, 9, 138, https://doi.org/10.3390/atmos9040138.
Expert User Guidance
The following was contributed by Angeline Pendergrass (NCAR), July, 2014:
"GPCP monthly data
The GPCP monthly dataset is a widely-used global monthly gridded precipitation dataset. It has global coverage on a 2.5 x 2.5 degree grid. The dataset begins in 1979 and continues through the present, with some delay for processing. It is used to calculate the climatology of precipitation, for comparison with climate models, and for analysis of changes over the recent past.
GPCP combines microwave and infrared measurements, and outgoing longwave radiation retrievals from satellites and, over land, also incorporates rain gauge observations. The available input data change over time as satellites are launched and retired and the gauge network evolves. The microwave satellite data in particular are thought to be quite accurate. Over land, microwave scattering data are used, while over ocean microwave emission measurements are used. The microwave retrievals are problematic over ice and at high latitudes, and are phased out starting at 40 degrees of latitude.
All GPCP versions are multi-satellite combination datasets. The analysis method changed from version 1 (described in Huffman et al 1997) to 2 (described in Adler et al 2003). Version 2.1 incorporated a substantial update of the gauge input dataset (described in Huffman et al 2009); version 2.2 included data from the SSMIS satellite (currently described only in the documentation, Huffman and Bolvin 2012).
GPCP “was formed to improve understanding of seasonal to inter-annual and longer term variability of the global hydrological cycle, determine the atmospheric latent heating rates needed for weather and climate prediction models, and provide an observational data set for model validation and initialization and other hydrological applications.” (Gruber and Levizzani 2008). Some examples of studies that use the dataset follow. The climatology from GPCP is often used to validate climate models (e.g., Donner et al 2011, Giorgetta et al 2013) and reanalyses (Bosilovich et al 2011). It is used to study variations in precipitation at global (e.g., Allan et al 2013, Trenberth 2011, John et al 2009, Su and Neelin 2003) and regional scales (e.g., Giannini et al 2008). Wentz et al (2007) use the land data along with their own analysis over ocean to examine trends in global precipitation. It can be used to examine relationships between circulation and precipitation (e.g., Screen et al 2013, Frierson et al 2013, Loeb et al 2014, Johnson and Xie 2010).
Uncertainty is characterized via an error estimate of each datapoint available alongside the dataset. This estimate accounts only for the random error, and depends on the mean rain rate and the number of samples used to calculate it (Huffman 1997). Other systematic sources of error (such as the dependence on the observing system) are not quantified, though they are also present. The most important systematic errors are over ocean, where there are few regular surface measurements to provide validation of satellite estimates. There is a at least one attempt at validation using measurements from small islands (Pfeifroth et al 2013), though their representativeness is still in question (Wang et al 2014).
The key limitation of this dataset (like all merged-satellite precipitation products) is the indirect and complex nature of translating sparse satellite precipitation measurements into gridded precipitation estimates. Satellites can only indirectly measure quantities related to rain rate at the surface: microwave and infrared satellites measure brightness temperature, which is then converted to rain rate indirectly, while radars measure energy reflected by cloud and rain drops throughout the depth of the column. Then, these indirect measurements (along with direct gauge measurements over land) are used as an input to a complex algorithm that produces estimates of surface rain rate on a regular grid in time and space. Many of the data that go into the precipitation estimates are actually measurements of clouds, rather than precipitation itself. Also, the lack of rain gauges for ground validation over ocean introduces unknown systematic errors into this and all ocean precipitation estimates from satellites.
There is active debate about the possibility that the global-mean amount of precipitation in GPCP is lower than is necessary to balance other components of the global energy budget (see Stephens et al 2012, Wild et al 2012, Behrangi et al 2014, Trenberth et al 2009). Stephens et al (2012) and Behrangi et al (2014) argue that the GPCP dataset may be missing light rain over ocean, and may suffer from a lack of ground validation in the Southern Ocean in particular. The satellite estimates used in GPCP miss light rain events compared to CloudSat (Behrangi et al 2012, 2014b). Trenberth and Fasullo (2013) evaluate moisture flow from land to ocean in order to validate precipitation data (in combination with evaporation estimates), which captures orographic rain that isn’t captured by the gauge network. These “missing” rainfall sources may help explain why GPCP has a lower global-mean precipitation than climate models.
A list of comparable satellite-gauge precipitation datasets was compiled by the International Precipitation Working Group, and can be found here: http://www.isac.cnr.it/~ipwg/data/datasets1.html. CMAP is another monthly dataset based on a different set of inputs (including satellites and also incorporating some NCEP reanalysis data, http://www.esrl.noaa.gov/psd/data/gridded/data.cmap.html#detail). TRMM 3B43 is another monthly dataset with coverage from 50 N to 50 S with higher spatial resolution.
The uniform spatial grid of this dataset lends itself to comparison with climate models (though, see comments about regridding in GPCP 1dd description). To undertake this endeavor, one could compare climatologies over the same time period, or compare variations in time by examining model integrations forced with prescribed SSTs (AMIP experiments) and historical forcing. Trends can be compared between model experiments with historical forcing over the same period of record.
The most common mistake dealing with all precipitation data arises from its highly variable nature in both space and time. Precipitation datasets with different spatial or temporal coverage are fundamentally different, so care must be taken, for example, comparing the data taken from one station (a point in space) with a GPCP grid-box (which represents an areal average). In order to compare two precipitation datasets on grids with different resolutions, one should typically regrid one or both of the datasets to a common grid, no finer than the coarsest of the datasets being compared, using a regridding method that conserves the total amount of rain falling in an area. Often, the default interpolation in an analysis software package is bilinear interpolation (eg in Matlab), which is not conservative. One conservative regridding method is described in Jones (1999). The NCL language offers two methods to perform conservative regridding: area_conserve_remap or, the more robust, Earth System Modeling Framework (ESMF) regridding. See also the Climate Data Guide's regridding page (https://climatedataguide.ucar.edu/climate-data-tools-and-analysis/regridding-overview).
Some corrections are made to GPCP v 2.2for changes in satellite and gauge dataset inputs over time. Different datasets and algorithms were used, with some periods of inter-calibration to minimize inconsistencies. No corrections were made for OPI’s drift of equator-crossing time (GPCP V2.2 documentation, Huffman and Bolvin 2013, ftp://precip.gsfc.nasa.gov/pub/gpcp-v2.2/doc/V2.2_doc.pdf).
There are many temporal features in the record that users should be aware of. Before and after 1987, the dataset has different inputs and algorithms (Gruber and Levizzani 2008). Microwave precipitation estimates became available in July of 1987. Different gauge products with different sampling are used before and after 1987. Different IR datasets are also used before and after 1987. New satellite data were also incorporated after 1997. See Table 2.2 of Gruber and Levizzani (2008) for a summary of input datasets.
Some known anomalies are also listed in the v2.2 documentation (section 9). These are:
- June 1990-Dec 1991: loss of SSM/I data (Gruber and Levizzani 2008) resulted in the use of a different algorithm
- August 1993-Jan 1994: bias due to a decrease in Meteosat IR images
- Jan 2000, extreme southwestern Greenland: unusually high rainfall estimates due to unusually high gauge rainfall at Nuuk, Greenland.
There are also spatial features in the dataset to be aware of. Satellite data are treated differently in different latitude bands. Equatorward of 40 degrees, SSM/I data are used. When missing, they are replaced with adjusted TOVS data. Between 40 and 70 degrees, a combination of SSM/I and TOVS data with bias adjustment that varies with latitude is used. Poleward of 70 N and S, adjusted TOVS data are used exclusively."##
Expert Developer Guidance
The following was contributed by Jian-Jian Wang (University of Maryland), April, 2020:
The Global Precipitation Climatology Project (GPCP) Monthly Analysis Version 2.3
The key strengths of GPCP v2.3:
1. It provides a consistent analysis of global precipitation from the integration of various satellite data sets of lands and oceans and a gauge analysis over land.
2. It covers an extensive period of satellite era from 1979 to present.
3. It is useful for model validation, regional and global precipitation analysis, climate-scale variations and trends monitoring, and diagnostic studies.
4. Updated cross-calibration procedures have been developed, tested, and applied for correcting the problems from individual input data set.
The limitations of GPCP v2.3:
1. The GridSat data contains residual inter-satellite differences at the boundaries between the areas of coverage of the geo-IR sensors.
2. Although every effort has been made to preserve the homogeneity of the Version 2.3 data record, the regional variances inherent in the OLR Precipitation Index (OPI) data are typically smaller than those encountered in the SSMI data, so the statistical nature of the fields will be different for the pre-SSMI and SSMI.
3. Some polar-orbiting satellites have experienced significant drifting of the equator-crossing time during their period of service. There is no direct effect on the accuracy of the data, but it is possible that the systematic change in sampling time could introduce biases in the resulting precipitation estimates.
4. The current GPCP v2.3 does not include the precipitation estimates from TRMM, GPM, or Cloudsat, which will be used in GPCP V3 (In development).
Expert guidance:
The Global Precipitation Climatology Project (GPCP) has been in existence for over twenty years as part of the Global Energy and Water Cycle Exchanges (GEWEX) activity under the World Climate Research Program (WCRP). The GPCP is made up of an international consortium of researchers and operational scientists from both government and universities who provide data sets, products, and techniques that are used to provide an observation-based, merged analysis of precipitation. The GPCP monthly product blends data from gauges (from the Global Precipitation Climatology Center), precipitation estimates from polar-orbit passive microwave satellites (SSMI, SSMIS) polar orbit IR sounders (TOVS, AIRS) and geostationary infrared satellites (GOES, MeteoSat, GMS, MTSat).
The method of generating the climatological data and its application were initially described by Huffman et al. (1997). Improvements to that original version have been made at intervals over the past years (Adler et al. 2003, Huffman et al. 2009). The present GPCP Version 2.3 analysis is described in Adler et al. 2018 and became available in 2016. The goal of the GPCP dataset is to provide a long time series of monthly precipitation analyses on a global scale. The product is a monthly analysis on a global 2.5° latitude by 2.5° longitude grid for the period 1979–present.
Figure 1 shows an example of the GPCP V2.3 monthly merged final product, in this case for December 2019. The general rainfall patterns for this month are typical for December, the first month of meteorological winter in the Northern Hemisphere and summer in the Southern Hemisphere. For example, the peak rainfall features over Africa and South America are south of the Equator as they follow the sun. Over South Asia dryness dominates as the Asian Monsoon moves south over the Indian Ocean and towards Australia. Over the Pacific and Atlantic Oceans the ITCZ has moved southward also, but still remains above the Equator. The South Pacific Convergence Zone (SPCZ), stretching from the ITCZ east of New Guinea to the southeast and into the middle Pacific, is the most dominant rainfall feature this month. At higher latitudes the maxima at and off the east coasts of Asia and North America show generally higher values over the ocean than in the near-continuous east-west precipitation maximum at about 50°S. Characteristics of the GPCP Monthly analysis and descriptions of means, variations and trends in global precipitation can also be found in Adler et al., (2017).
The GPCP Monthly product is widely used in the scientific community for analysis of regional and global precipitation climatologies and climate-scale variations and trends during the satellite era. It has been utilized in many studies and referenced in thousands of journal papers.
The GPCP Version 2.3 data is archived at NOAA's National Centers for Environmental Information (NCEI). They can be accessed online at:
https://www.ncei.noaa.gov/data/global-precipitation-climatology-project-gpcp-monthly/access/
#
Cite this page
Acknowledgement of any material taken from or knowledge gained from this page is appreciated:
Pendergrass, Angeline &, Wang, Jian-Jian & National Center for Atmospheric Research Staff (Eds). Last modified "The Climate Data Guide: GPCP (Monthly): Global Precipitation Climatology Project.” Retrieved from https://climatedataguide.ucar.edu/climate-data/gpcp-monthly-global-precipitation-climatology-project on 2026-06-27.
Citation of datasets is separate and should be done according to the data providers' instructions. If known to us, data citation instructions are given in the Data Access section, above.
Acknowledgement of the Climate Data Guide project is also appreciated:
Schneider, D. P., C. Deser, J. Fasullo, and K. E. Trenberth, 2013: Climate Data Guide Spurs Discovery and Understanding. Eos Trans. AGU, 94, 121–122, https://doi.org/10.1002/2013eo130001
Key Figures
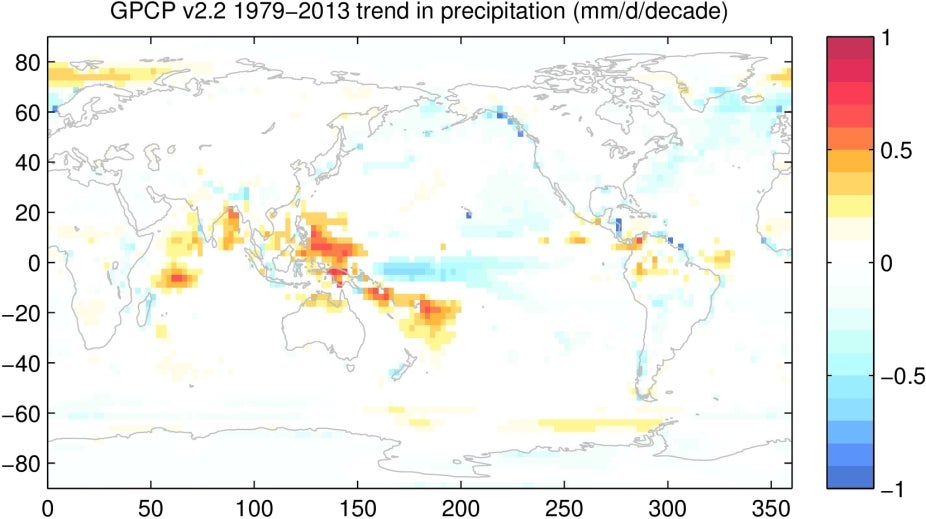
Trend in rainfall from 1979-2013 in GPCP v 2.2. Only trends significantly different from zero at 95% are shown in color. The pattern in the Pacific largely resembles what is expected in response to ENSO, and may be related to decadal variability (Dai 2013). (contributed by A. Pendergrass)
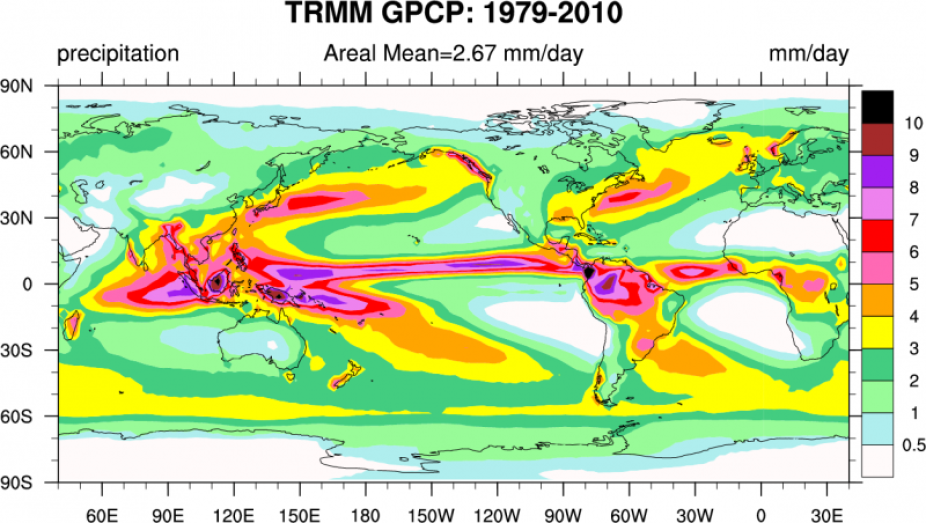
Climatological annual mean precipitation (mm/day) for 1979-2010. The areal mean for the entire grid is 2.67 mm/day. (Climate Data Guide; D. Shea)
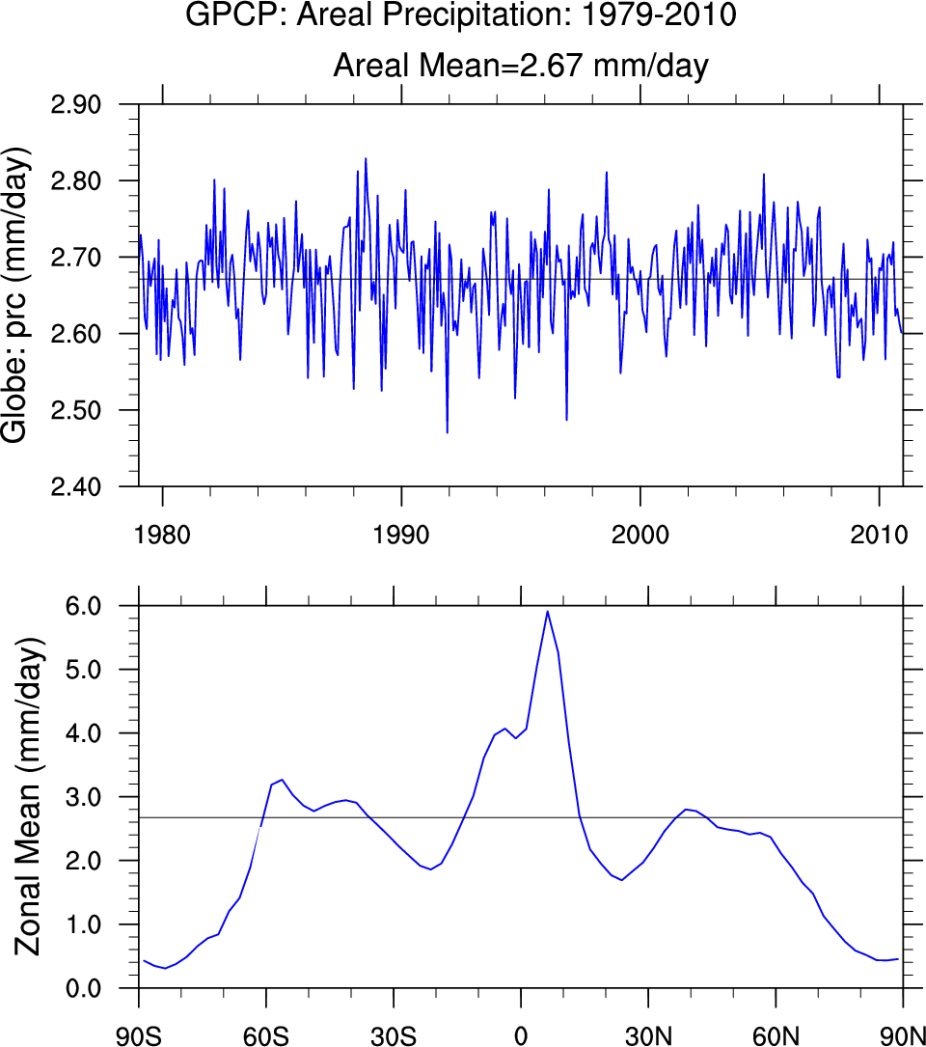
Top: Areal weighted mean of precipitation rate for 1979-2010. Bottom: zonal mean precipitation (mm/day). The thin horizontal line is the climatological long term mean. (Climate Data Guide; D. Shea)
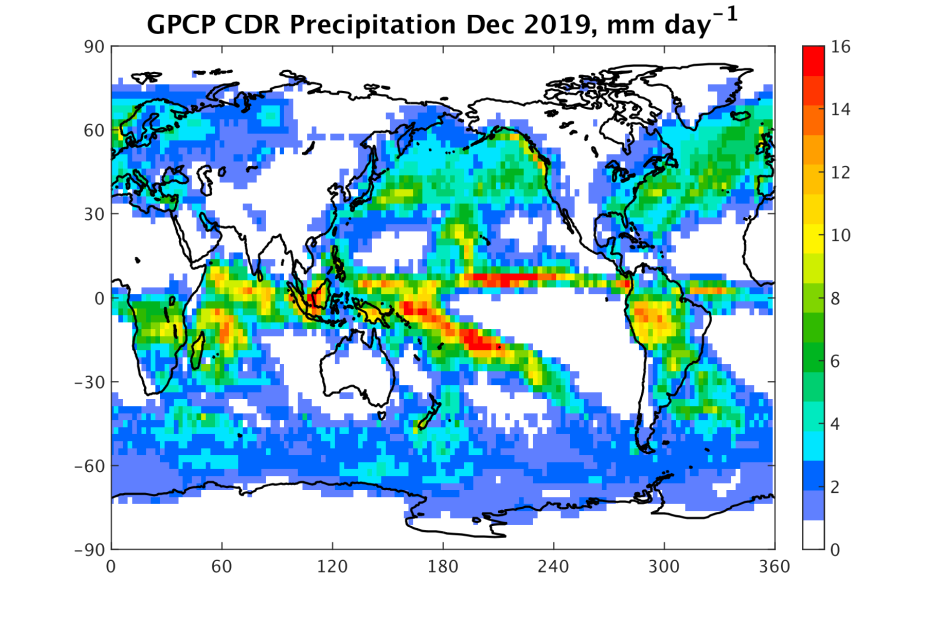
Wang Figure 1: GPCP V2.3 Monthly analysis for December 2019 (contributed by JJ Wang)
Other Information
- Adler, R., and Coauthors, 2018: The Global Precipitation Climatology Project (GPCP) Monthly Analysis (New Version 2.3) and a Review of 2017 Global Precipitation. Atmosphere, 9, 138, https://doi.org/10.3390/atmos9040138.
- Adler, R. F., G. Gu, M. Sapiano, J.-J. Wang, and G. J. Huffman, 2017: Global Precipitation: Means, Variations and Trends During the Satellite Era (1979–2014). Surveys in Geophysics, 38, 679–699, https://doi.org/10.1007/s10712-017-9416-4.
- Adler, R.F., et al, 2003: The Version 2 Global Precipitation Climatology Project (GPCP) Monthly Precipitation Analysis (1979 - Present). J. Hydrometeor., 4(6), 1147-1167.
- Adler, Robert F., Guojun Gu, George J. Huffman, 2012: Estimating Climatological Bias Errors for the Global Precipitation Climatology Project (GPCP). J. Appl. Meteor. Climatol., 51, 84–99
- Allan, RP, C. Liu, M. Zahn, D.A. Lavers, E. Koukouvagias, A. Bodas-Salcedo, 2013: Physically Consistent Responses of the Global Atmospheric Hydrological Cycle in Models and Observations. Surv. Geophys
- Behrangi, A., G. Stephens, R. Adler, G. Huffman, B. Lambrigtsen, and M. Lebsock, 2014a: An update on oceanic precipitation rate and its zonal distribution in light of advanced observations from space. J. Climate.
- Behrangi, A., Y. Tian, B. H. Lambrigtsen, and G. L. Stephens (2014b), What does CloudSat reveal about global land precipitation detection by other spaceborne sensors
- , Water Resour. Res., 50.
- Behrangi, A., M. Lebsock, S. Wong, and B. Lambrigtsen (2012), On the quantification of oceanic rainfall using spaceborne sensors, J. Geophys. Res., 117, D20105
- Bosilovich, M. G., F. R. Robertson, J. Chen, 2011: Global Energy and Water Budgets in MERRA. Journal of Climate. doi:10.1175/2011JCLI4175.1.
- Curtis, et al, 2007: Precipitation Extremes Estimated by GPCP and TRMM: ENSO Relationships. J. Hydrometeor., 8(4), 678-689
- Dai, A. (2013). The influence of the inter-decadal Pacific oscillation on US precipitation during 1923–2010. Climate dynamics, 41(3-4), 633-646.
- Donner et al 2011: The Dynamical Core, Physical Parameterizations, and Basic Simulation Characteristics of the Atmospheric Component AM3 of the GFDL Global Coupled Model CM3. Journal of Climate.
- Frierson, D. M. W. , Y.-T. Hwang, N. S. Fučkar, R. Seager, S. M. Kang, A. Donohoe, E. A. Maroon, X. Liu, D. S. Battisti, 2013: Contribution of ocean overturning circulation to tropical rainfall peak in the Northern Hemisphere. Nature Geoscience.
- Gruber, A., & Levizzani, V. (2008). Assessment of global precipitation products. WCRP-128, WMO Technical Document, 1430, 57. [.pdf]
- Giannini, A., M. Biasutti, I.M. Held, A. H. Sobel, 2008: A global perspective on African climate. Climatic Change. 90, 359–383.
- Giorgetta, M. A. et al, 2013: Climate and carbon cycle changes from 1850 to 2100 in MPI-ESM simulations for the Coupled Model Intercomparison Project phase 5. JAMES, 5, 572–597.
- Huffman, G.J., (1997). Estimates of root-mean-square random error contained in finite sets of estimated precipitation. J. Appl. Meteor., 36, 1191-1201.
- Huffman, G.J. and coauthors (1997). The Global Precipitation Climatology Project (GPCP) Combined Precipitation Dataset. BAMS. 78, 5-20.
- Huffman, G.J., R.F. Adler, D.T Bolvin, G. Gu , 2009: Improving the global precipitation record: GPCP Version 2.1, Geophys. Res. Lett., 36, L17808
- Huffmann, G.J., D.T. Bolvin, 2011: GPCP Version 2.2 Combined Precipitation Data Set Documentation George J. Huffman David T. Bolvin
- Huffman, G.J and Bolvin D.T (2012, last updated 4 March 2013). GPCP Version 2.2 SG Combined Precipitation Data Set Documentation. NASA GSFC. [.pdf]
- Huffman, G.J., D.T. Bolvin, R.F. Adler, 2012, last updated 2012: GPCP Version 2.2 Combined Precipitation Data Set.
- John, V. O., R. P. Allan, B. J. Soden, 2009: How robust are observed and simulated precipitation responses to tropical ocean warming
- GRL, 36, L14702.
- Johnson, N. C. and S.-P. Xie, 2010: Changes in the sea surface temperature threshold for tropical convection. Nature Geoscience.
- Loeb, N., D. Rutan, S. Kato, and W. Wang, 2014: Observing Interannual Variations in Hadley Circulation Atmospheric Diabatic Heating and Circulation Strength. J. Climate.
- Pfeifroth, U., Mueller, R., & Ahrens, B. (2013). Evaluation of satellite-based and reanalysis precipitation data in the tropical Pacific. Journal of Applied Meteorology and Climatology, 52(3), 634-644.
- Schlosser, C.A., and P. Houser (2007): Assessing a satellite-era perspective of the global water cycle, J. Climate, 20, 1316-1338
- Screen, J.A., C. Deser, I. Simmonds, R. Tomas, 2013: Atmospheric impacts of Arctic sea-ice loss, 1979–2009: separating forced change from atmospheric internal variability. Clim Dyn.
- Stephens, G. L., Li, J., Wild, M., Clayson, C. A., Loeb, N., Kato, S., ... & Andrews, T. (2012). An update on Earth's energy balance in light of the latest global observations. Nature Geoscience, 5(10), 691-696.
- Su, H. and J. D. Neelin, 2003: The Scatter in Tropical Average Precipitation Anomalies. Journal of Climate. 16, 3966-3977.
- Trenberth, Kevin E., John T. Fasullo, Jeffrey Kiehl, 2009: Earth's Global Energy Budget. Bull. Amer. Meteor. Soc., 90, 311–323.
- Trenberth, K. E., 2011: Changes in precipitation with climate change. Clim. Res., 47 (1), 123,.
- Trenberth, K. E., and J. T. Fasullo, 2013: Regional energy and water cycles: Transports from ocean to land. J. Climate, 26, 7837-7851.
- Wang, Jian-Jian, Robert F. Adler, George J. Huffman, David Bolvin, 2014: An Updated TRMM Composite Climatology of Tropical Rainfall and Its Validation. J. Climate, 27, 273–284.
- Wentz et al, 2007: How much more rain will global warming bring
- Science 317, 233 (2007)
- Wild, M, D. Folini, C Schär, N. Loeb, E. G. Dutton, G. König-Langlo, 2012: The global energy balance from a surface perspective. Clim Dyn.