Global surface temperatures: BEST: Berkeley Earth Surface Temperatures
The Berkeley Earth Surface Temperatures (BEST) are a set of data products, originally a gridded reconstruction of land surface air temperature records spanning 1701-present, and now including an 1850-present merged land-ocean data set that combines the land analysis with an interpolated version of HadSST3. The land station data are available in an archive, and an experimental version provides daily data for 1880-present. Average (Tavg), minimum (Tmin), and maximum (Tmax) temepratures are provided. The Berkeley Earth project was intended to provide an alternative, independent assessment of global temperature change, separate from the analyses of the USA's NOAA and NASA, and the UK's CRU/Hadley Centre. In contrast to other data sets incorporating records from roughly 5000-7000 land stations, the Berkeley data set incorporates approximately 39,000 records. This is in part due to the use of additional data bases beyond GHCN, and in part to the methodology, which allows short, fragmented timeseries to be incorporated into the statistical model. The Berkeley datasets offer users a lot of flexibility in choosing a product for their needs. In addition to land records available at higher spatial and temporal resolutions than the main reconstruction, two different merged land-ocean datasets are offered. The first version infers air temperatures over sea-ice-covered regions, while the alternative version uses the nearest available SST observations. In the Arctic, the first version shows better agreement with independent estimates of air temperatures (like MERRA2) than does the alternative version.
Key Strengths
Comprehensive dataset with many options; for instance, higher spatial and temporal resolutions are available for certain regions and time periods
Large number of stations used
Long temporal length
Key Limitations
Anomaly fields are highly smoothed due to the homogenization and reconstruction methods, despite being gridded at 1x1 degree. Characteristics of the newer (released 2023), 0.25-degree versions are poorly known.
The homogenization approach may not perform well in areas of rapid local temperature change, leading to overestimates of warming at coastal locations and underestimates at inland locations
The Berkeley algorithm may not detect the seasonally varying biases in temperature readings prior to the introduction of Stephenson screens in the mid 19th century
Expert User Guidance
The following was contributed by Dr. Kevin Cowtan, December 2018:
The Berkeley Earth project provides a set of historical temperature products consisting of estimates of the monthly mean of average, maximum and minimum surface air temperature anomaly over land (Rohde et al., 2013a,b), as well as a pair of blended land-ocean products (Cowtan et al., 2015, supporting information) which provide near global coverage by combining land air temperatures with the HadSST3 sea surface temperature reconstruction (Kennedy et al., 2011a,b). Land temperature data cover the period from 1753 (or 1833 for minimum/maximum temperatures) to the present. The land-ocean reconstructions cover the period from 1850 to the present. Gridded data are provided on a 1 degree latitude/longitude grid. Experimental products are also available at daily resolution and at higher spatial resolution for the USA and Europe.
The distinctive features of the Berkeley land temperature product include:
-
A larger inventory of weather station observations than existing products, comprising of over 30,000 weather stations, although some of the stations not included in existing datasets only provide short spans of data (Rohde et al., 2013a).
-
Automated identification of ‘breakpoints’ in weather station records corresponding to likely changes in station location or equipment, allowing each station record to be broken down into a series of internally homogeneous fragments (Rohde et al., 2013b). Breakpoint detection is similar to a method used in the Global Historical Climatology Network dataset (Menne and Williams, 2009).
-
Reconstruction of a gridded temperature field from the weather station data using a statistical method which incorporates both information about the spatial variability of temperature data and estimates of the reliability of individual weather stations (Rohde et al., 2013b).
- Estimation of local climatology for each station record, allowing the estimation of absolute temperatures as well as temperature anomalies. This enables the use of information from short station records or fragments without the requirement for a significant overlap with either a nearby longer weather station (as in the case of NASA GISTEMP) or a climatology period (as in the case of the Climatic Research Unit CRUTEM) (Hansen et al., 2010; Osborn and Jones, 2014).
The resulting gridded data are spatially complete over land for recent decades, while in the early record temperature estimates are provided for regions which are close enough to a weather station to provide a meaningful local temperature estimate. The homogenization and reconstruction algorithms lead to a temperature field which is spatially smooth, especially in regions of poor station coverage.
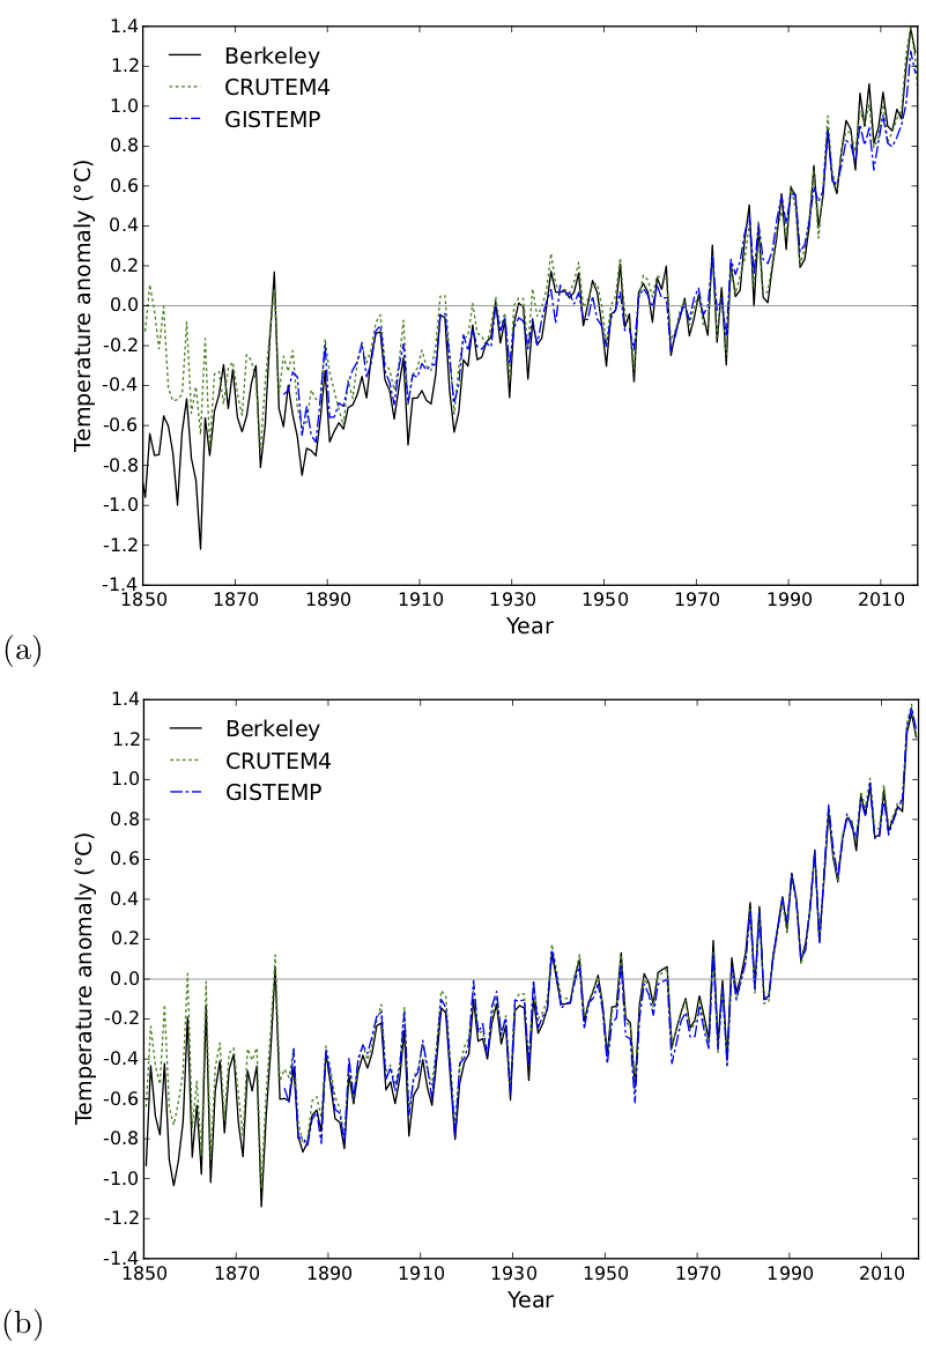
Comparisons of the Berkeley land temperature average to similar products from NASA GISTEMP (Hansen et al., 2010) and the Climatic Research Unit of the University of East Anglia CRUTEM4 (Osborn and Jones, 2014) are shown in figure 1. Figure 1(a) shows a comparison of temperature series from the three providers, and shows large systematic differences over time between the three products, however these differences arise in large part from the different spatial coverage of the products due to different weather station inventories and reconstruction algorithms. Comparison of the temperature average over only the region of common coverage shows much greater consistency between the three datasets. The largest remaining difference arises in the 19th century when the Berkeley reconstruction is cooler than CRUTEM4.
Tests of the Berkeley temperature reconstruction algorithm using synthetic data suggest that it is likely to produce a better estimate of global mean temperature than methods used by other providers, as well as a more detailed reconstruction in regions of higher station density (Rohde, 2013). The greater number of weather stations records than in other products should also contribute to a more reliable result, subject to the downweighting of poor-quality stations performing effectively. The identification of instrumental changes in station records appears to be comparable to the more widely used NOAA alg rithm (Menne and Williams, 2009), at least for the period from 1850, however exposure bias prior to the widespread use of Stephenson screens is likely to impact earlier results (B ̈ohm et al., 2010).
The two Berkeley land-ocean data sets incorporate sea surface temperature (SST) data from the HadSST3 dataset (Kennedy et al., 2011a,b). The sea surface temperature data are infilled using a statistical method which incorporates information about local errors as well as spatial correlation to produce a smoothly varying temperature field. The two versions differ in whether temperature anomalies over sea ice are determined from weather station data (the ‘recommended’ reconstruction) or sea surface temperatures. While the HadSST3 dataset currently incorporates the most extensive analysis of observational biases of current SST products, SSTs are still subject to large systematic biases which vary over time (Kent et al., 2017), so the resulting temperature series will be impacted by uncorrected biases in HadSST3 data (Cowtan et al., 2017; Carella et al., 2018; Davis et al., 2018).
Additional commentary Homogenization of weather station data
Accurate assessment of land air temperature records from weather stations are contingent on the identification and correction of observational biases arising from changes in weather station location, instrumentation or operation practices. Changes in equipment include the introduction of the Stephenson screen in the 19th century and increasing use digital thermometers in recent decades (Menne and Williams, 2009).
The CRUTEM temperature record is largely based on weather station records which have already been corrected for station changes by national weather services, while weather station data from the Global Historical Climatology Network (GHCN) and Berkeley Earth are corrected by automatic algorithms which use both data and metadata to reconcile inconsistencies between nearby stations (Menne and Williams, 2009; Rohde et al., 2013b). Station changes may be identified from metadata, from breaks in the record, or from inconsistencies between a station and its surrounding neighbours.
The GHCN station data are corrected using pairwise homogenization alignment (PHA). The largest difference between the PHA and Berkeley approaches is that in PHA the local station network is used to both identify and correct for weather station changes, and the corrected records are then used in the determination of a gridded temperature reconstruction. In the Berkeley approach the local station network is used to identify station changes, however no correction is calculated at this stage: rather the station record is split into two sub-records. These are then used in the determination of the gridded temperature reconstruction in the same way as records from distinct non-overlapping weather stations.
A comparison of the PHA and Berkeley approaches using synthetic data (Hausfather et al., 2012) suggests that while the PHA method produces better results when no metadata concerning station changes are available, the Berkeley approach may perform better when metadata are available. This may mean that while the PHA algorithm is better at detecting station changes, the Berkeley approach is better at determining the appropriate correction to the temperature observations.
Homogenization of weather station data remains challenging in data sparse periods and regions, and in the presence of rapid local temperature change. Way et al. (2017) found that the Berkeley data show less warming in Canada than a larger archive of station data maintained by the national weather service. Neither the PHA or Berkeley algorithms make use of information about the proximity of a weather station to a coast: coastal regions respond more slowly to climatic changes, and as a result automated homogenization may inflate warming at coastal stations while suppressing it at inland stations in order to reconcile the two sites. The introduction of the Stephenson screen in the mid 19th century reduced the exposure of thermometers to sun and wind, as a result of which earlier records are likely to be biased warm; however since the sign of the bias is seasonally varying it may not be easily detected by the Berkeley algorithm (B ̈ohm et al., 2010; Domonkos and Coll, 2017).
Differences between the two Berkeley land-ocean reconstructions
Berkeley provides two blended land-ocean datasets which provide global coverage for recent decades. The two analyses differ in the way temperatures are determined for sea-ice covered regions: the ‘recommended’ reconstruction infers air temperatures over sea ice from the closest land-based weather stations, while the alternative reconstruction uses the nearest available sea surface temperature observations. The recommended reconstruction shows more warming in the 21st century, with the principal differences arising from the Arctic. A temperature data user must make a choice as to which of these reconstructions is more suitable for their experiment.
For the purposes of estimating air temperatures, the two Berkeley reconstructions can be evaluated on the basis of comparisons to independent measures of surface air temperature. The MERRA2 reanalysis (Gelaro et al., 2017) is a recently developed atmospheric reanalysis spanning 1980 to the present, and is of particular interest since it does not assimilate weather station temperature observations, but does assimilate satellite observations for the whole period. Figure 2 shows per-grid-cell time series correlation between the two Berkeley Earth reconstructions (with land temperatures or SSTs over ice). The land temperature-over-ice reconstruction shows significant correlation into the high Arctic, while SST-over-ice reconstruction shows almost no correlation with MERRA2 for the central Arctic.
Daily variations in Arctic temperature also provide evidence for the use of infilling from land air temperatures for the central Arctic. A key controlling factor in Arctic temperature evolution is melting/freezing with the corresponding transfer of the latent heat of fusion. This plays a key role in the reanalysis, but is absent from historical temperature records because they work with anomalies. This suggests that reanalyses should provide useful independent information concerning Arctic temperature change, and the greater agreement between the reanalysis and the recommended reconstruction supports the use of this reconstruction in the estimation of global surface air temperature change.
The International Arctic Buoy Programme (IABP) provides surface observations of air temperature over sea ice from ice buoys, primarily during the Arctic winter/spring, which are also when the impact of infilling the Arctic is greatest (Rigor et al., 2000). The IABP gridded data are not independent from the Berkeley data due to the inclusion of land stations, however the correlations between the Berkeley land- and SST-based Arctic reconstructions and IABP (Figure 3) provide further support for the use of weather station data to reconstruct temperatures over the Arctic ocean.##
Cite this page
Acknowledgement of any material taken from or knowledge gained from this page is appreciated:
Cowtan, Kevin & National Center for Atmospheric Research Staff (Eds). Last modified "The Climate Data Guide: Global surface temperatures: BEST: Berkeley Earth Surface Temperatures.” Retrieved from https://climatedataguide.ucar.edu/climate-data/global-surface-temperatures-best-berkeley-earth-surface-temperatures on 2026-02-07.
Citation of datasets is separate and should be done according to the data providers' instructions. If known to us, data citation instructions are given in the Data Access section, above.
Acknowledgement of the Climate Data Guide project is also appreciated:
Schneider, D. P., C. Deser, J. Fasullo, and K. E. Trenberth, 2013: Climate Data Guide Spurs Discovery and Understanding. Eos Trans. AGU, 94, 121–122, https://doi.org/10.1002/2013eo130001
Key Figures

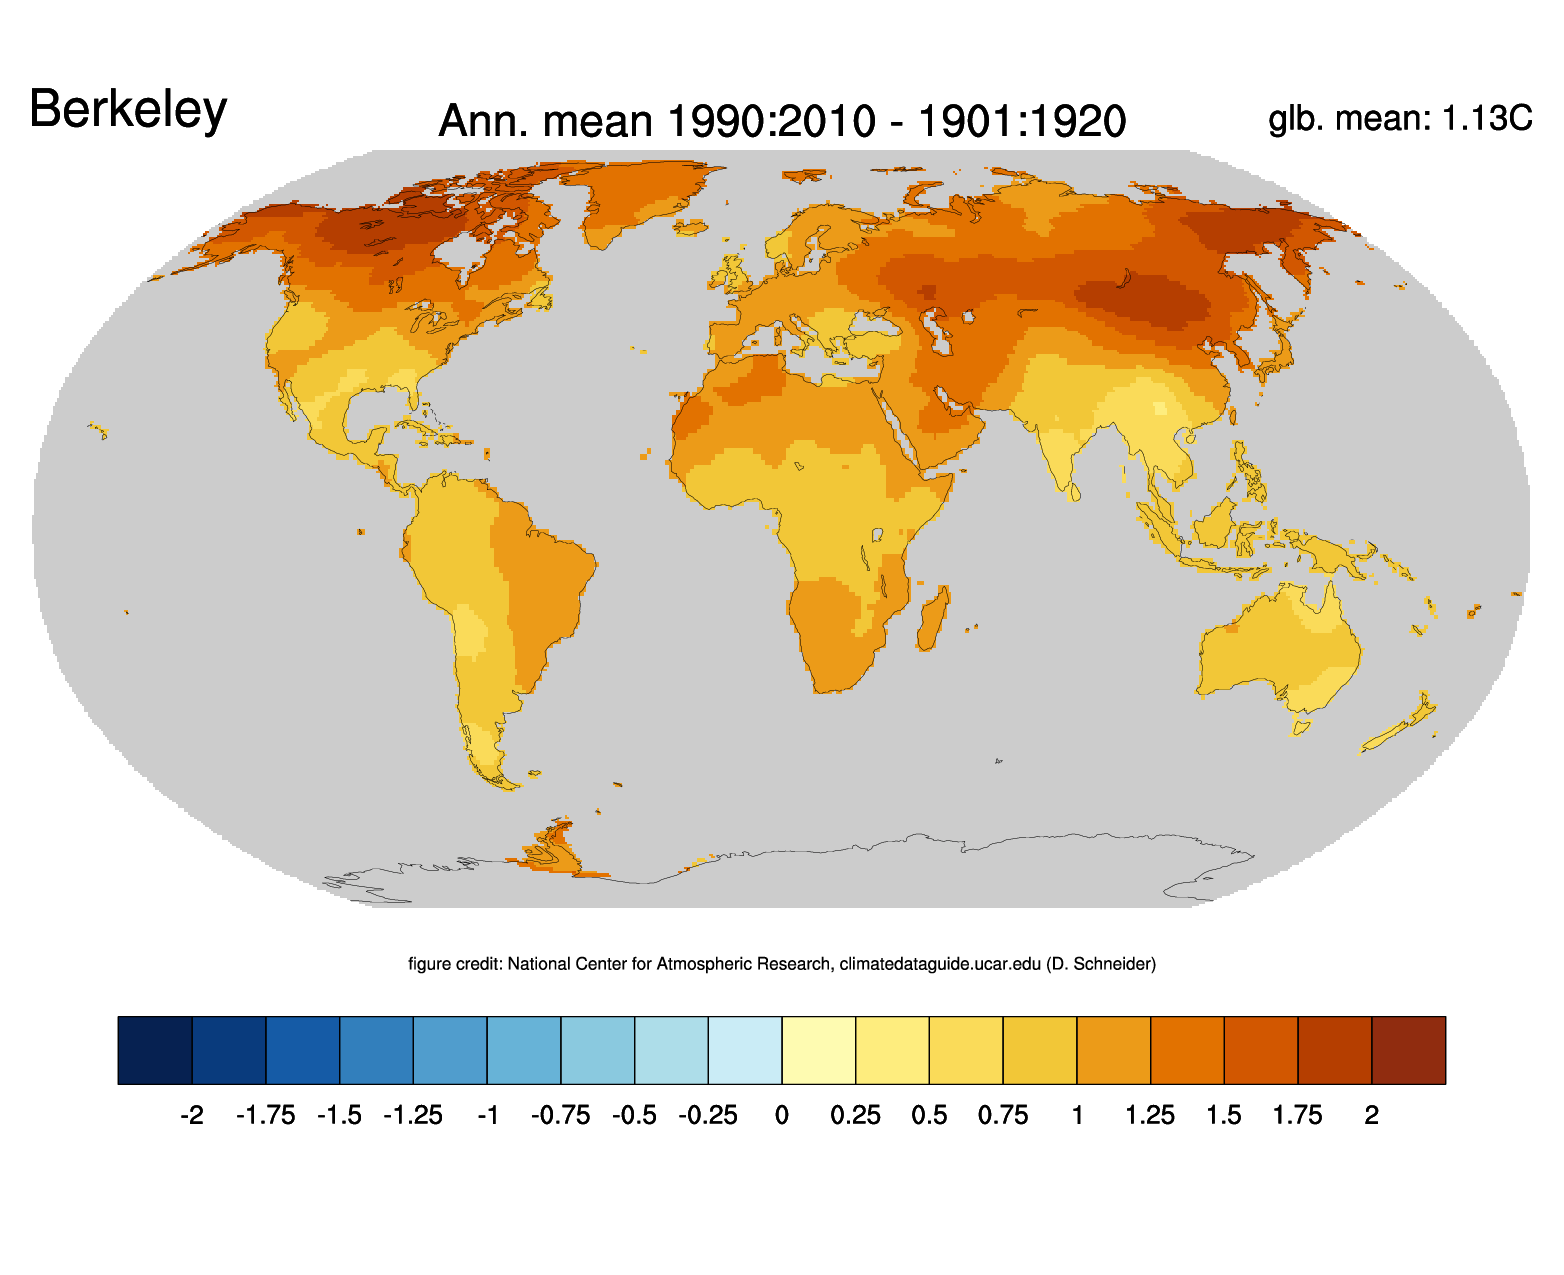
Change of annual mean land temperature between 1901:1920 and 1991:2010 based on the Berkeley Earth dataset. Credit: ClimateDataGuide, NCAR
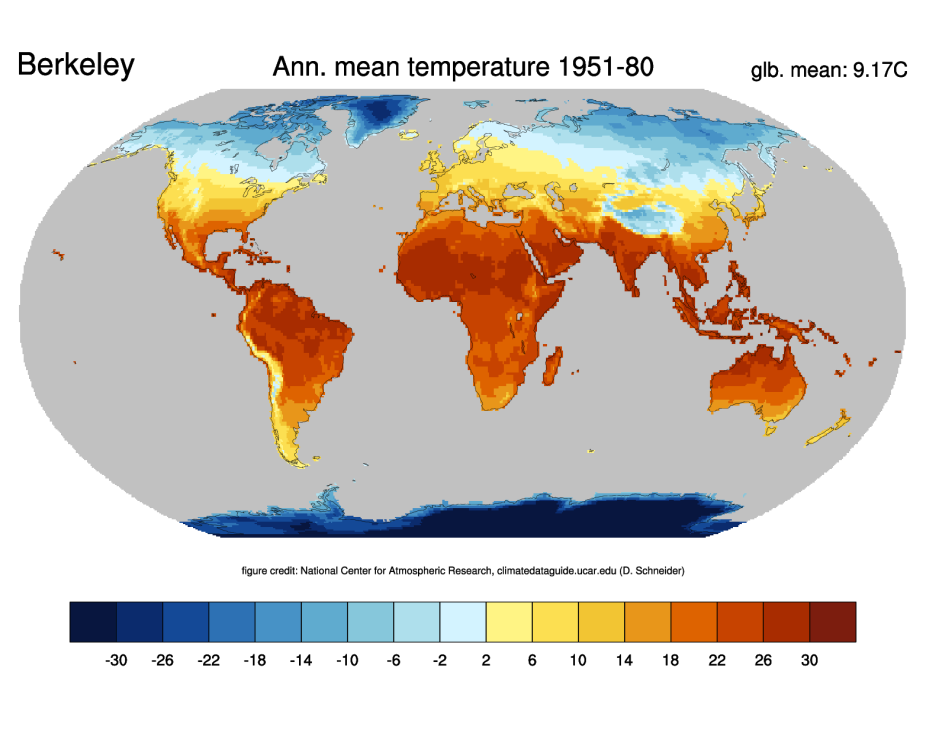
Climatology of annual mean land temperature for 1951-1980 from the Berkeley Earth data. Figure Credit: NCAR, ClimateDataGuide
(contributed by K Cowtan)
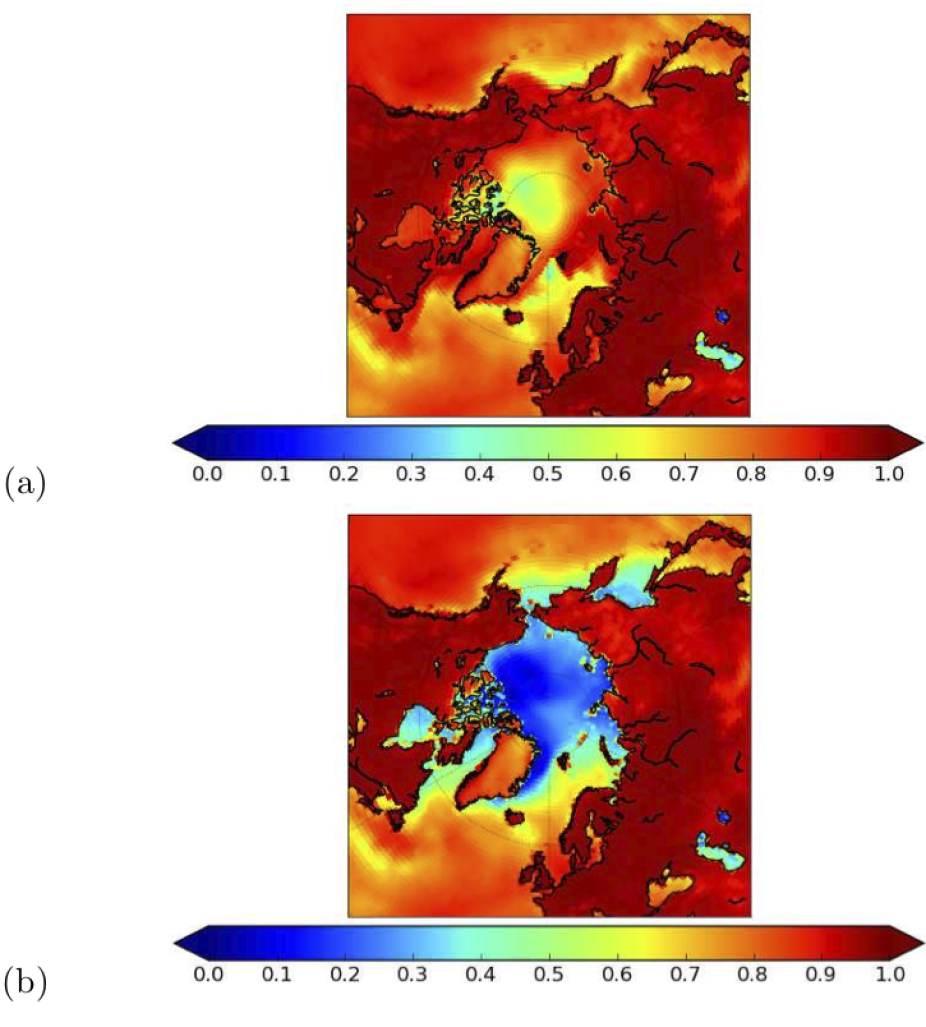
Figure 2: Correlation between the Berkeley Earth blended land-ocean temper- ature products and the MERRA2 reanalysis for the period 1980-2017. The maps show the correlation coefficient over time for each grid cell in the map, with warmer colors indicating higher correlation. Figure 2(a) shows correlations using the recommended product in which weather stations are used to recon- struct air temperatures over ice, while (b) shows the correlations using SSTs to reconstruct air temperatures over ice. The weather station-based reconstruc- tion shows strong correlation with the reanalysis for ice covered regions near to a weather station, and significant correlation even in the center of the Arctic ocean. By contrast the SST-based reconstruction shows very little correlation with the reanalysis for ice-covered ocean.(contributed by K Cowtan)
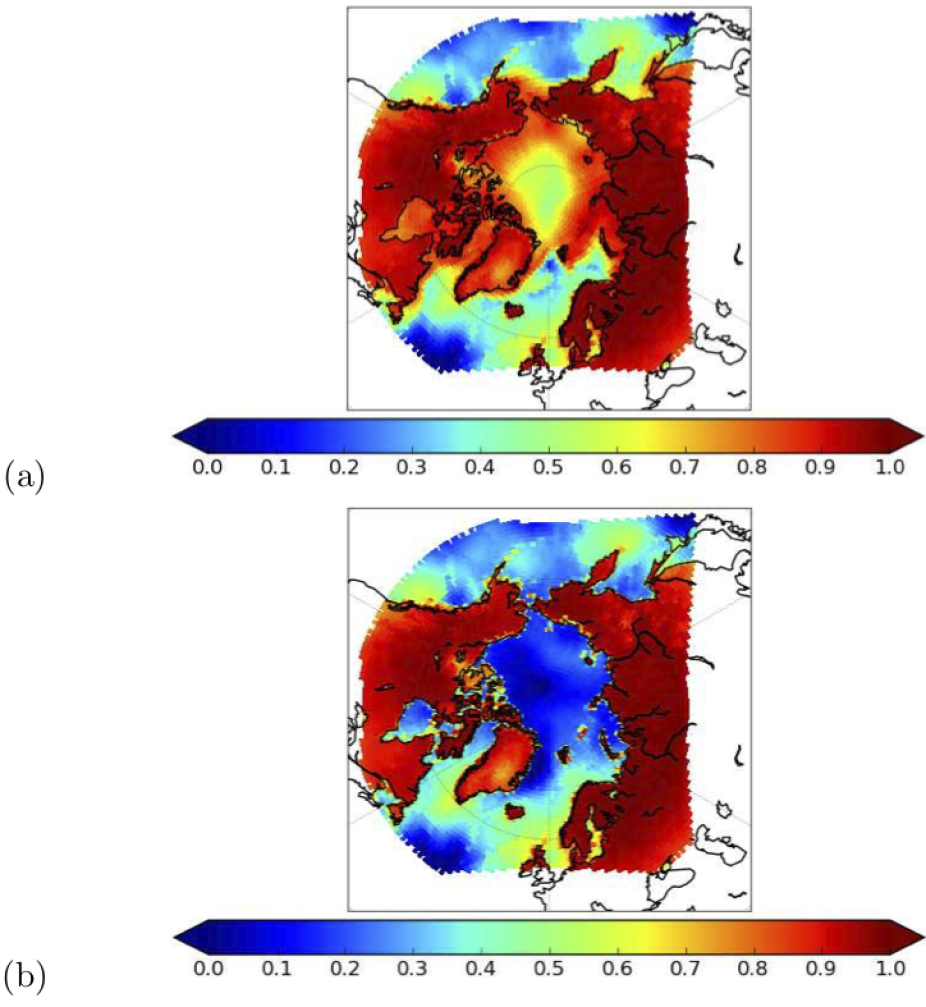
Figure 3: As figure 2, but showing correlation between the Berkeley Earth blended land-ocean temperature products and the temperature data from the International Arctic Buoy Program for the period 1980-2004. Figure 3(a) shows correlations using the recommended product in which weather stations are used to reconstruct air temperatures over ice, while (b) shows the correlations us- ing SSTs to reconstruct air temperatures over ice. The weather station-based reconstruction again shows greater skill for ice-covered ocean.(contributed by K Cowtan)