Climate data guide content with tag Minimum Air Temperature
 CRU TS Gridded precipitation and other meteorological variables since 1901
Years of record
- to
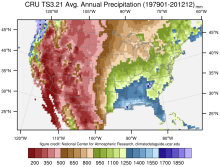
The CRU TS series of data sets (CRU TS = Climatic Research Unit Time series) contain gridded monthly fields of precipitation, daily maximum and minimum temperatures, cloud cover, and other variables covering Earth's land areas for 1901-2022 (CRU TS4.0 is the recent major release). The data set is gridded to 0.5x0.5 degree resolution, based on analysis of over 4000…
Main variables and Earth System components
Atmosphere Air Temperature Cloud Properties Maximum Air Temperature Minimum Air Temperature Potential Evapotranspiration PrecipitationExperts contributing reviews
- N/A
 Daymet: Daily Surface Weather and Climatological Summaries
Years of record
- to
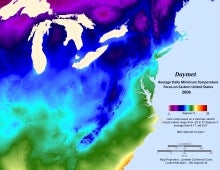
Daymet provides long-term, continuous, gridded estimates of daily weather and climatology variables by interpolating and extrapolating ground-based observations through statistical modeling techniques. The Daymet data products provide driver data for biogeochemical terrestrial modeling and have myriad applications in many Earth science, natural resource, biodiversity,…
Main variables and Earth System components
Atmosphere Maximum Air Temperature Minimum Air Temperature Precipitation Radiation Water Vapor Cryosphere Snow Water Equivalent-
Timestep
- Climatology, Daily
-
Domain
- North America
-
Collections
- N/A
Experts contributing reviews
- Thornton, Peter E
 E-OBS: High-resolution gridded mean/max/min temperature, precipitation and sea level pressure for Europe & Northern Africa
Years of record
- to
E-OBS is a high spatial resolution daily gridded data that covers the European region and is based on the station data collated by the ECA&D initiative (Klein Tank et al., 2002). These data are supplied by many European National Meteorological Services and other data providers across Europe and the Middle East. The dataset spans the period 1 January 1950 to the…
Main variables and Earth System components
Atmosphere Air Temperature Maximum Air Temperature Minimum Air Temperature Precipitation Sea Level PressureExperts contributing reviews
- van der Schrier, Gerard
 GHCN-D: Global Historical climatology Network daily temperatures
Years of record
- to
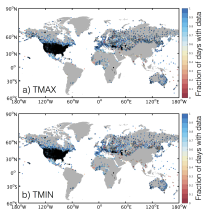
The Global Historical Climatology Network Daily database, GHCN-D, contains meteorological measurements from over 90,000 stations across the globe. The majority of station records contain precipitation data only, however other key variables including maximum temperature, minimum temperature, snowfall, cloudiness, wind speed and snow depth are available at many…
Main variables and Earth System components
Atmosphere Maximum Air Temperature Minimum Air Temperature PrecipitationExperts contributing reviews
- McKinnon, Karen
 GHCNDEX: Gridded Temperature and Precipitation Climate Extremes Indices (CLIMDEX data)
Years of record
- to
GHCNDEX provides gridded, station-based indices of temperature- and precipitation- related climate extremes. It is intended for detection and attribution studies, climate model evaluation, and operational monitoring of extreme climatic events. Twenty-six indices, including daily maximum and minimum temperatures, number of frost days, maximum 1-day precipitation, and…
Main variables and Earth System components
Atmosphere Maximum Air Temperature Minimum Air Temperature Land Freeze/ThawExperts contributing reviews
- N/A
 Global surface temperatures: BEST: Berkeley Earth Surface Temperatures
Years of record
- to
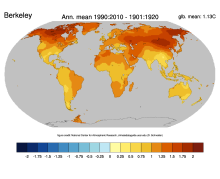
The Berkeley Earth Surface Temperatures (BEST) are a set of data products, originally a gridded reconstruction of land surface air temperature records spanning 1701-present, and now including an 1850-present merged land-ocean data set that combines the land analysis with an interpolated version of HadSST3. The land station data are available in an archive, and…
Main variables and Earth System components
Atmosphere Air Temperature Maximum Air Temperature Minimum Air Temperature Ocean SST - sea surface temperatureExperts contributing reviews
- Cowtan, Kevin
 HadEX2: Gridded Temperature and Precipitation Climate Extremes Indices (CLIMDEX data)
Years of record
- to
Note: HadEX2 has been superseded by HadEX3. HadEX2 provides gridded, station-based indices of temperature- and precipitation- related climate extremes. It is intended for detection and attribution studies and climate model evaluation. Twenty-nine indices, including daily maximum and minimum temperatures, number of frost days, maximum 1-day precipitation, and growing…
Main variables and Earth System components
Atmosphere Maximum Air Temperature Minimum Air Temperature Land Freeze/ThawExperts contributing reviews
- N/A
 HadEX3: Gridded Temperature and Precipitation Climate Extremes Indices (CLIMDEX data)
Years of record
- to
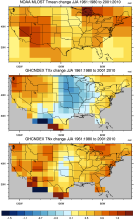
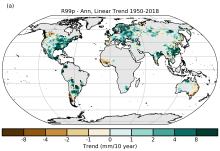
HadEX3 provides gridded, station-based indices of temperature- and precipitation- related climate extremes and supersedes HadEX2. It is intended for global and continental climate monitoring, detection and attribution studies and climate model evaluation. Twenty-nine indices, including daily maximum and minimum temperatures, number of frost days, maximum 1-day…
Main variables and Earth System components
Atmosphere Air Temperature at 2m Maximum Air Temperature Minimum Air Temperature Land Freeze/ThawExperts contributing reviews
- Dunn, Robert
 HadGHCNDEX - Gridded Daily Temperature Extremes
Years of record
- to
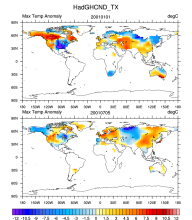
HadGHCND (aka HadGHCNDEX) is a gridded daily dataset of near-surface maximum (TX) and minimum (TN) temperature observations. Anomalies (departures from 1961-1990 climatology) and actual temperatures are distributed in two separate files. The dataset is designed primarily for the analysis of climate extremes and also for climate model evaluation. It spans the years 1950…
Main variables and Earth System components
Atmosphere Maximum Air Temperature Minimum Air TemperatureExperts contributing reviews
- N/A
 Livneh gridded precipitation and other meteorological variables for continental US, Mexico and southern Canada
Years of record
- to
The Livneh et al. (2015) hydrometeorological dataset consists of gridded daily and monthly precipitation, maximum and minimum air temperature, and wind speed for the continental US, southern Canada, and Mexico for the period 1950-2013. Gridded at 1/16° horizontal resolution (~ 6km), the data have been used as training data for GCM downscaling, as validation for…
Main variables and Earth System components
Atmosphere Maximum Air Temperature Minimum Air Temperature Precipitation Wind-
Formats
- netCDF
-
Timestep
- Daily, Monthly
-
Domain
- North America
-
Collections
- N/A
Experts contributing reviews
- Livneh, Ben
 NOAA ThreadEx Long-term Station Extremes for America
Years of record
- to
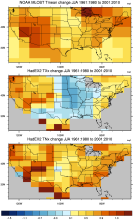
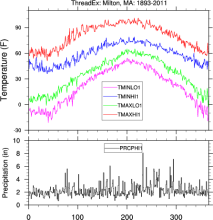
ThreadEx is a data set of extreme daily temperature and precipitation values for 270 locations in the United States. For each day of the year at each station, ThreadEx provides the top 3 record high and low daily maximum temperatures, the top 3 record high and low daily minimum temperatures, the top 3 daily precipitation totals, along with the years the records were set…
Main variables and Earth System components
Atmosphere Air Temperature Maximum Air Temperature Minimum Air Temperature Precipitation-
Formats
- ascii
-
Timestep
- Daily
-
Domain
- North America
-
Collections
- N/A
Experts contributing reviews
- N/A
 PRISM High-Resolution Spatial Climate Data for the United States: Max/min temp, dewpoint, precipitation
Years of record
- to
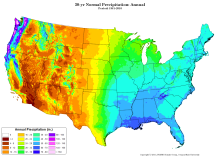
PRISM is a set of monthly, yearly, and single-event gridded data products of mean temperature and precipitation, max/min temperatures, and dewpoints, primarily for the United States. In-situ point measurements are ingested into the PRISM (Parameter elevation Regression on Independent Slopes Model) statistical mapping system. The PRISM products use a weighted regression…
Main variables and Earth System components
Atmosphere Dew Point Temperature Maximum Air Temperature Minimum Air Temperature Precipitation-
Formats
- ARC/INFO ASCII GRID, netCDF
-
Timestep
- Climatology, Daily, Monthly
-
Domain
- North America
-
Collections
- N/A
Experts contributing reviews
- Daly, Christopher
 TerraClimate: Global, high-resolution gridded temperature, precipitation, and other water balance variables
Years of record
- to
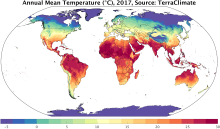
TerraClimate is a global gridded dataset of meteorological and water balance variables for 1958-present, available on a monthly timestep. Its relatively fine spatial resolution, global extent, and long length are a unique combination that fills a void in climate data. TerraClimate combines spatial climatology from WorldClim with time-varying information from the…
Main variables and Earth System components
Atmosphere Air Temperature Maximum Air Temperature Minimum Air Temperature Potential Evapotranspiration Precipitation Wind Snow Water Equivalent Land evapotranspiration Runoff and Streamflow Soil MoistureExperts contributing reviews
- Abatzoglou, John
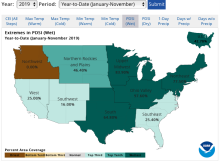 U.S. Climate Extremes Index (CEI)
Years of record
- to
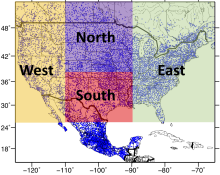
The U.S. Climate Extremes Index (CEI) was first presented in 1995 as a framework for quantifying observed changes in climate within the contiguous United States. At present, the CEI evaluates the percent area of extremes in the distribution of much above/below average (top/bottom 10% of occurrence) temperatures, precipitation, drought, and tropical cyclone wind…
Main variables and Earth System components
Atmosphere Air Temperature Maximum Air Temperature Minimum Air Temperature Precipitation Wind Land Drought-
Formats
- ascii
-
Timestep
- Monthly, Seasonal, Annual
-
Domain
- North America
-
Collections
- N/A
Experts contributing reviews
- Gleason, Karin