Global (land) precipitation and temperature: Willmott & Matsuura, University of Delaware
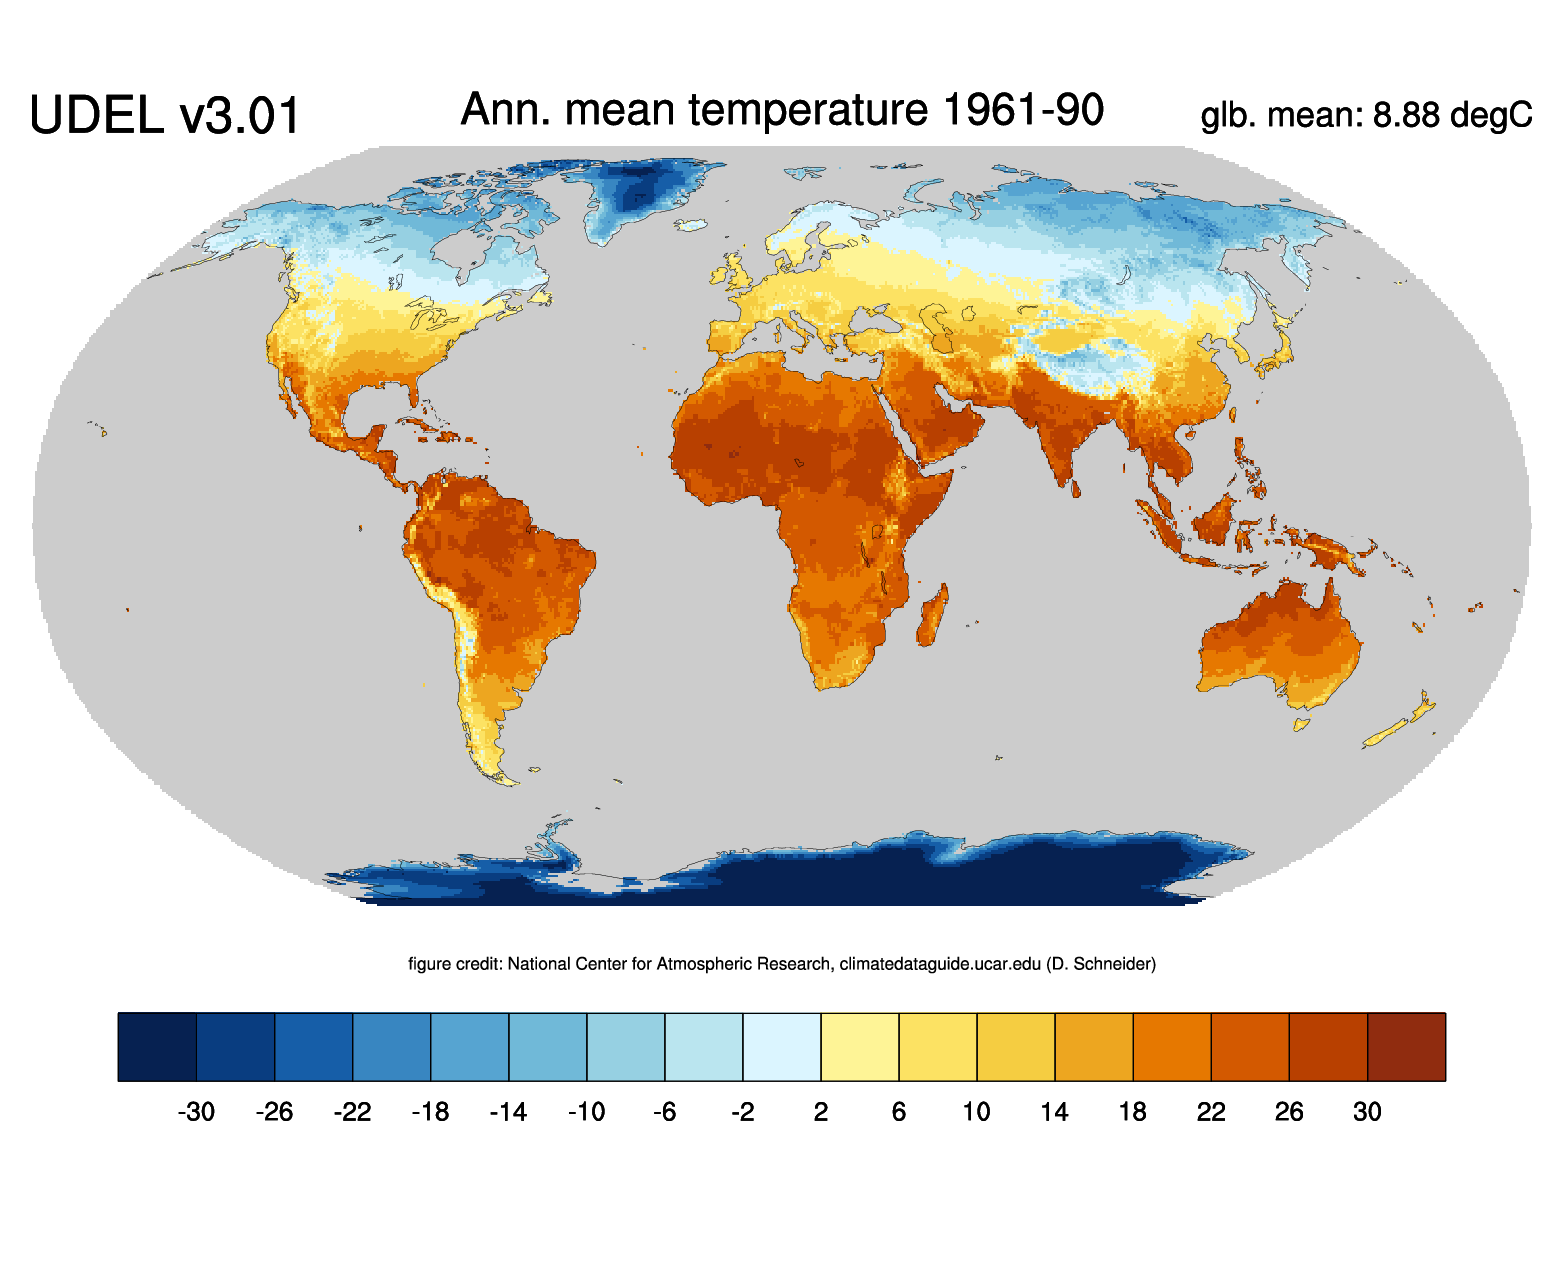
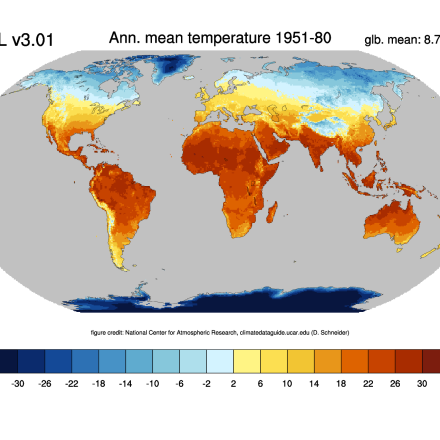
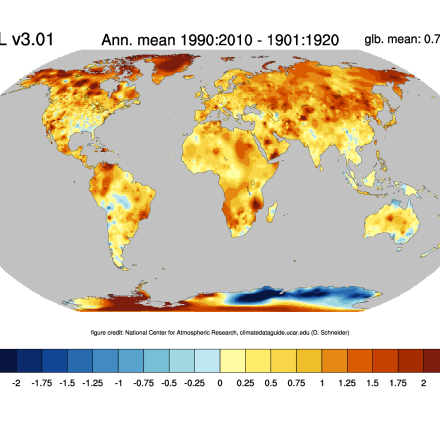
A series of gridded temperature and precipitation data sets. Station records that served as bases for the Terrestrial Air Temperature: 1900-2014 Gridded Monthly Time Series (Version 4.01) and Terrestrial Precipitation: 1900-2014 Gridded Monthly Time Series (Version 4.01) archives are used here to help create new gridded climatologies of monthly and annual average air temperature (T) and total precipitation (P). These two sets of station time series were drawn primarily from recent versions of the Global Historical Climatology Network (GHCN version 2) and the Global Surface Summary of Day (GSOD) archive. Selected averages from Legates and Willmott’s (1990a and b) long-term station averages of monthly and annual T and P also were used to help produce this new gridded archive. Users should be aware that each value of precipitation or temperature is a local grid-point estimate, not grid-cell average or raster data. Also, the precipitation data are not corrected for rain-gauge undercatch, and the accuracy of the gridded fields depends on the station density. For more information, please read the "Expert Guidance."
Key Strengths
Provides a relatively detailed global land surface temperature and precipitation climatology, as well as timeseries
Higher spatial resolution than comparable data sets
Each of the gridded monthly values of P and T is a local point estimate at a 0.5-degree of longitude-latitude resolution, which, when compared to grid-cell average data, tends to more accurately represent spatial variability.
Key Limitations
Interpolation accuracy depends on the spatial coverage of the station data
Precipitation is constructed from the raw station data - no corrections for rain gauge undercatch
Infrequent updates
Expert Developer Guidance
The following was contributed by Kenji Matsuura, University of Delaware, September, 2017:
Key Strengths:
- Each of our gridded monthly values of P and T is a local point estimate at a 0.5-degree of longitude-latitude resolution. The meanings of our gridded P and T values, therefore, do not vary with latitude. Within gridded data sets that contain grid-cell-average estimates of monthly P or T, the grid-cell areas and, therefore, the area-averages of P or T and their interpretations vary with latitude. Spatial analyses of grid-cell-average estimates of monthly P or T also will underestimate the spatial variability within P or T.
- Our global maps are based on an equal-area map projection. This allows meaningful comparisons of a climate variable among areas.
- Our spatial interpolations are all spherically based and therefore do not contain map-projection biases that are all-too-common within packaged spatial-analysis software. Our interpolators have been refined over the years with additional independent variables (in addition to latitude and longitude) such as elevation (e.g., Willmott and Matsuura, 1995) and climatological fields (e.g., Willmott et al., 1995) and these have improved the accuracy of our interpolated P and T fields.
Key Limitations:
- Interpolation accuracy heavily depends on the spatial coverage of the station-records networks.
- Our precipitation records are derived from "raw" precipitation observation. They were not corrected to mitigate raingage under-catch bias. This bias can be nontrivial.
Expert Guidance:
Most of the gridded climate fields produced by my colleagues and myself at the University of Delaware were not developed for a specific purpose. Our hope is that they will be helpful in a wide array of applications. We note, however, that they have been used for large-scale numerical climate-model validations as well as in economic applications. Users should note that our gridded estimates are point estimates, even though some users have treated our data as raster (grid-cell-average) data. Our data files are available at http://climate.geog.udel.edu/~climate.
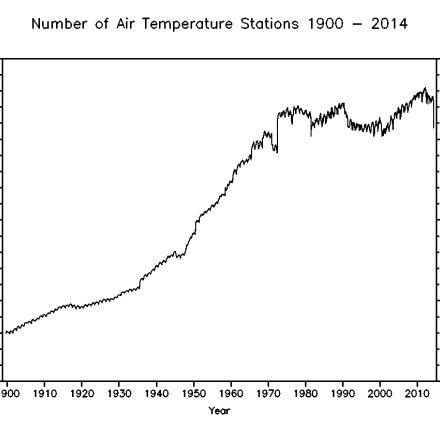
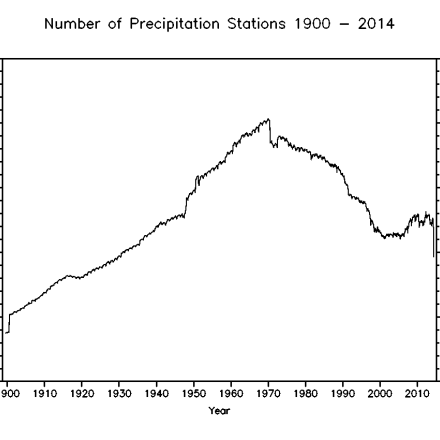
Like most previous versions of our gridded climate data sets, this data set (Version 4.01) provides point estimates of monthly average air temperature (T, oC) and monthly total precipitation (P, mm) across Earth’s land surfaces at the nodes of a 0.5o by 0.5o grid. The time-period covered in Version 4.01 is from 1900 through 2014. The gridded estimates are based primarily on observation-station records that were compiled, for the most part, from several publicly available sources such as the Global Historical Climatology Network dataset (GHCN2) (Peterson and Vose, 1997), the Global Historical Climatology Network Monthly (GHCNM) Version 3 (GHCN3) dataset (Lawrimore et al., 2011), the Daily Global Historical Climatology Network (GHCN-Daily) archive (Menne et al., 2012), and the Global Surface Summary of Day (GSOD). A small number of station records, obtained through personal communication, are also included (see the attached graphs of the overall number of available T and P station records each year).
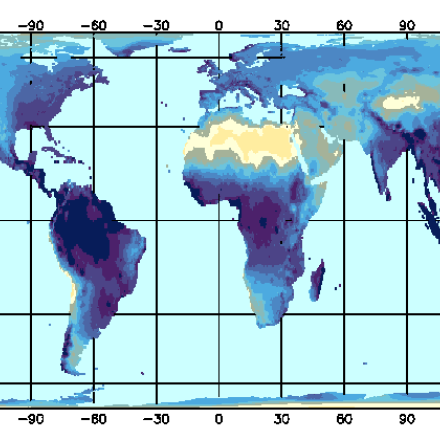
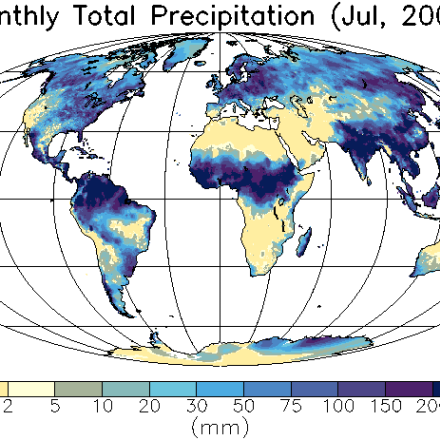
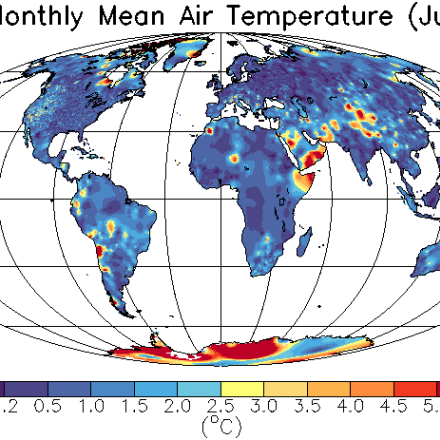
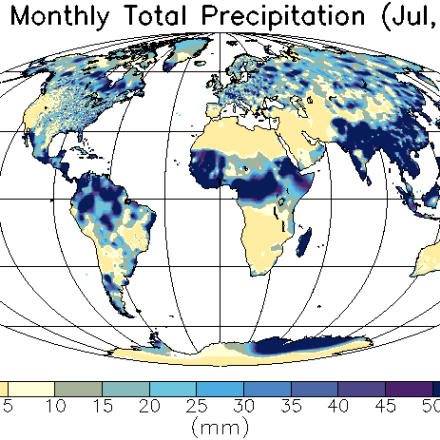
Shepard’s (1968) spatial-interpolation algorithm, modified for use over Earth’s near-spherical surface (Willmott et al., 1985), was employed to interpolate station records to each grid node. Additional geographic information [including a Digital Elevation Model (DEM), climatological information (T and P climatologies), and an average near-surface atmospheric lapse rate for T (6.0oC/Km)] also informed our interpolations. Incorporating a DEM and an average air-temperature lapse rate into spatial interpolations of T improves the accuracy of the gridded T estimates (Willmott and Matsuura, 1995). Using relatively high-resolution station climatologies as background fields also can increase the accuracy of spatially interpolated T and P fields (cf, Willmott and Robeson, 1995). Our gridded monthly T and P time series are updated periodically, usually on the order of every other year. Maps of our estimated monthly T and P fields (for July 2000) are included within this document to illustrate.
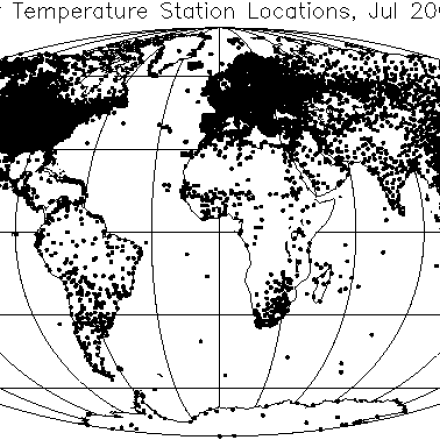
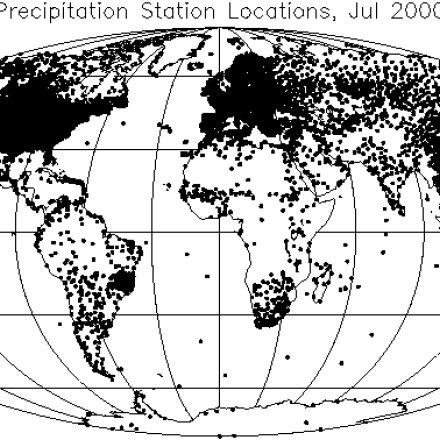
Despite improvements in our spatial interpolators, interpolation accuracy also depends heavily on the spatial coverage of the station-records networks. In general, the closer a grid node is to observation stations, the more accurate the estimated (interpolated) value at that grid node is likely to be. Historical station-record distributions over Earth’s land surface, however, tend to be quite uneven and vary greatly with time; thus, interpolating monthly T and P values in areas with sparse station networks tends to be error prone. Early in the 20th century, for example, station networks were sparse over many regions across the globe. Even during the recent past, for portions of Africa, South America, central Asia and elsewhere, station networks were somewhat sparse (see the attached maps of available T and P station locations for July of 2000). For some regions, it also is true that, while measurements may have been taken, the data remain unavailable. Within such data-sparse regions, our estimated climate fields tend to devolve toward our background climatologies, a characteristic of the Willmott and Robeson (1995) interpolation method. Also, an estimated climatology field itself may be less representative under sparse-station-data circumstances.
It should be noted that some of our station records are composite records. Observational records of stations within 2.5km of one another were merged to create a composite station time series at the geographic centroid of those stations. This was done because the formats of stations’ geographic coordinates, within different archives, were often dissimilar making it difficult to identify the same station within different data archives. Creating composite records also made it possible to better utilize short-period station records, helping improve our overall spatial station coverage. Occasionally, however, this created a “kink” in a composite station-record time series because a piece of a nearby station record may have been erroneously merged. One important note about our precipitation records is that they were derived from “raw” precipitation observations; that is, they were not “corrected” to mitigate raingage under-catch bias. Under-catch bias can be nontrivial and very difficult to estimate adequately, especially over extensive areas (cf, Legates and Willmott, 1990).
Station-by-station cross validation was employed to estimate roughly the spatial-interpolation errors. One monthly T (or P) station value was removed at a time, and it was then spatially interpolated from the surrounding nearby T (or P) station values. The difference between the real station value and the interpolated value is a local estimate of interpolation error. After each station cross validation was made, the removed station value was put back into the network. To visualize the patterns of our spatially cross-validated error estimates, absolute values of the errors at the stations were interpolated to the same spatial resolution as the estimated T or P field. Maps of the interpolated cross-validation T and P error fields for July of 2000 are included here to illustrate. ##
Cite this page
Acknowledgement of any material taken from or knowledge gained from this page is appreciated:
Matsuura, Kenji & National Center for Atmospheric Research Staff (Eds). Last modified "The Climate Data Guide: Global (land) precipitation and temperature: Willmott & Matsuura, University of Delaware.” Retrieved from https://climatedataguide.ucar.edu/climate-data/global-land-precipitation-and-temperature-willmott-matsuura-university-delaware on 2026-02-07.
Citation of datasets is separate and should be done according to the data providers' instructions. If known to us, data citation instructions are given in the Data Access section, above.
Acknowledgement of the Climate Data Guide project is also appreciated:
Schneider, D. P., C. Deser, J. Fasullo, and K. E. Trenberth, 2013: Climate Data Guide Spurs Discovery and Understanding. Eos Trans. AGU, 94, 121–122, https://doi.org/10.1002/2013eo130001
