HadEX3: Gridded Temperature and Precipitation Climate Extremes Indices (CLIMDEX data)

HadEX3 provides gridded, station-based indices of temperature- and precipitation- related climate extremes and supersedes HadEX2. It is intended for global and continental climate monitoring, detection and attribution studies and climate model evaluation. Twenty-nine indices, including daily maximum and minimum temperatures, number of frost days, maximum 1-day precipitation, and growing season length are provided for 1901 to 2018 at monthly and/or annual timesteps on a 1.25° latitude x 1.875 ° longitude grid. Definitions of these core indices follow recommendations set forth by the CCl/CLIVAR/JCOMM Expert Team on Climate Change Detection and Indices (ETCCDI). Input data are from approximately 7000 temperature and 17000 precipitation observing stations distributed worldwide, and collected from a wide variety of sources including public-facing databases, individual providers and international workshops. The indices are computed for each station, and then the indices are gridded using an angular distance weighting scheme. Compared with the precipitation-based indices, the temperature-based indices generally show larger spatial coherence and large-scale averages that are more robust to sampling gaps.
Key Strengths
Large number of indices provided calculated with standard, intuitive definitions of extremes
Widest global coverage of the "extremes" datasets, incorporating stations from Europe, southeast Asia, Latin America and Africa, in addition to GHCN-Daily
More quality control and homogenization of stations performed than for GHCNDEX
Key Limitations
Not routinely updated
Underlying station data not as accessible as the GHCN-Daily stations
Expert Developer Guidance
The following was submitted by Robert Dunn, May, 2023:
HadEX3 provides gridded, station-based indices of temperature- and precipitation- related climate extremes and supersedes HadEX2. It is intended for global and continental climate monitoring, detection and attribution studies and climate model evaluation. Twenty-nine indices, including daily maximum and minimum temperatures, number of frost days, maximum 1-day precipitation, and growing season length are provided for 1901 to 2018 at monthly and/or annual timesteps on a 1.25° latitude x 1.875 ° longitude grid. Definitions of these core indices follow recommendations set forth by the CCl/CLIVAR/JCOMM Expert Team on Climate Change Detection and Indices (ETCCDI). Input data are from approximately 7000 temperature and 17000 precipitation observing stations distributed worldwide, and collected from a wide variety of sources including public-facing databases, individual providers and international workshops. The indices are computed for each station, and then the indices are gridded using an angular distance weighting scheme. Compared with the precipitation-based indices, the temperature-based indices generally show larger spatial coherence and large-scale averages that are more robust to sampling gaps.
For the temperature indices which use a percentile-based threshold determined over a reference period (e.g. warm days, cold nights), these are available using both 1961-90 and 1981-2010 reference periods as intercomparison is non-trivial.
The underlying station network to HadEX3 is not static, and the spatial coverage changes over time, with the highest coverage between around 1960 and 2010. Changes to the station network can also result in discontinuities in the temporal behaviour in some parts of the world, where when stations are no longer reporting, interpolation occurs from further afield. Hence HadEX3 is best suited to the study of global and continental scale changes in extremes, and greater care needs be taken on regional and local scales.
Comparisons against contemporary reanalysis products show good temporal agreement on global scales with the most advanced reanalyses (ERA5, MERRA2), especially for the temperature-based indices. However, there are differences at a more local level, especially in regions with complex topography or where interpolation has been performed across climatic zones. Precipitation indices show lower levels of temporal and spatial agreement, also arising from the more heterogenous nature of this ECV.
Cite this page
Acknowledgement of any material taken from or knowledge gained from this page is appreciated:
Dunn, Robert & National Center for Atmospheric Research Staff (Eds). Last modified "The Climate Data Guide: HadEX3: Gridded Temperature and Precipitation Climate Extremes Indices (CLIMDEX data).” Retrieved from https://climatedataguide.ucar.edu/climate-data/hadex3-gridded-temperature-and-precipitation-climate-extremes-indices-climdex-data on 2026-07-16.
Citation of datasets is separate and should be done according to the data providers' instructions. If known to us, data citation instructions are given in the Data Access section, above.
Acknowledgement of the Climate Data Guide project is also appreciated:
Schneider, D. P., C. Deser, J. Fasullo, and K. E. Trenberth, 2013: Climate Data Guide Spurs Discovery and Understanding. Eos Trans. AGU, 94, 121–122, https://doi.org/10.1002/2013eo130001
Key Figures
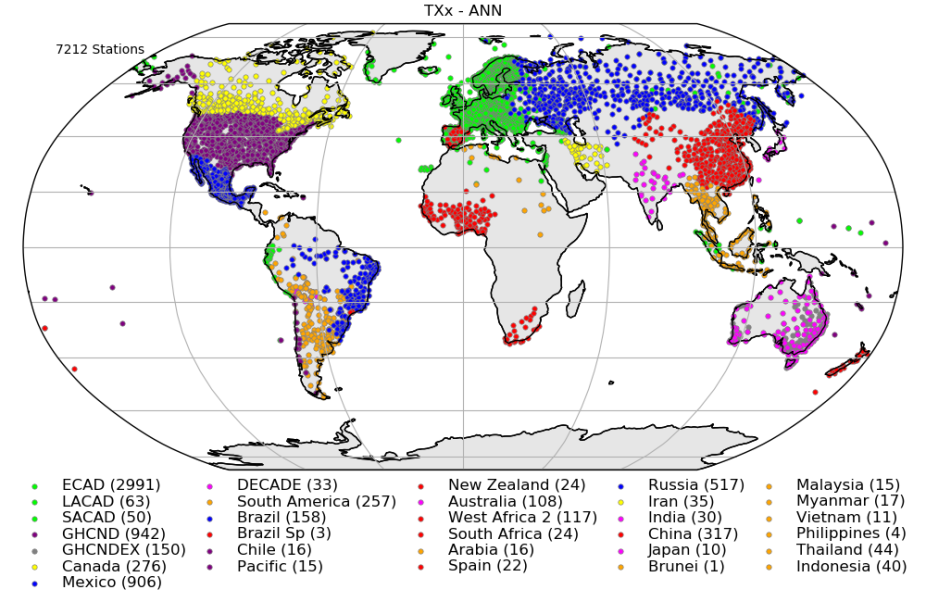
Map showing the distribution of HadEX3 stations for TXx (annual maximum value of daily maximum temperature) (credit: https://www.metoffice.gov.uk/hadobs/hadex3/)
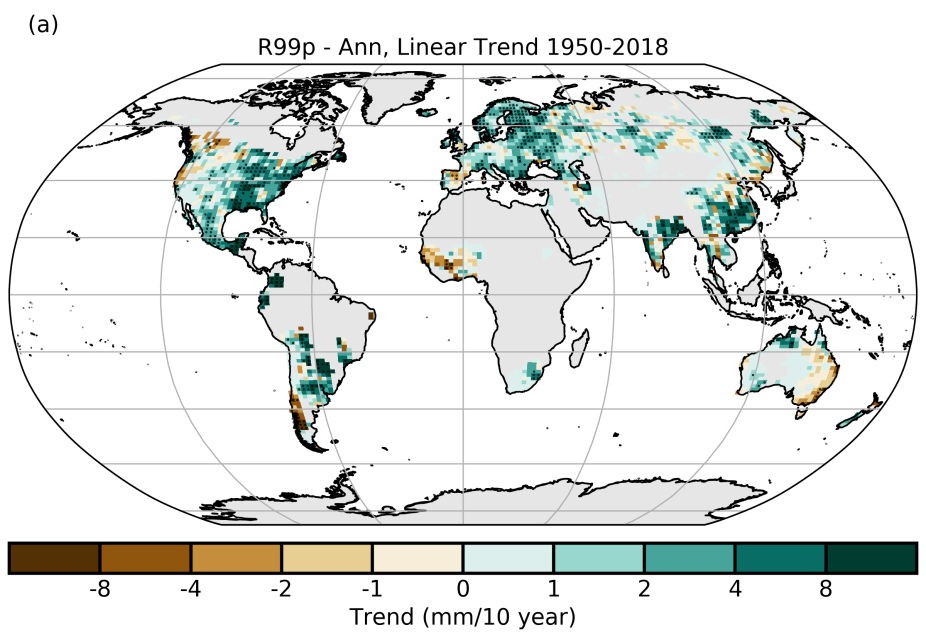
Map of linear trend in R99p (annual total precip on days when rain rate exceeds the 99th percentile) (credit: Robert Dunn; https://www.metoffice.gov.uk/hadobs/hadex3/images/HadEX3_R99p_1901-2018_ADW_61-90_1.25x1.875deg_Ann_trend.png)
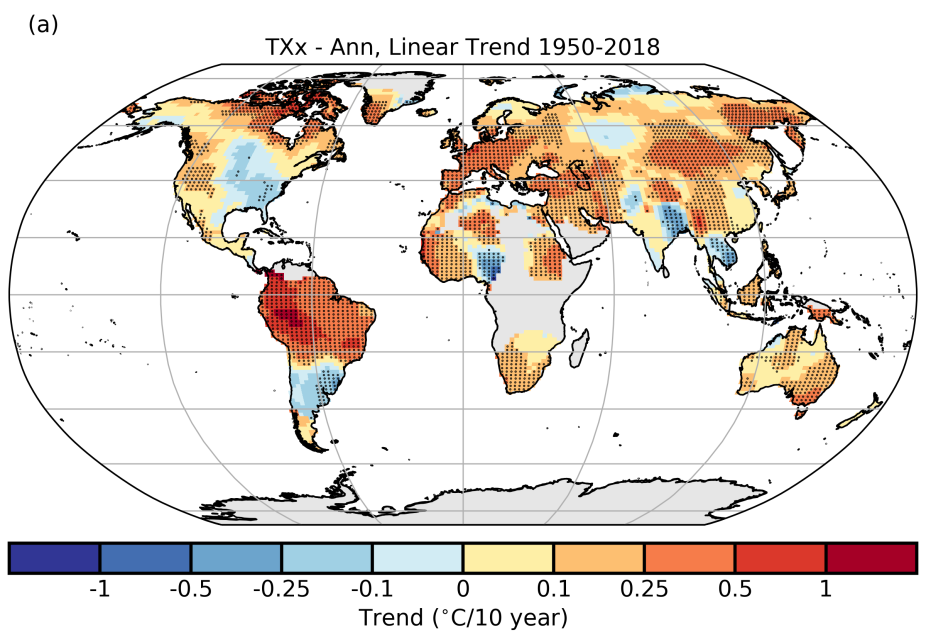
Map of linera trend in TXx (maximum value of daily maximum temperature) (Robert Dunn; https://www.metoffice.gov.uk/hadobs/hadex3/images/HadEX3_TXx_1901-2018_ADW_61-90_1.25x1.875deg_Ann_trend.png)
Other Information
- Dunn, R. J. H., Alexander, L. V., Donat, M. G., Zhang, X., Bador, M., Herold, N., et al. (2020). Development of an updated global land in situ-based data set of temperature and precipitation extremes: HadEX3. Journal of Geophysical Research: Atmospheres,
- Dunn, R. J. H. , Donat, M. G., Alexander, L. V., (2022) Comparing extremes indices in recent observational and reanalysis products. Frontiers in Climate.:183, https://doi.org/10.3389/fclim.2022.989505
- Dunn, R. J. H., Morice, C. P., (2022) On the effect of reference periods on trends in percentile-based extreme temperature indices, Environ. Res. Lett. 17 034026, https://doi.org/10.1088/1748-9326/ac52c8