HadEX2: Gridded Temperature and Precipitation Climate Extremes Indices (CLIMDEX data)
Note: HadEX2 has been superseded by HadEX3.
HadEX2 provides gridded, station-based indices of temperature- and precipitation- related climate extremes. It is intended for detection and attribution studies and climate model evaluation. Twenty-nine indices, including daily maximum and minimum temperatures, number of frost days, maximum 1-day precipitation, and growing season length are provided for 1901 to 2010 at monthly timesteps on a 2.5° latitude x 3.75 ° longitude grid. Definitions of these core indices follow recommendations set forth by the CCl/CLIVAR/JCOMM Expert Team on Climate Change Detection and Indices (ETTCCDI). Input data are from approximately 7000 temperature and 11000 precipitation observing stations distributed worldwide. The indices are computed for each station, and then the indices are gridded using an angular distance weighting scheme. Compared with the precipitation-based indices, the temperature-based indices generally show larger spatial coherence and large-scale averages that are more robust to sampling gaps.
Key Strengths
Large number of indices provided calculated with standard, intuitive definitions of extremes
Most global coverage of the "extremes" datasets, incorporating stations from Europe, Southeast Asia, and Latin America, in addition to GHCN-Daily
More quality control and homogenization of stations performed than for GHCNDEX
Key Limitations
Not routinely updated
Underlying station data not as accessible as the GHCN-Daily stations
Donat, M. G., et al. (2013), Updated analyses of temperature and precipitation extreme indices since the beginning of the twentieth century: The HadEX2 dataset, J. Geophys. Res. Atmos., 118, 2098–2118
Cite this page
Acknowledgement of any material taken from or knowledge gained from this page is appreciated:
National Center for Atmospheric Research Staff (Eds). Last modified "The Climate Data Guide: HadEX2: Gridded Temperature and Precipitation Climate Extremes Indices (CLIMDEX data).” Retrieved from https://climatedataguide.ucar.edu/climate-data/hadex2-gridded-temperature-and-precipitation-climate-extremes-indices-climdex-data on 2026-06-21.
Citation of datasets is separate and should be done according to the data providers' instructions. If known to us, data citation instructions are given in the Data Access section, above.
Acknowledgement of the Climate Data Guide project is also appreciated:
Schneider, D. P., C. Deser, J. Fasullo, and K. E. Trenberth, 2013: Climate Data Guide Spurs Discovery and Understanding. Eos Trans. AGU, 94, 121–122, https://doi.org/10.1002/2013eo130001
Key Figures

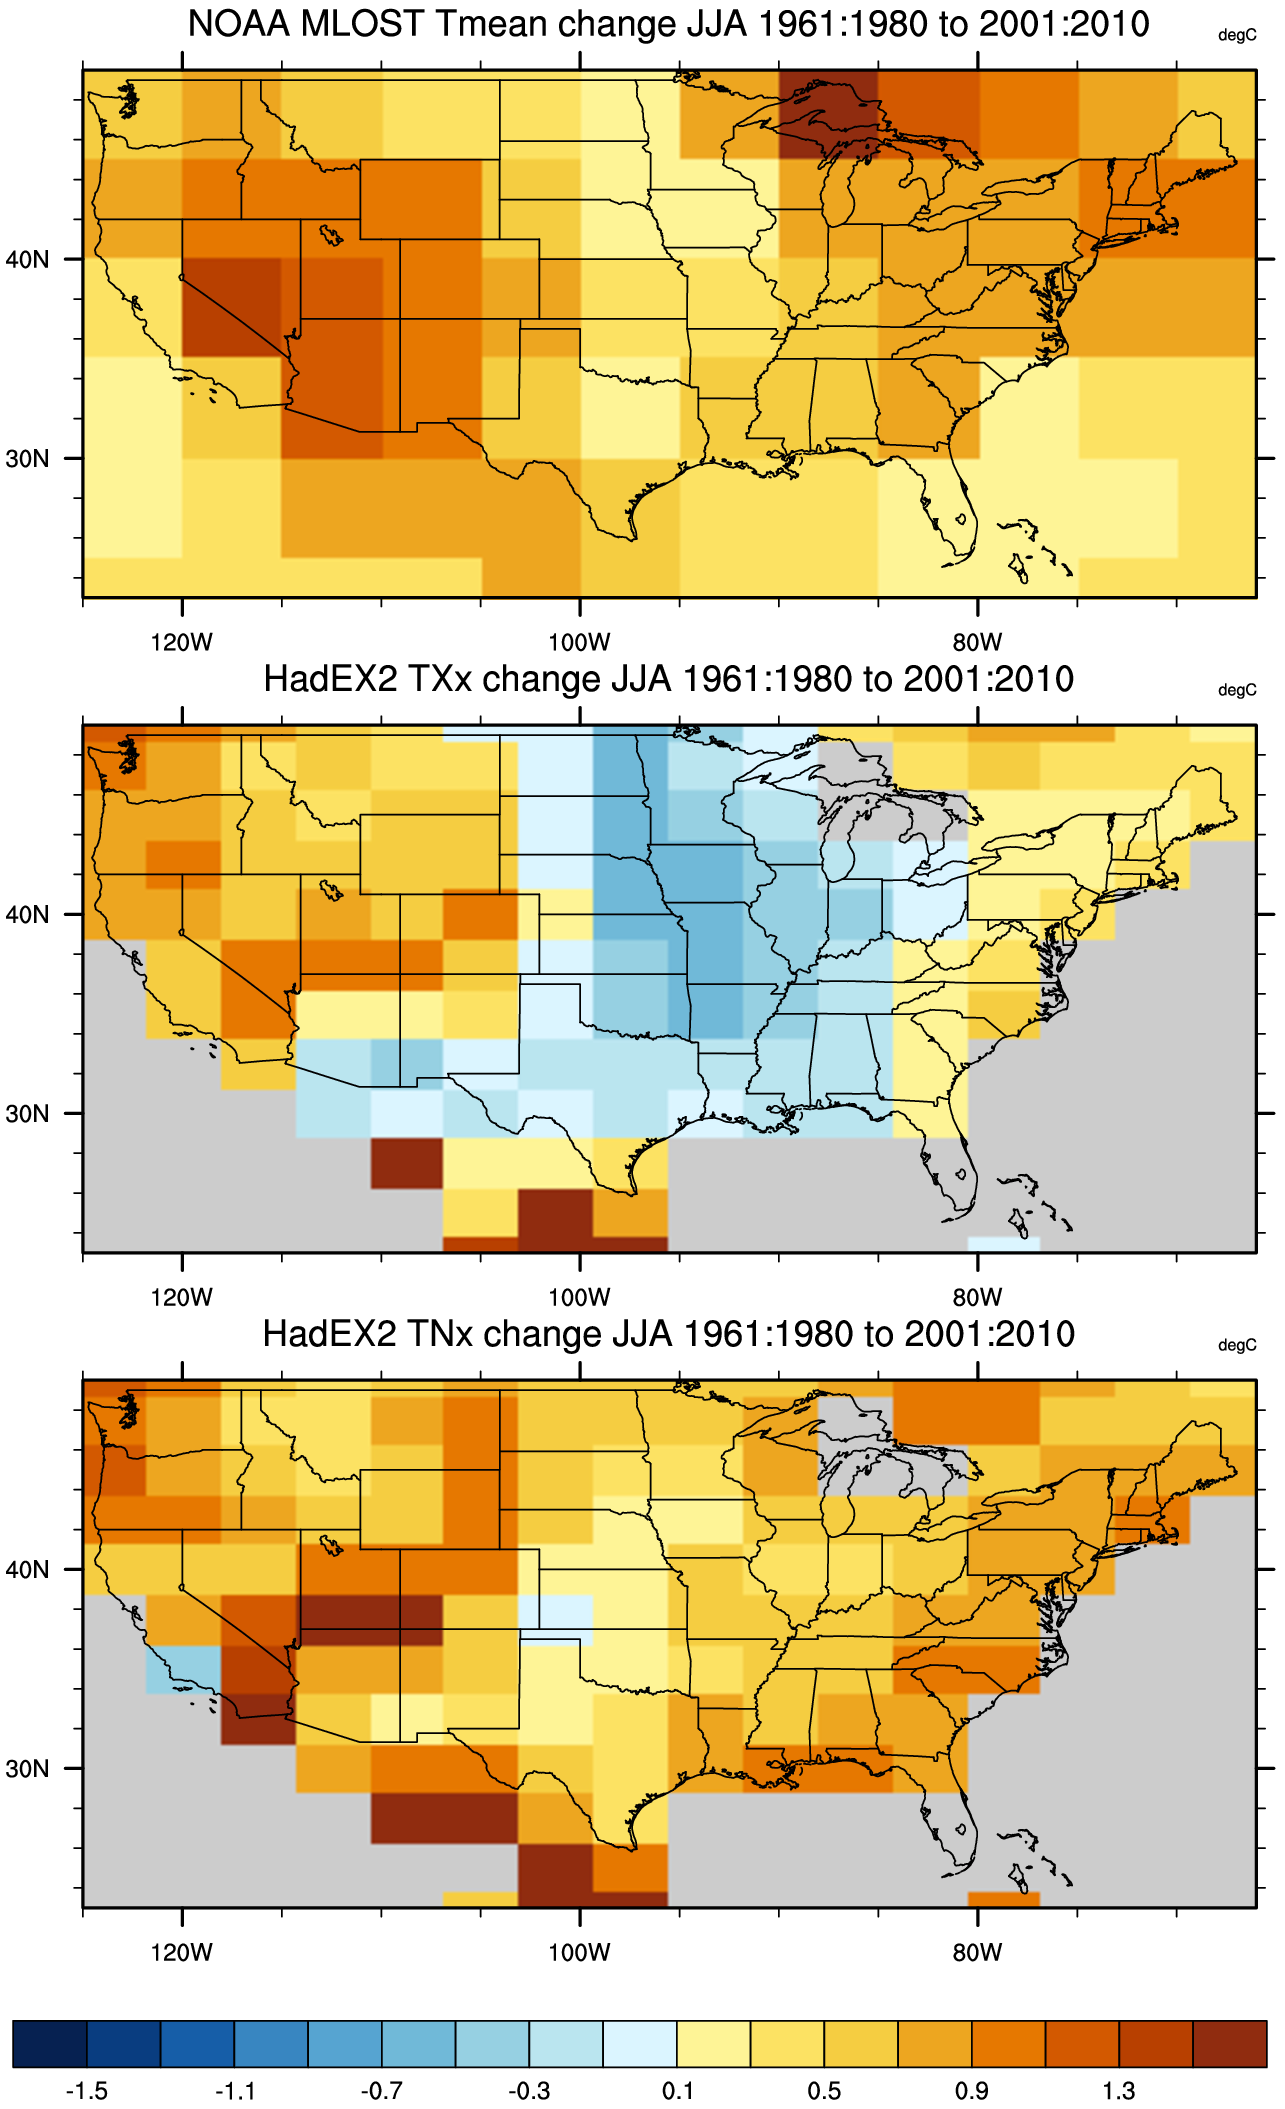
Change in the mean compared with changes in extremes: Top panel, JJA mean temperature change in the NOAA MLOST dataset; middle panel - change in daytime high temperatures, TXx, in HadEX2; bottom panel - change in nighttime minimum temperatures, TNx. An increase in nighttime lows is more pronounced than an increase in daytime highs. Credit: NCAR Climate Data Guide (D. Schneider).