GHCNDEX: Gridded Temperature and Precipitation Climate Extremes Indices (CLIMDEX data)
GHCNDEX provides gridded, station-based indices of temperature- and precipitation- related climate extremes. It is intended for detection and attribution studies, climate model evaluation, and operational monitoring of extreme climatic events. Twenty-six indices, including daily maximum and minimum temperatures, number of frost days, maximum 1-day precipitation, and growing season length are provided for 1951 to the present at monthly timesteps on a 2.5°x2.5 ° grid. Definitions of these core indices follow recommendations set forth by the CCl/CLIVAR/JCOMM Expert Team on Climate Change Detection and Indices (ETTCCDI). Input data are from the Global Historical Climatology Network (GHCN) Daily station data. Updates are made operationally. The 26 indices are computed for each station, and then the indices are gridded using an angular distance weighting scheme. Compared with the precipitation-based indices, the temperature-based indices generally show larger spatial coherence and large-scale averages that are more robust to sampling gaps.
Key Strengths
Large number of indices provided calculated with standard, intuitive definitions of extremes
Operationally updated
Key Limitations
Global coverage not as complete as other data sets including more station networks
No homogenization to account for changes in observing practices, instrumentation, site location or related issues
Uneven updating; e.g. European and North American observations updated more regularly than African and South American observations
Donat, M.G., L.V. Alexander, H. Yang, I. Durre, R. Vose, J. Caesar, 2013: Global Land-Based Datasets for Monitoring Climatic Extremes. Bull. Amer. Meteor. Soc., 94, 997–1006.
Cite this page
Acknowledgement of any material taken from or knowledge gained from this page is appreciated:
National Center for Atmospheric Research Staff (Eds). Last modified "The Climate Data Guide: GHCNDEX: Gridded Temperature and Precipitation Climate Extremes Indices (CLIMDEX data).” Retrieved from https://climatedataguide.ucar.edu/climate-data/ghcndex-gridded-temperature-and-precipitation-climate-extremes-indices-climdex-data on 2026-07-07.
Citation of datasets is separate and should be done according to the data providers' instructions. If known to us, data citation instructions are given in the Data Access section, above.
Acknowledgement of the Climate Data Guide project is also appreciated:
Schneider, D. P., C. Deser, J. Fasullo, and K. E. Trenberth, 2013: Climate Data Guide Spurs Discovery and Understanding. Eos Trans. AGU, 94, 121–122, https://doi.org/10.1002/2013eo130001
Key Figures
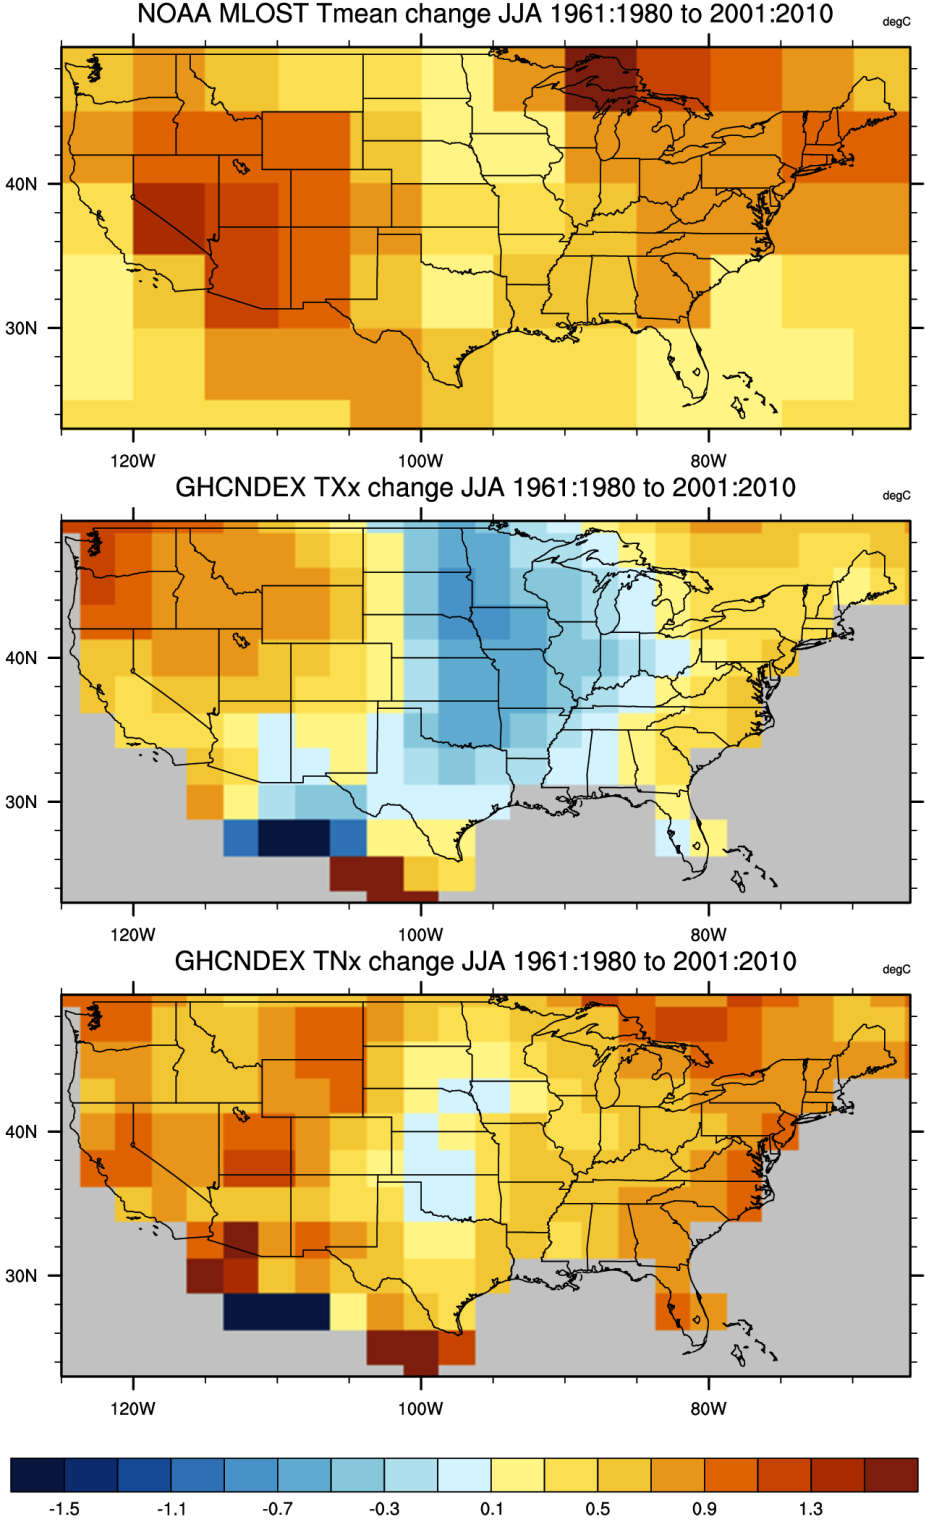
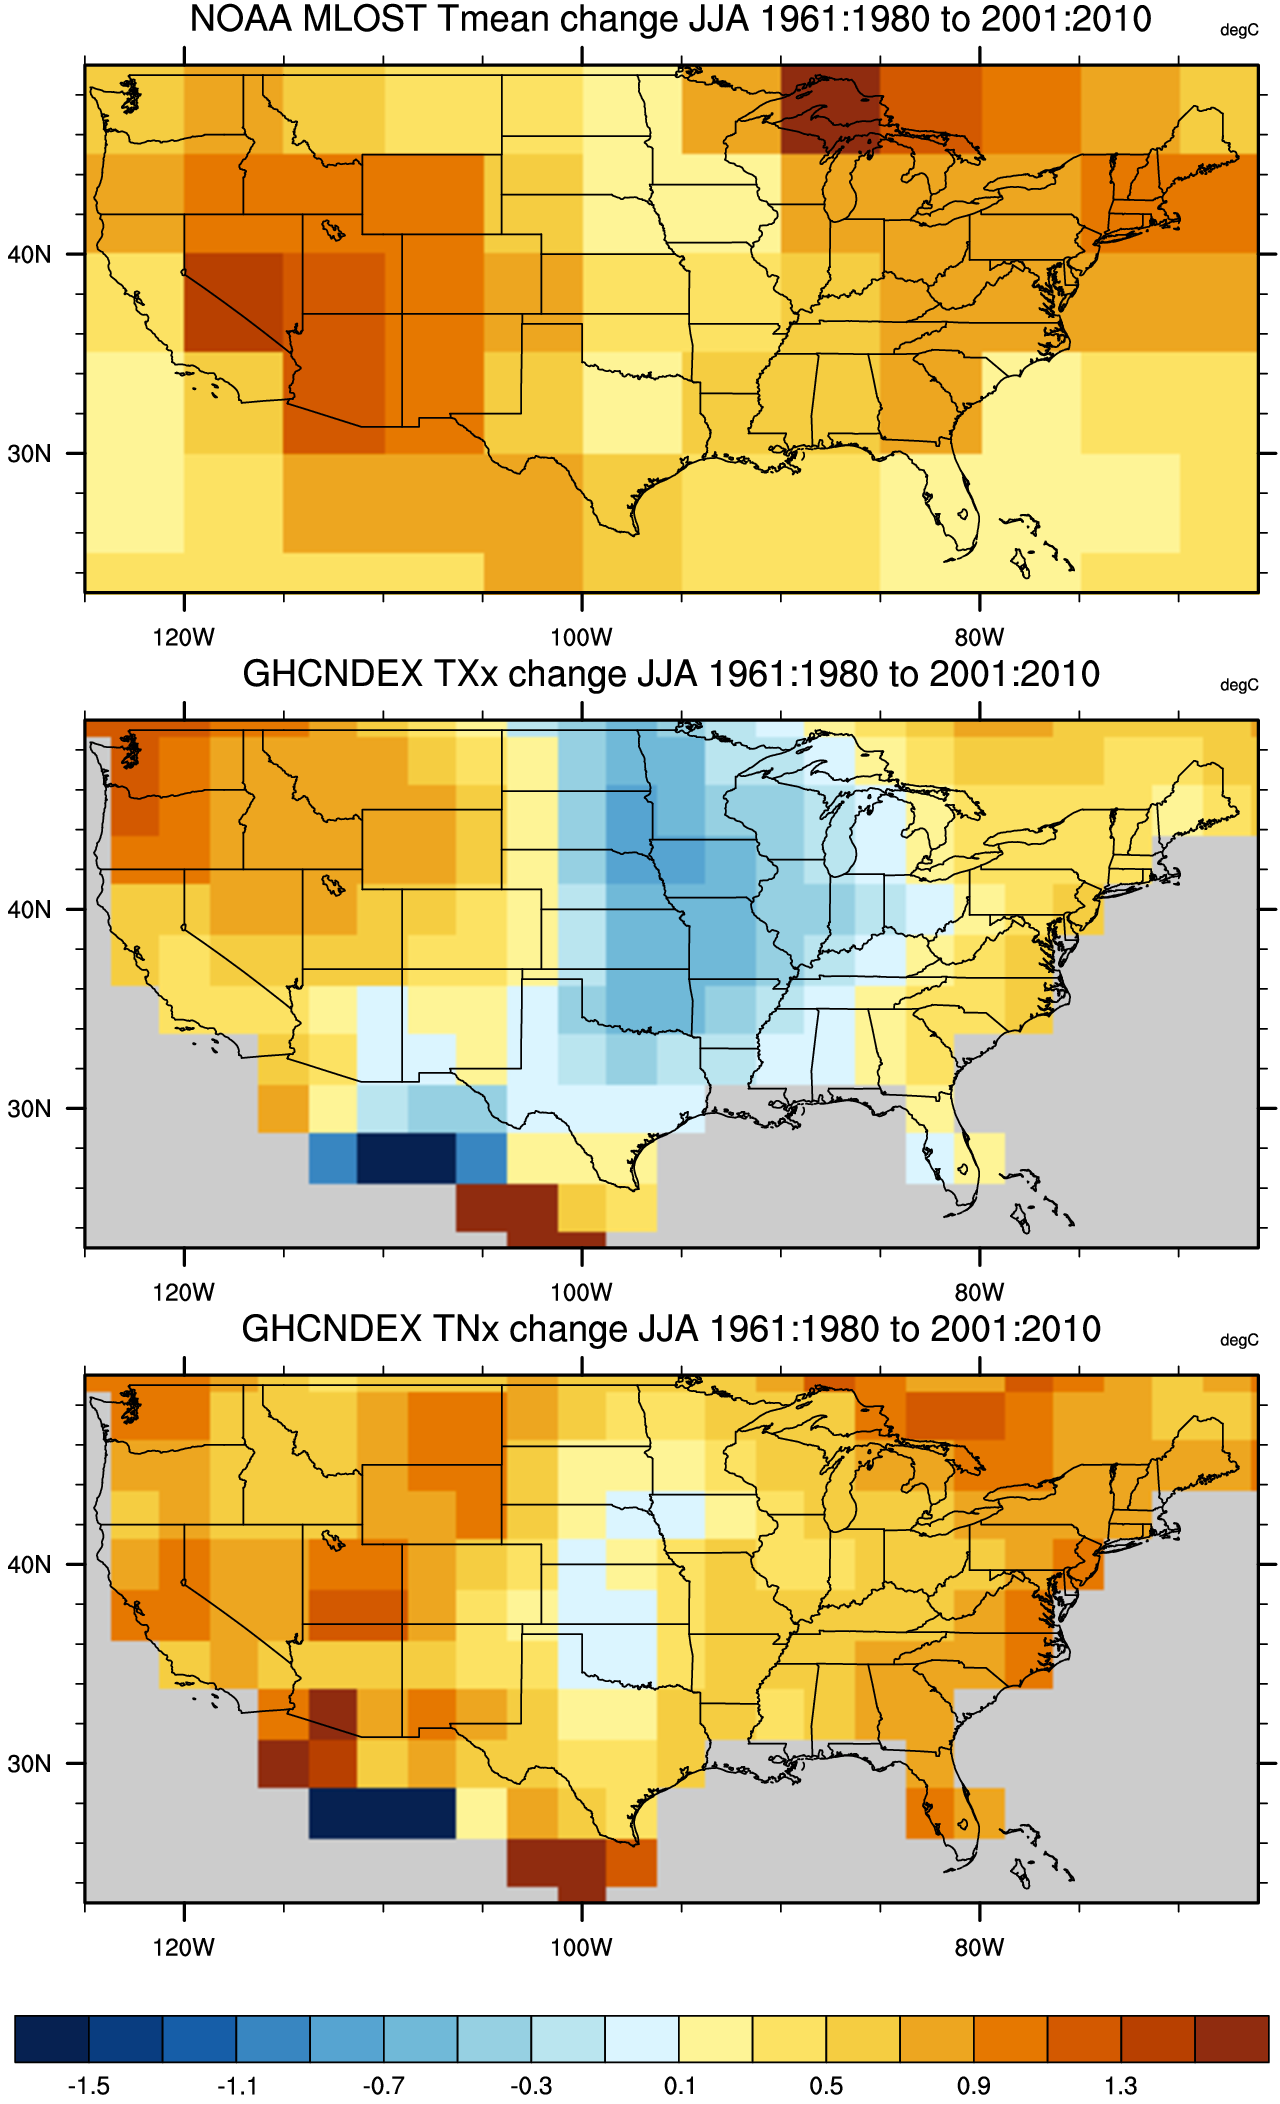
Change in the mean compared with changes in extremes: Top panel, JJA mean temperature change in the NOAA MLOST dataset; middle panel - change in daytime high temperatures, TXx, in GHCNDEX; bottom panel - change in nighttime minimum temperatures, TNx. An increase in nighttime lows is more pronounced than an increase in daytime highs. Credit: NCAR Climate Data Guide (D. Schneider).
Other Information
- Donat, M.G., L.V. Alexander, H. Yang, I. Durre, R. Vose, J. Caesar, 2013: Global Land-Based Datasets for Monitoring Climatic Extremes. Bull. Amer. Meteor. Soc., 94, 997–1006.
- Fischer, E. M., and R. Knutti (2014), Detection of spatially aggregated changes in temperature and precipitation extremes, Geophys. Res. Lett., 41, doi:10.1002/2013GL058499.