HadISD: Sub-daily, non-interpolated weather station data

HadISD ("Hadley Centre Integrated Surface Database") is a compendium of subdaily weather-station data developed by the UK Met Office that is based on NOAA NCEI's Integrated Surface Database but with various quality-control checks implemented to remove stations with excessive and obvious typographical or instrumental errors, as well as individual occurrences of these issues. Variables generally available include temperature, dewpoint temperature, sea-level pressure, wind speed and direction, precipitation amount, cloud cover and base height, and notes about significant weather. All observed variables are present at their native temporal frequency -- usually 1-hourly, 3-hourly, or 6-hourly. In some cases, 50 or more years of near-hourly data can be obtained; in others, missing data are rather frequent. Each observing location has its own entry, so short station moves tend to create two nearby entries with complementary timespans. The period of record spans from Jan 1, 1931 to several months before present, with provisional updates approximately every month. About 10,000 stations (listed by their WMO identification number) are available globally, with data provided as individual netCDF files by station. The entire dataset is ~23 GB.
Key Strengths
The station set is comprehensive and routinely updated, enabling an as-close-to-truly-global analysis as is possible without making recourse to a gridded product
. The lack of imposed inhomogeneity corrections or other adjustments allows users to inspect and analyze the raw observations as they best see fit.
Because clearly problematic data present in ISD have largely been filtered out, in areas with good data coverage, calculations can generally proceed straight ahead without the need to delve into further QC efforts.
Key Limitations
Only temperature, dewpoint, pressure, and wind and cloud information are quality-controlled, and each variable's QC tests are run separately. For this reason and others, detailed analysis can still occasionally encounter QC issues.
Data are not homogenized, so temporal agreement cannot be guaranteed, and this goes for spatial consistency among nearby stations too.
Additional information is available in the Expert Guidance, below, in the peer-reviewed literature (see the References section), and at the "online material" webpage (linked in the Data Access section)
Dunn, R. J. H., Willett, K. M., Parker, D. E., and Mitchell, L. (2016) Expanding HadISD: quality-controlled, sub-daily station data from 1931, Geosci. Instrum. Method. Data Syst., 5, 473491, https://doi.org/10.5194/gi-5-473-2016
Dunn, R. J. H. (2019) HadISD version 3, Hadley Centre Tech Note #103
[Alternatively, use the citation from the CEDA Archive: Met Office Hadley Centre; National Centers for Environmental Information - NOAA (2020): HadISD: Global sub-daily, surface meteorological station data, 1931-2019, v3.1.0.2019f. Centre for Environmental Data Analysis, date of citation. ]
Expert User Guidance
The following was contributed by Colin Raymond, May 2023:
HadISD is a premier choice for analyses aiming to investigate surface weather or climate with a high degree of precision and without reliance on interpolation algorithms of any sort. These attributes are the source of both its strengths and limitations. On one hand, HadISD data can shed light on diurnal cycles, short-duration events such as extremes, localized phenomena, and variables that are poorly represented in reanalyses and models, even those run at regional scales. For example, it has been used to good effect in examining regional and local characteristics of heat waves and heavy precipitation events, revealing details missed or spatiotemporally smoothed out by gridded products. On the other hand, certain instrumentation and measurement errors can (infrequently) linger despite algorithmic attempts at detecting and removing them, and other sources of uncertainty such as station moves or nearby land-cover change are not accounted for.
Overall, HadISD is an authoritative station-based dataset with frequent updates and a large body of citing literature. Aside from its value as a standalone dataset, it can serve as a benchmark observational reference, particularly for variables with frequent fluctuations or pervasive model biases, such as humidity, clouds, and winds. Unlike the Global Historical Climatology Network [GHCN], HadISD contains all available subdaily data, though it is missing certain GHCN variables like evaporation. GHCN also offers more stations, through inclusion of cooperative observing locations and stations with substantial missing records or short durations; most of the good-quality stations globally are present in both datasets.
No single dataset ever holds complete advantage over all others or provides a complete picture by itself. However, taking into account the above caveats, HadISD's combination of high temporal resolution, general reliability, and frequent usage in peer-reviewed studies make it a strong choice for understanding patterns or trends at anything from a local to a global perspective.
Key Strengths
The station set is comprehensive and routinely updated, enabling an as-close-to-truly-global analysis as is possible without making recourse to a gridded product which of course involves uncertainties of other sorts. Because clearly problematic data present in ISD have largely been filtered out, in areas with good data coverage, calculations can generally proceed straight ahead without the need to delve into further QC efforts. The lack of imposed inhomogeneity corrections or other adjustments allows users to inspect and analyze the raw observations as they best see fit. HadISD has been frequently cited in peer-reviewed work and also serves as the basis for derived products such as HadISDH, a package of monthly-mean humidity-related variables.
Key Limitations
Only temperature, dewpoint, pressure, and wind and cloud information are quality-controlled, and each variable's QC tests are run separately. For this reason and others, detailed analysis can still occasionally encounter QC issues. To aid in understanding how the data have been affected by the QC process, QC flags and the data removed in consequence are also included. Data are not homogenized, so temporal agreement cannot be guaranteed, and this goes for spatial consistency among nearby stations too. Additional information is available at the "online material" page.
Cite this page
Acknowledgement of any material taken from or knowledge gained from this page is appreciated:
Raymond, Colin & National Center for Atmospheric Research Staff (Eds). Last modified "The Climate Data Guide: HadISD: Sub-daily, non-interpolated weather station data.” Retrieved from https://climatedataguide.ucar.edu/climate-data/hadisd-sub-daily-non-interpolated-weather-station-data on 2026-02-27.
Citation of datasets is separate and should be done according to the data providers' instructions. If known to us, data citation instructions are given in the Data Access section, above.
Acknowledgement of the Climate Data Guide project is also appreciated:
Schneider, D. P., C. Deser, J. Fasullo, and K. E. Trenberth, 2013: Climate Data Guide Spurs Discovery and Understanding. Eos Trans. AGU, 94, 121–122, https://doi.org/10.1002/2013eo130001
Key Figures
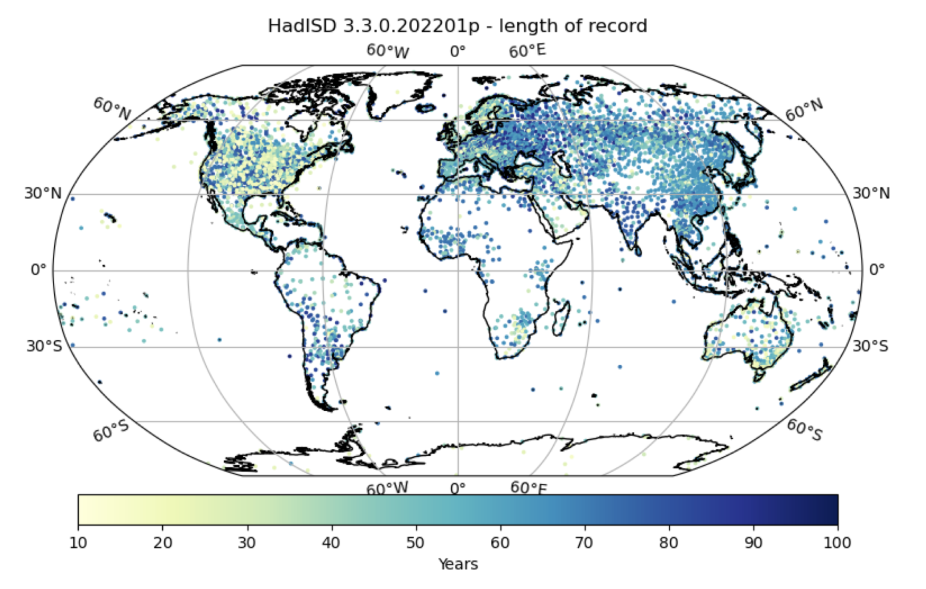
Station coverage and length of record in HadISD (note that short-length stations obscure long ones in some dense regions here) (contributed by Colin Raymond)
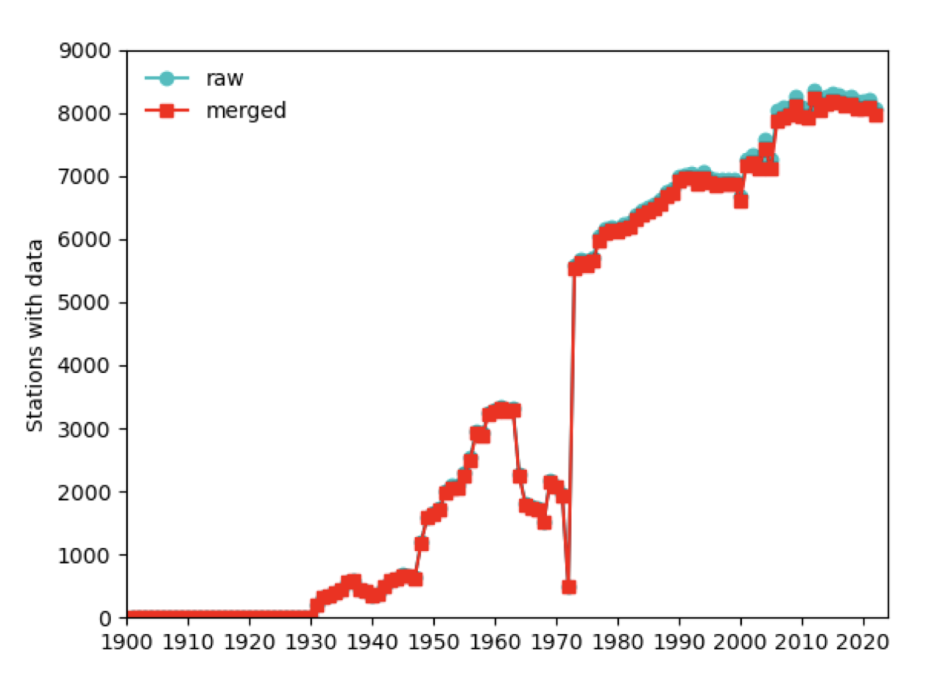
Timeseries of available stations in HadISD. (contributed by Colin Raymond)
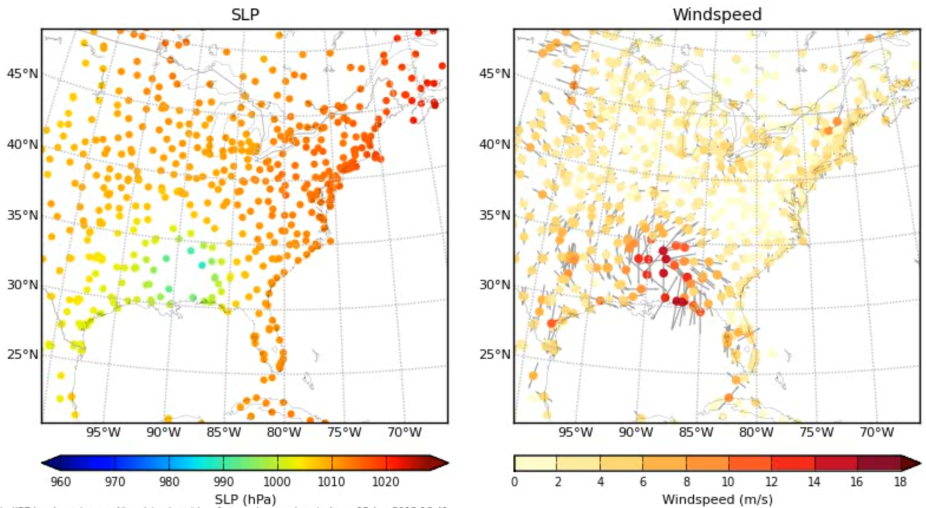
Snapshots of hourly sea-level pressure and wind speed for 00:00 UTC on Aug 30, 2005, shortly after the landfall of Hurricane Katrina, according to HadISD (UK Met Office; contributed by Colin Raymond)
Other Information
- Dunn, R. J. H., Willett, K. M., Parker, D. E., and Mitchell, L. (2016) Expanding HadISD: quality-controlled, sub-daily station data from 1931, Geosci. Instrum. Method. Data Syst., 5, 473491, https://doi.org/10.5194/gi-5-473-2016
- Dunn, R. J. H., K. M. Willett, P. W. Thorne, E. V. Woolley, I. Durre, A. Dai, D. E. Parker, and R. S. Vose, 2012: HadISD: a quality-controlled global synoptic report database for selected variables at long-term stations from 1973–2011. Clim. Past, 8, 1649
- Dunn, R. J. H., KM Willett, CP Morice, and DE Parker. Pairwise homogeneity assessment of hadisd. Climate of the Past, 10(4):1501–1522, 2014.