Historical land-cover changes and land-use conversions global data set by Meiyappan and Jain
Key Strengths
Key Limitations
Expert Developer Guidance
The following was contributed by Prasanth Meiyappan (U Illinois), September, 2012:
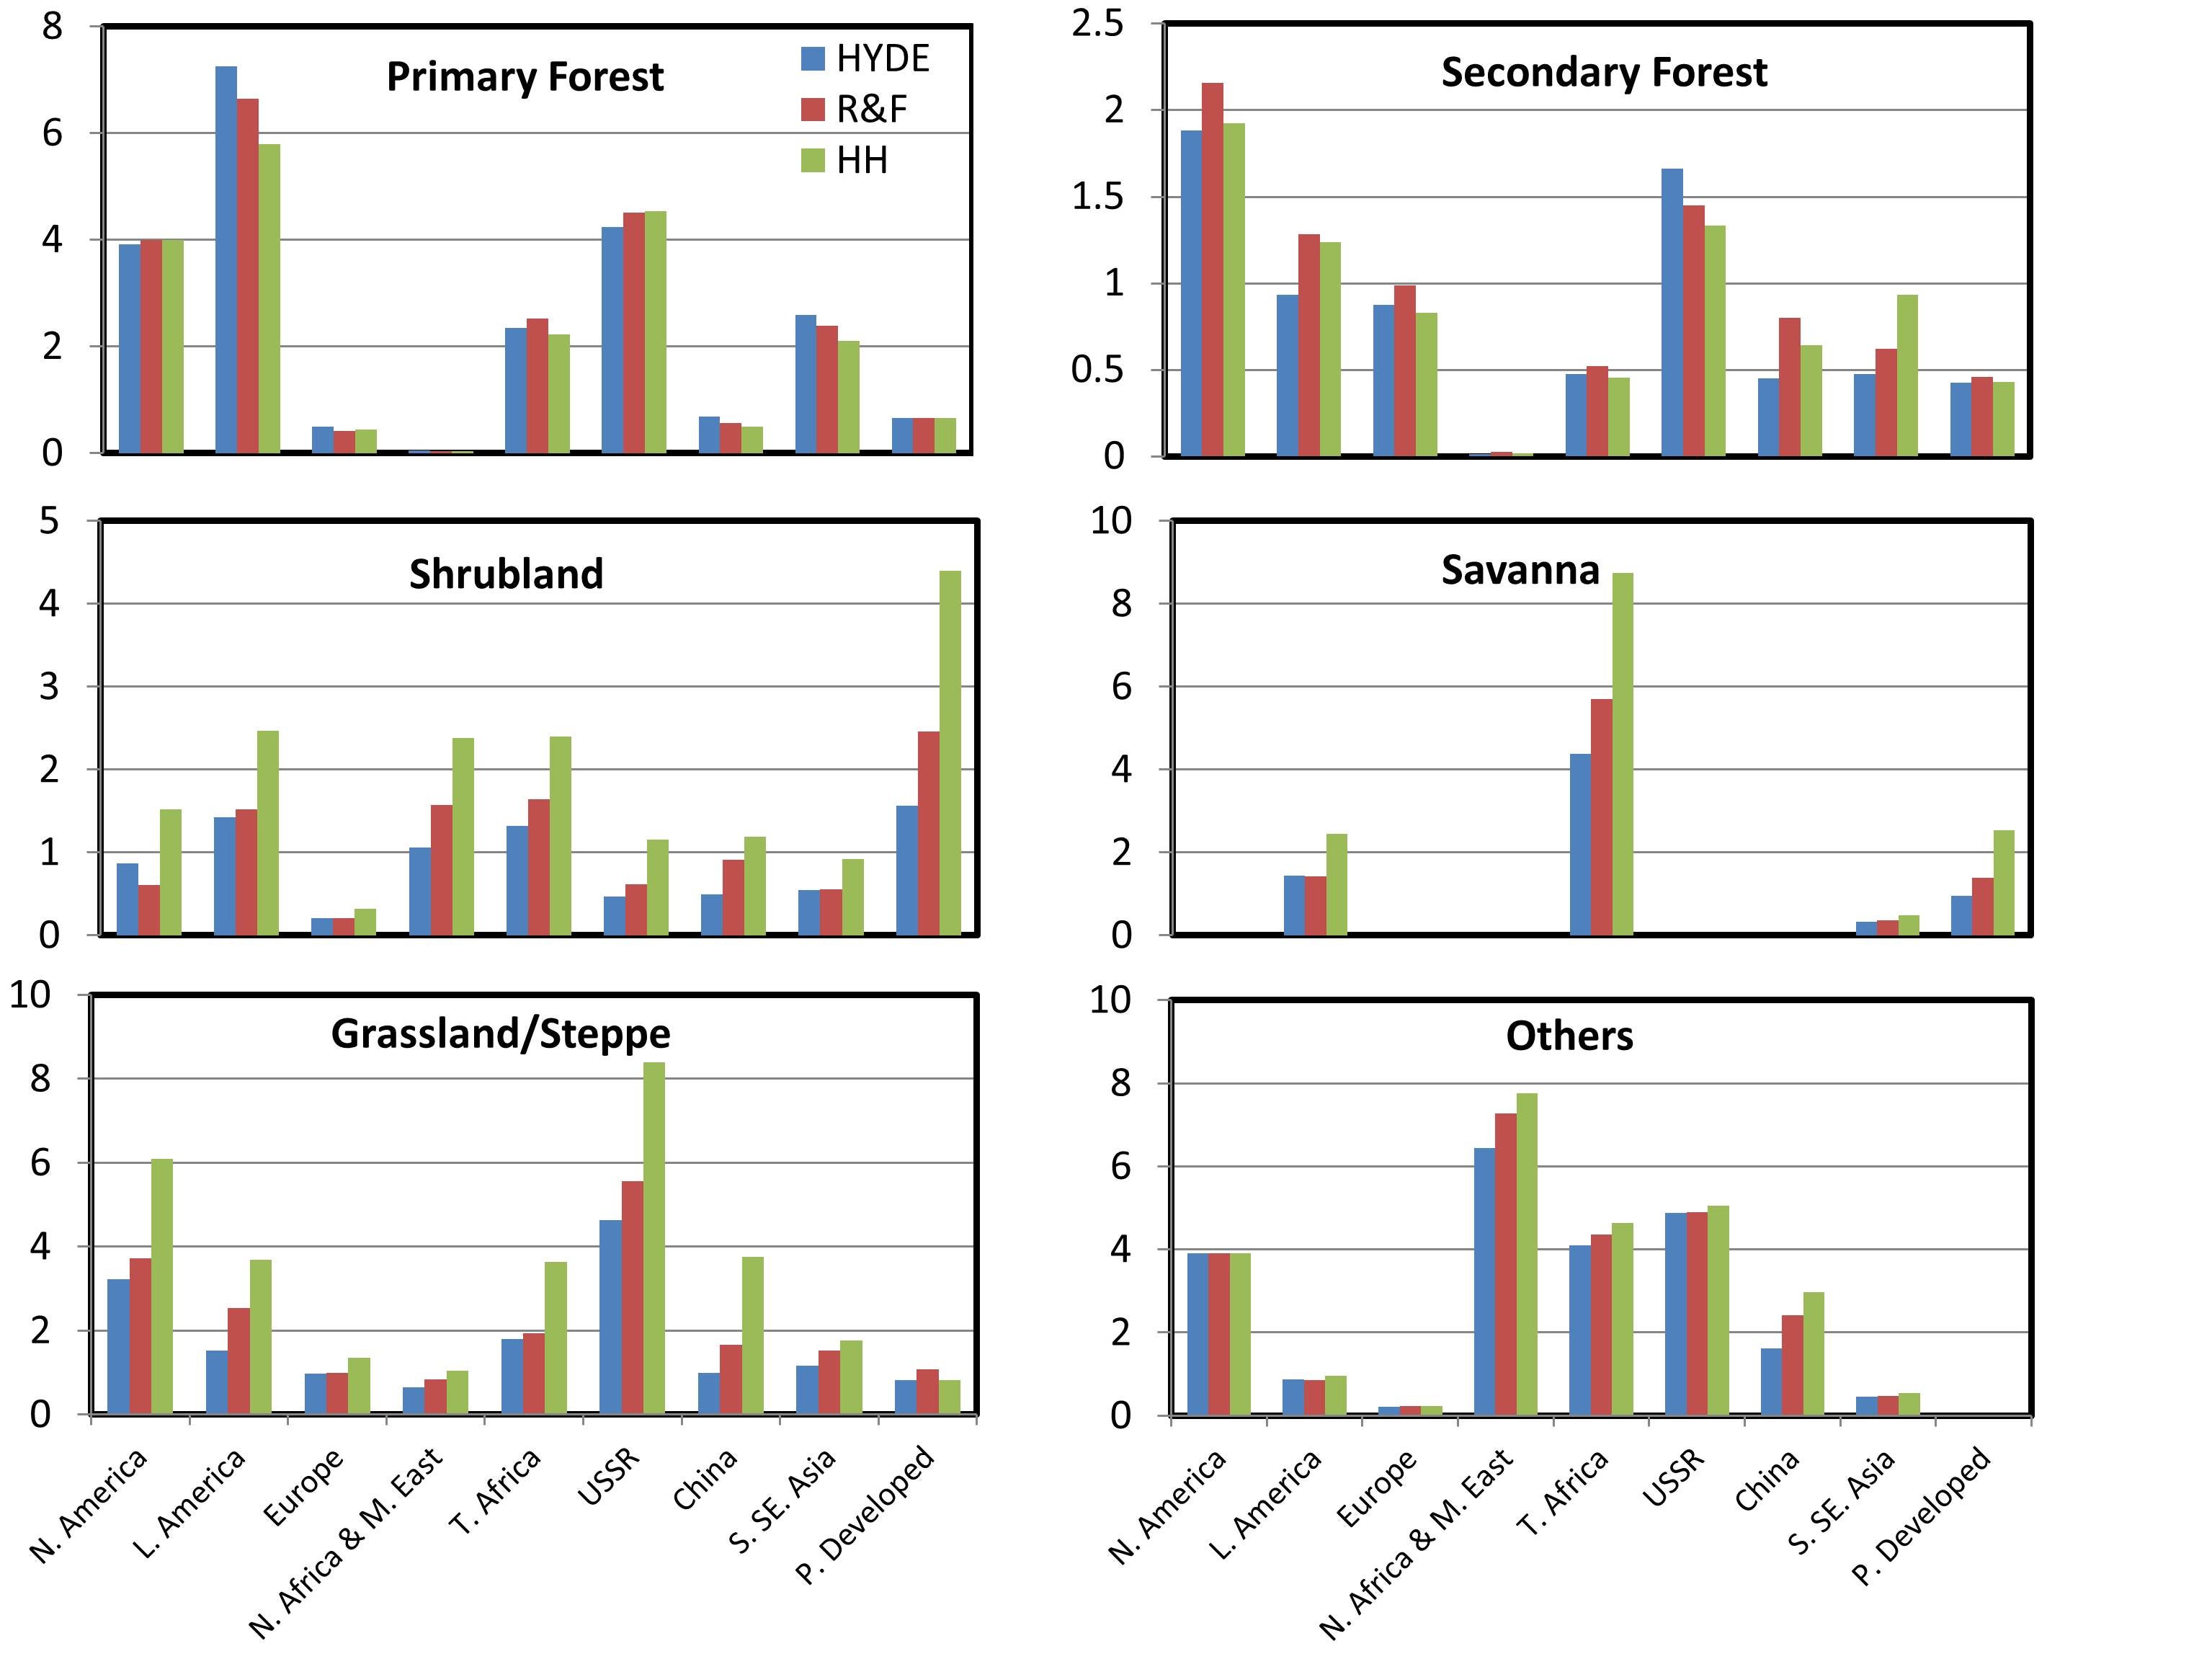
These datasets describe annual historical changes in land cover and underlying land-use conversions at 0.5 °x0.5 ° resolution. Three distinct estimates of land-cover change and land-use conversions were reconstructed using three different datasets on cropland and pastureland based on RF data (updated estimates based on Ramankutty and Foley, 1999), HYDE data (HYDE 3.1 'baseline' scenario - Klein Goldewijk et al. 2011) and HH data (Houghton 2008 - estimates based on FAO 2006). All the three estimates used common wood harvest and urban land data based on Hurtt et al. (2011) and Klein Goldewijk et al. (2010) respectively.
The method of reconstruction utilized multiple years of MODIS land cover data (Friedl et al. 2010) as boundary conditions to implicitly account for unaccounted land-cover change. The land-cover maps produced for recent years are consistent with MODIS satellite estimates. The three estimates developed based on three agricultural datasets (HYDE, RF and HH) are referred to as ISAM-HYDE, ISAM-RF and ISAM-HH respectively. ISAM-HYDE estimates cover the period 1770-2010 ISAM-RF estimates cover the period 1770-2007 ISAM-HH estimates cover the period 1770-2005.
The annual land-cover maps contain the area (as percentage of grid cell area) of 28 land-cover types within each 0.5x0.5 degree grid cell. The annual land-use conversion maps contain the area transitioned (as percentage of grid cell area) for each of the 92 unique conversions possible.
KEY STRENGTHS:
1. Uses a globally consistent methodology for all three reconstructions. The annual land-cover maps and underlying land-use transitions are consistent with each other.
2. Land-Cover maps for recent years are consistent with satellite estimates.
3. All three reconstructions start and end with a common land-cover map, but in varying pathways. Hence, these distinct historical reconstruction offer a wide range of plausible regional estimates of uncertainty and the extent to which different ecosystems have undergone changes.
4. Implicitly accounts for unaccounted land-cover changes resulting from both indirect anthropogenic and natural causes.
5. Includes the influence of major land-use activities: cropland, pastureland, urban land and wood harvest.
KEY WEAKNESSES:
1. Effect of shifting cultivation not included due to lack of sufficient information.
2. Land-Cover maps are a strong function of methodology and assumptions made. A systematic analysis of sensitivity to assumptions made is beyond the scope of this study.##
Cite this page
Acknowledgement of any material taken from or knowledge gained from this page is appreciated:
Meiyappan, Prasanth & National Center for Atmospheric Research Staff (Eds). Last modified "The Climate Data Guide: Historical land-cover changes and land-use conversions global data set by Meiyappan and Jain.” Retrieved from https://climatedataguide.ucar.edu/climate-data/historical-land-cover-changes-and-land-use-conversions-global-data-set-meiyappan-and on 2026-05-23.
Citation of datasets is separate and should be done according to the data providers' instructions. If known to us, data citation instructions are given in the Data Access section, above.
Acknowledgement of the Climate Data Guide project is also appreciated:
Schneider, D. P., C. Deser, J. Fasullo, and K. E. Trenberth, 2013: Climate Data Guide Spurs Discovery and Understanding. Eos Trans. AGU, 94, 121–122, https://doi.org/10.1002/2013eo130001
Key Figures
Natural land cover types during 2005 (Meiyappan & Jain).