Marshall Southern Annular Mode (SAM) Index (Station-based)
The station-based index of the Southern Annular Mode (SAM) is based on the zonal pressure difference between the latitudes of 40S and 65S. As such, the SAM index measures a "see-saw" of atmospheric mass between the middle and high latitudes of the Southern Hemisphere. Positive values of the SAM index correspond with stronger-than-average westerlies over the mid-high latitudes (50S-70S) and weaker westerlies in the mid-latitudes (30S-50S). The SAM is the leading mode of variability in the SH atmospheric circulation on month-to-month and interannual timescales. SAM variability has large impacts on Antarctic surface temperatures, ocean circulation, and many other aspects of SH climate. The station-based SAM index, which extends back to 1957, uses records from six stations at roughly 65S and six stations at roughly 40S. It was developed as an alternative to reanlayses-based indices, which are of questionable quality before ~1979. The station-based index is defined on monthly, seasonal, and annual timescales. The NOAA Climate Prediction Center computes a daily SAM index based on reanalyses. "Antarctic Oscillation" is another name for the SAM.
Key Strengths
Key Limitations
Marshall GJ. 2003. Trends in the Southern Annular Mode from observations and reanalyses. Journal of Climate, 16: 4134‒4143.
Expert User Guidance
The following was contributed by Dr. Gareth Marshall, October, 2015:
The Southern Annular Mode (SAM) is the principal mode of variability in the Southern Hemisphere (SH) extra-tropics, describing ~30% of SH climate variability. Its spatial structure comprises synchronous pressure anomalies of opposite sign in mid and high latitudes: when pressures are anomalously high over Antarctica the SAM is defined as being in its positive phase and vice versa. Alternatively, SAM variability can be characterized as changes in the latitudinal position and strength of the SH mid-latitude jet, although recent work suggests that there is not a simple mapping between the SAM and these jet properties (Swart et al. 2015).
There has been much recent interest in the SAM because (i) its variability has a large impact on the climate in many regions of the SH extra-tropics and high latitudes (e.g. Thompson et al. 2011): examples include Australian rainfall and Antarctic surface temperatures, and (ii) there has been a statistically significant positive trend during austral autumn and summer over the past few decades (e.g. Marshall, 2007). Modelling studies have suggested that ozone depletion is the principal cause of the trend in summer (e.g. Thompson et al. 2011) with perhaps natural variability being primarily responsible for the autumn trend (Fogt et al. 2009).
The observation-based SAM index dataset was first developed because of the poor quality of reanalyses in the SH high latitudes before 1979 (e.g. Bromwich et al., 2007), when routine satellite sounder data over the Southern Ocean first became available. Prior to this, reanalyses tend to relax to their model climatology in southern high latitudes as there are very few data to be assimilated. Several published studies used the first NCEP-NCAR reanalysis (NNR) to demonstrate marked trends in the SAM before 1979 but other work demonstrated that such trends were predominantly due to spurious SLP trends at high latitudes (e.g. Hines et al., 2000; Marshall and Harangozo, 2000). While improved assimilation schemes in more recent reanalyses will optimize the use of the few observations available, their scarcity means that it is likely that reanalyses will always be significantly less accurate at SH high latitudes before 1979.
Therefore, in order to produce a reliable and consistent SAM index further back in time, station observations are required. Based on the numerical definition of the SAM by Gong and Wang (1999), which is:
SAM = P*40°S – P*65°S
where P*40°S and P*65°S are the normalized monthly zonal sea level pressure (SLP) at 40°S and 65°S, respectively, six stations located at approximately these two latitudes are used to compute the SAM (Figure 1). The methodology is discussed in detail in Marshall (2003) and at the dataset website: https://legacy.bas.ac.uk/met/gjma/sam.html. The 30-year period from 1971-2000 is used for the normalization period. Note that this period is arbitrary and a switch to a different period would change the exact SAM values but would be unlikely to significantly alter any trends.
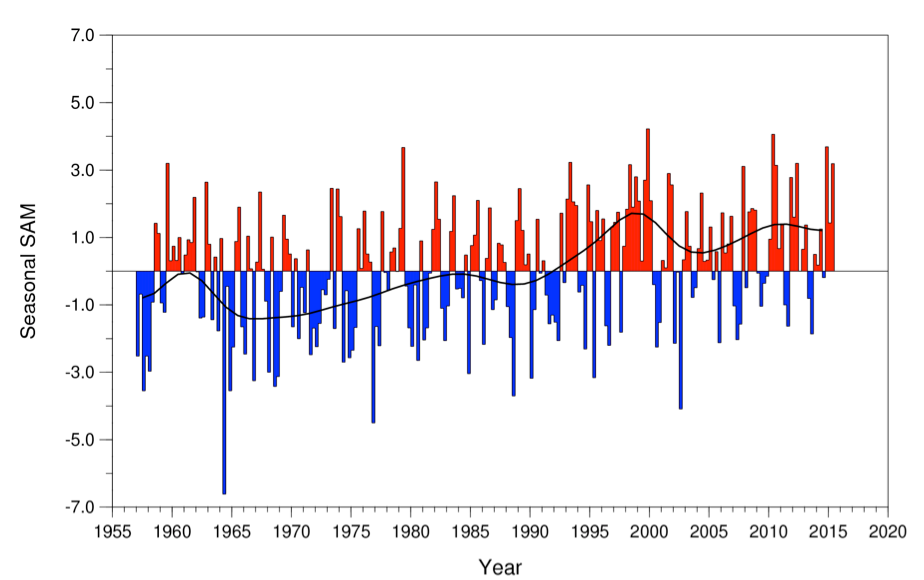
The dataset website https://legacy.bas.ac.uk/met/gjma/sam.html has monthly, seasonal and annual data. The latter should not be calculated as the mean of monthly values as the standard deviation varies significantly between different calendar months. Also included are the mean zonal SLP at both latitudes, as for some studies un-normalized data are more appropriate, and various different figures, an example of which is shown here as Figure 2.
There are two principal limitations of the observation-based SAM index. The first is that it is attempting to describe a hemispheric-scale mode of climate variability based only on twelve points that are not equidistantly spaced. For example, there are no stations in the Pacific sector in the SH extra-tropics or in Antarctica at similar longitudes. Thus, there is the potential for the index to miss variability in this region or exaggerate its importance at longitudes where the stations are relatively close together, such as in East Antarctica. The second limitation is that the index only goes back as far as 1957. This was the date of the International Geophysical Year and prior to this there were very few observations in Antarctica. Attempts have been made to extend the data back further to the late 19th Century using statistical reconstructions based on mid-latitude observations, as outlined in Jones et al. (2009), but to date such reconstructions are relatively inconsistent and thus have a large uncertainty attached to them.
Post 1979, the SAM can be defined as the leading Empirical Orthogonal Function (EOF) of either geopotential height or zonal wind, as the reanalyses products are much more accurate and consistent at SH high latitudes. One such example is the Climate Prediction Centre index (http://www.cpc.ncep.noaa.gov/products/precip/CWlink/daily_ao_index/aao/monthly.aao.index.b79.current.ascii.table), which uses 700 hPa geopotential height anomalies for 20-90°S normalized to a 1979-2000 base period. The correlation between this and the observation-based SAM index is 0.83 over 35 years (420 months). Many other SAM indices have been produced and several are compared in the paper by Ho et al. (2012). ##
Cite this page
Acknowledgement of any material taken from or knowledge gained from this page is appreciated:
Marshall, Gareth & National Center for Atmospheric Research Staff (Eds). Last modified "The Climate Data Guide: Marshall Southern Annular Mode (SAM) Index (Station-based).” Retrieved from https://climatedataguide.ucar.edu/climate-data/marshall-southern-annular-mode-sam-index-station-based on 2026-06-17.
Citation of datasets is separate and should be done according to the data providers' instructions. If known to us, data citation instructions are given in the Data Access section, above.
Acknowledgement of the Climate Data Guide project is also appreciated:
Schneider, D. P., C. Deser, J. Fasullo, and K. E. Trenberth, 2013: Climate Data Guide Spurs Discovery and Understanding. Eos Trans. AGU, 94, 121–122, https://doi.org/10.1002/2013eo130001
Key Figures
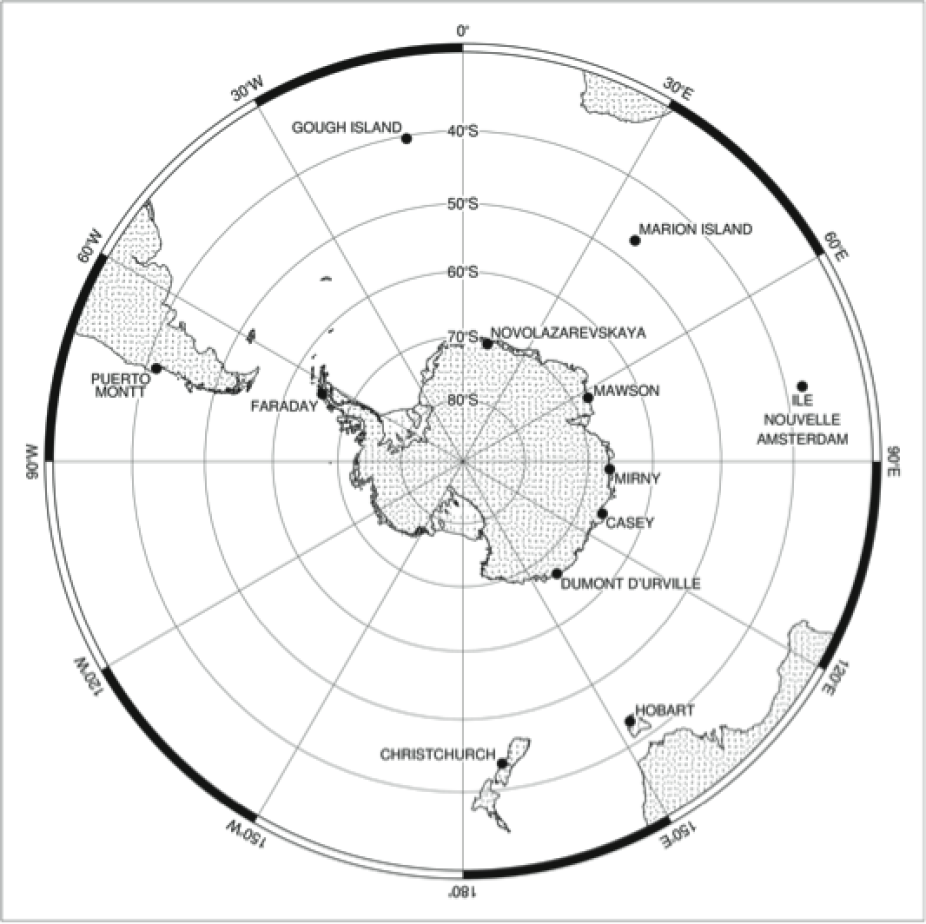
Figure 1. Locations of the 12 stations used to calculate the observation-based SAM index (contributed by G Marshall)

Figure 2. Seasonal values of the observation-based SAM index. The smooth black curve shows decadal variations. This figure is updated from Figure 3.32 in Trenberth et al. (2007). (contributed by G Marshall)
Other Information
- Marshall GJ. 2003. Trends in the Southern Annular Mode from observations and reanalyses. Journal of Climate, 16: 4134‒4143.
- Bromwich DH, Fogt RL, Hodges KI, and Walsh JE. 2007. A tropospheric assessment of the ERA-40, NCEP, and JRA-25 global reanalyses in the polar regions. Journal of Geophysical Research, 112: doi:10.1029/2006JD007859.
- Fogt RL, et al. 2009. Historical SAM variability. Part II: Twentieth-century variability and trends from reconstructions, observations, and the IPCC AR4 models. Journal of Climate, 22: 5346‒5365.
- Gong D, and Wang S. 1999. Definition of Antarctic oscillation index. Geophysical Research Letters, 26: 459‒462.
- Hines KM, Bromwich DH, and Marshall GJ. 2000. Artificial pressure trends in the NCEP-NCAR reanalysis over the Southern Ocean and Antarctica. Journal of Climate, 13: 3940‒3952.
- Ho M, Kiem AS, and Verdon-Kidd DC. 2012. The Southern Annular Mode: a comparison of indices. Hydrological Earth System Science, 16: 967‒982.
- Jones JM, et al. 2009. Historical SAM variability. Part I: Century-length seasonal reconstructions. Journal of Climate, 22: 5319‒5345.
- Marshall GJ. 2007. Half-century seasonal relationships between the Southern Annular Mode and Antarctic temperatures. International Journal of Climatology, 27: 373‒383.
- Marshall GJ, and Harangozo SA. 2000. An appraisal of NCEP/NCAR reanalysis MSLP data viability for climate studies in the South Pacific. Geophysical Research Letters, 27: 3057‒3060.
- Swart NC, Fyfe JC, Gillett N, and Marshall GJ. 2015. Comparing trends in the Southern Annular Mode and surface westerly jet. Journal of Climate, doi:10.1175/JCLI-D-15-0334.1.
- Thompson DWJ, et al. 2011. Signatures of the Antarctic ozone hole in Southern Hemisphere surface climate change. Nature Geoscience, 4: 741‒749.
- Trenberth KE, et al. 2007. Observations: Surface and Atmospheric Climate Change. In Climate Change 2007: The Physical Science Basis. Contribution of Working Group I to the Fourth Assessment Report of the Intergovernmental Panel on Climate Change [Solomon