Multivariate ENSO Index
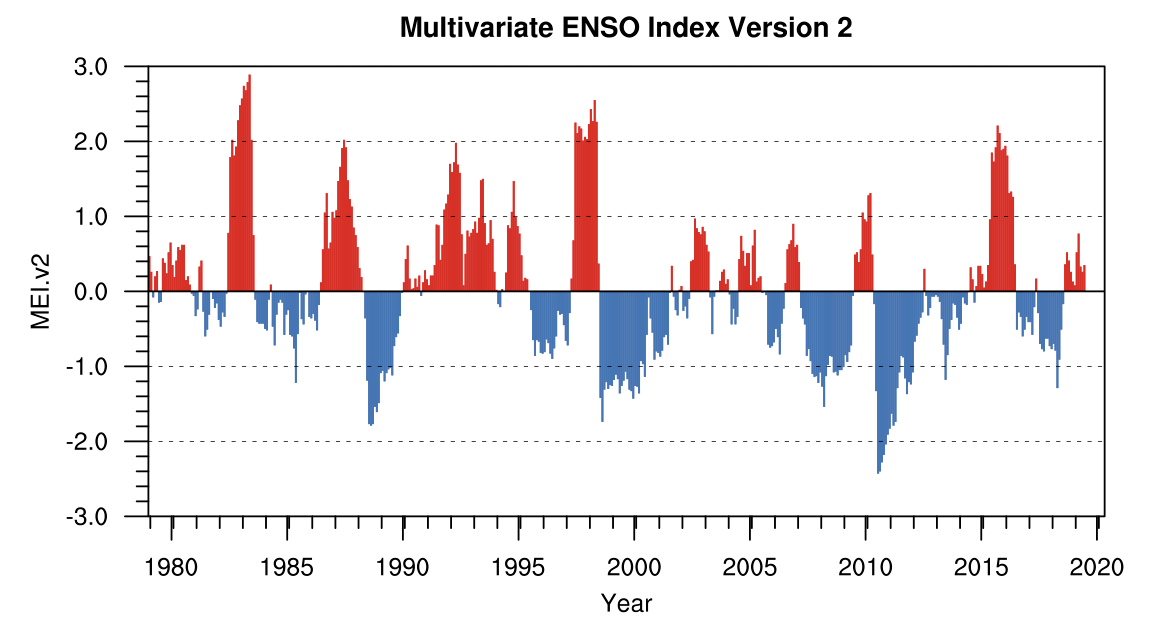
The Multivariate ENSO Index (MEI) is said to capture a more holistic representation of the atmospheric and oceanic anomalies that occur during ENSO events than do single-variables timeseries like the NinoSST indices. The MEIv2 is based on five variables from the tropical Pacific. These five variables are: sea-level pressure (P), zonal (U) and meridional (V) components of the surface wind, sea surface temperature (S), and outgoing longwave radiation (OLR). The MEI is computed separately for each of twelve sliding bi-monthly seasons (Dec/Jan, Jan/Feb,..., Nov/Dec). After spatially filtering the individual fields into clusters (Wolter, 1987), the MEI is calculated as the first unrotated Principal Component (PC) of all six observed fields combined. This is accomplished by normalizing the total variance of each field first, and then performing the extraction of the first PC on the co-variance matrix of the combined fields (Wolter and Timlin, 1993). In order to keep the MEI comparable, all seasonal values are standardized with respect to each season and to the 1980-2018 reference period. (http://www.esrl.noaa.gov/psd/enso/mei/)
Key Strengths
Captures a more holistic picture of the state of ENSO than do SST-based indices
Key Limitations
As it requires several variables, extending it back in time is more challenging than for SST-based indices
More complicated to calculate than single-variable SST indices
Cite this page
Acknowledgement of any material taken from or knowledge gained from this page is appreciated:
National Center for Atmospheric Research Staff (Eds). Last modified "The Climate Data Guide: Multivariate ENSO Index.” Retrieved from https://climatedataguide.ucar.edu/climate-data/multivariate-enso-index on 2026-05-21.
Citation of datasets is separate and should be done according to the data providers' instructions. If known to us, data citation instructions are given in the Data Access section, above.
Acknowledgement of the Climate Data Guide project is also appreciated:
Schneider, D. P., C. Deser, J. Fasullo, and K. E. Trenberth, 2013: Climate Data Guide Spurs Discovery and Understanding. Eos Trans. AGU, 94, 121–122, https://doi.org/10.1002/2013eo130001
Key Figures
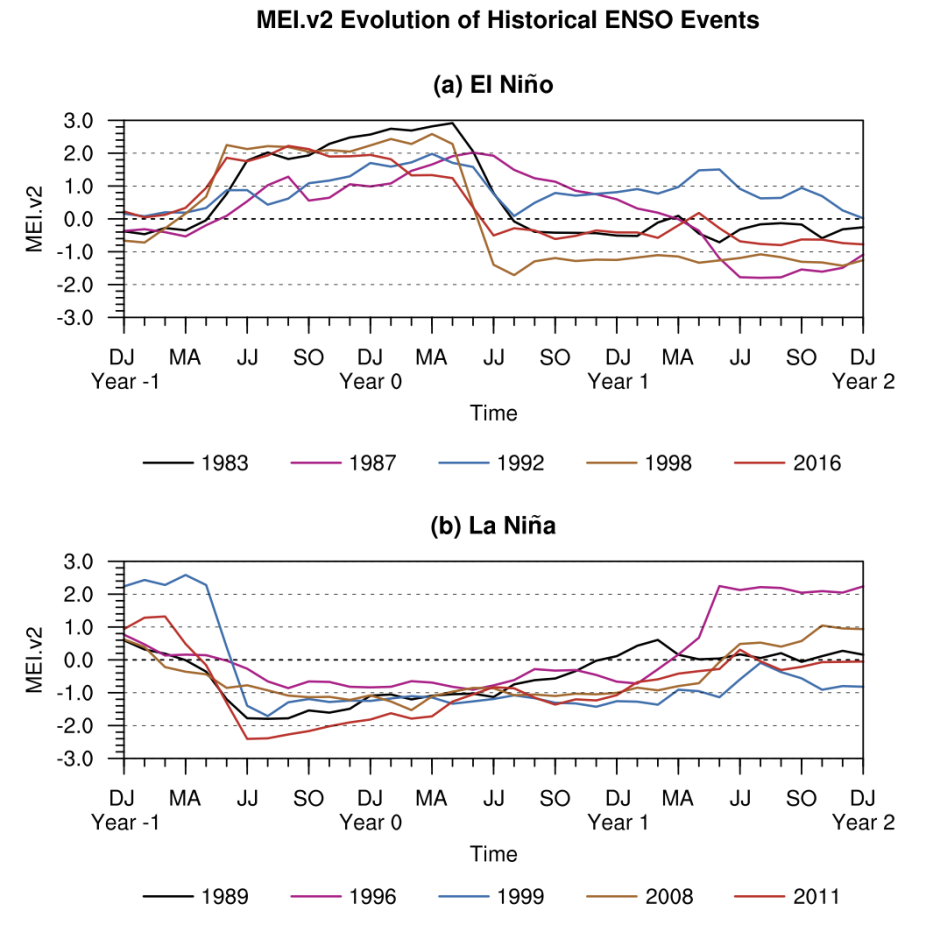
Evolution of ENSO events as idicated by the MEI. El Nino (top panel) and La Nina (bottom panel). Figure from https://www.esrl.noaa.gov/psd/enso/mei/
Correlation coefficients between the MEI and its 5 input variables for the March-April season. Figure from https://www.esrl.noaa.gov/psd/enso/mei/
Other Information
- Wolter, K., 1987: The Southern Oscillation in surface circulation and climate over the tropical Atlantic, Eastern Pacific, and Indian Oceans as captured by cluster analysis. J. Climate Appl. Meteor., 26, 540-558
- Wolter, K., and M. S. Timlin, 2011: El Niño/Southern Oscillation behaviour since 1871 as diagnosed in an extended multivariate ENSO index (MEI.ext). Intl. J. Climatology, 31, 14pp.
- Wolter, K., and M. S. Timlin, 1998: Measuring the strength of ENSO events - how does 1997/98 rank
- Weather, 53, 315-324
- Wolter, K., and M.S. Timlin, 1993: Monitoring ENSO in COADS with a seasonally adjusted principal component index. Proc. 17th Climate Diagnostics Wkshop, Norman, OK, NOAA/NMC/CAC, NSSL, Oklahoma Clim. Survey, CIMMS and the School of Meteor.