NCAR Sea Level Pressure
NCAR Sea Level Pressure is a gridded analysis of SLP based on land station reports, covering 1899 to present for latitudes 30°N-90°N. Quality controlled raw data plus empirical corrections for changes in instrumentation and station location.
Key Strengths
One of only a few long-term, continuous records of SLP that is regularly updated
Analyzed fields that take into account observed winds, clouds, and other weather variables (unlike HadSLP2)
Includes observations from land (unlike ICOADS)
Key Limitations
Covers only the mid-high latitudes of the Northern Hemisphere; some data from 30°N to 15°N, but these are suspect
Many changes in source data, with some periods of missing data
Analyses of decadal variability and trends should compare the SLP data with related physical variables
Expert User Guidance
One of the few sets of instrumental data covering a substantial fraction of the globe for a long period is the series of Northern Hemisphere sea-level pressure grids beginning in 1899. Daily data are available, but the monthly mean values are more widely used, in part because they have been "corrected" by Trenberth and Paolino (1980, hereafter TP80). Values are available every 5° of latitude and longitude from 15°N to the pole, although prior to 1946 data are missing at high latitudes and values along 15°N are only available in recent decades (see spatial coverage maps). The availability of sea level pressure data over land is an advantage over other historical, instrumental data sets, such as the Comprehensive Ocean Atmosphere Data Set (COADS).
It is important to understand that the grid point data originate from several sources, and also that the data are "analyzed" (i.e., other variables, especially surface winds, are taken into account and grid-scale noise is minimized).The changes in source and corresponding analysis techniques introduce discontinuities, and there are also a large number of erroneous data points. TP80 identified, catalogued, and corrected many of these flaws, which were noted in several earlier studies too (van Loon and Williams 1976a,b; Madden 1976; Williams and van Loon 1976). If TP80 could not apply reasonable corrections, individual grid point values were assigned missing values. This accounts for some of the features in the spatial coverage maps. Many of the errors identified by TP80 were prior to 1922, especially over Asia (5°-120°E) and at all longitudes south of 25°N and north of 70°N. Erroneous grid points were also relatively more pronounced over the Pacific than over North America and the Atlantic.
The user of these data should realize that the detailed analysis of TP80 caught and corrected the most severe problems in the data; however, as with any quality control procedure, less obvious problems were neither identified nor corrected. While sea level pressure, in contrast to precipitation or temperature, is a fairly robust atmospheric parameter (e.g., it is not sensitive to changes in station site), caution should be used, especially when estimating small signals relative to interannual variations, such as trends. Caution is especially needed when the period of interest is prior to the mid-1920s.
If the user of these data is interested in decadal or longer-term climate variability, a recommended approach is to check for physical and dynamical consistency between changes of several climate variables. The atmospheric circulation forms the main link between regional changes in wind, temperature, precipitation and other climatic variables, and there is likely to be a strong relationship between these on monthly and longer time scales. Consistency between several variables can add confidence to results for a single variable that might otherwise be compromised by measurement, data coverage, or analysis uncertainties (see, for instance, Trenberth and Hurrell 1994).
The NCEP reanalyses provide an alternative to these historical data for the period since 1948. A rigorous comparison between the two has not been carried out, but the poor use of surface data in the NCEP system and the quality control of TP80 are two reasons why I prefer the historical gridded data when the region of interest is the Northern Hemisphere extratropics.
James Hurrell, NCAR, June, 2001 ###
Expert Developer Guidance
Before the days of NWP, the 3 or 6 hourly sea level pressure chart was the primary tool used by weather forecasters. Plotted data included winds, clouds, current and past weather etc., and so it resulted in much more than just a map of sea level pressure but it was a summary of all the weather, especially fronts, on a single map. The analysis made careful use of all these data, and especially surface winds and not just sea level pressures. In this respect, these analyses are much better than anything than can be produced out of analyses of sea level pressure alone, no matter what the technique. This includes products from COADS.
I believe these are the best fields available prior to about 1950 and very likely prior to 1979. The main competitor now might be the NCEP reanalyses. These have the advantage of a first guess from NWP that uses data at all levels, but NWP tends not to put a lot of weight on surface data. Single level data, such as from ships, are not well assimilated. Therefore it is not obvious a priori that the reanalyses should be better, and instead there are reasons why they may not be better.
The main disadvantage of these analyses is that they do not extend south of 20N and the data on the southern edge near 20 to 25N may be suspect. The characteristics and shortcomings of the data are otherwise described in the publications.
Kevin Trenberth, NCAR, May, 2001 ###
Cite this page
Acknowledgement of any material taken from or knowledge gained from this page is appreciated:
Hurrell, James &, Trenberth, Kevin & National Center for Atmospheric Research Staff (Eds). Last modified "The Climate Data Guide: NCAR Sea Level Pressure.” Retrieved from https://climatedataguide.ucar.edu/climate-data/ncar-sea-level-pressure on 2026-07-15.
Citation of datasets is separate and should be done according to the data providers' instructions. If known to us, data citation instructions are given in the Data Access section, above.
Acknowledgement of the Climate Data Guide project is also appreciated:
Schneider, D. P., C. Deser, J. Fasullo, and K. E. Trenberth, 2013: Climate Data Guide Spurs Discovery and Understanding. Eos Trans. AGU, 94, 121–122, https://doi.org/10.1002/2013eo130001
Key Figures
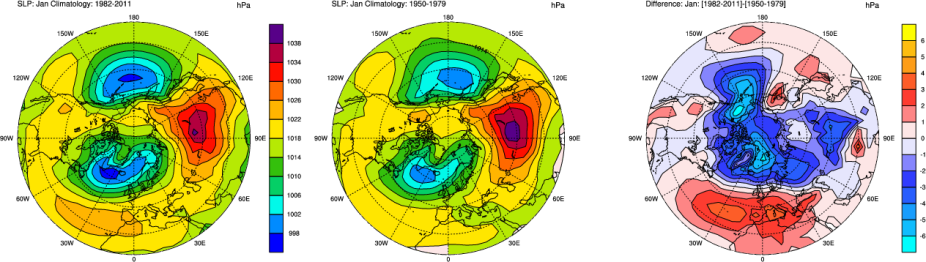
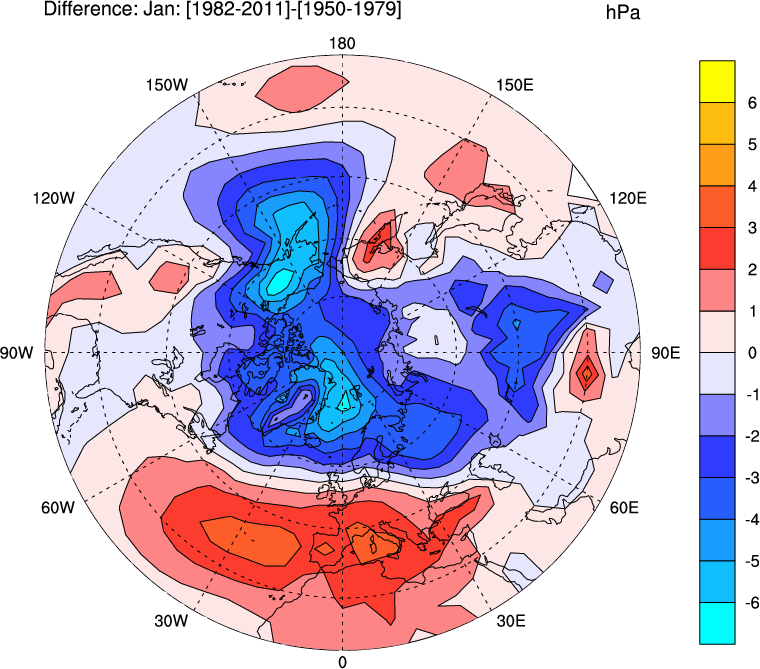
January SLP climatologies for (1982-2011; left) and (1950-1979; center); Differences (right) between the two climatologies [1982-2011] - [1950-1979]. (Climate Data Guide; D. Shea)
Other Information
- Trenberth, K.E., and D.A. Paolino, 1980: The Northern Hemisphere Sea-Level Pressure Data Set: Trends, Errors and Discontinuities.Mon. Wea. Rev., 108, 855--872.
- Trenberth, K.E., and D.A. Paolino 1981: Characteristic Patterns of Variability of Sea Level Pressure in the Northern Hemisphere.Mon. Wea. Rev., 109.1169--1189.
- Trenberth, K. E., and W-T K. Shin, 1984: Quasibiennial fluctuations in sea level pressures over the Northern Hemisphere. Mon. Wea. Rev., 112, 761--777.
- Christy, J. R., and K. E. Trenberth, 1985: Hemispheric interannual fluctuations in the distribution of atmospheric mass. J. Geophys. Res.,90, 8053--8066.
- Trenberth, K.E., and D.J. Shea, 1987: On the evolution of the Southern Oscillation. Mon. Wea. Rev., 115, 3078--3096.
- Trenberth, K.E., 1990: Recent observed interdecadal climate changes in the Northern Hemisphere. Bull. Amer. Meteor. Soc., 71, 988--993.