Atlantic Multi-decadal Oscillation (AMO) and Atlantic Multidecadal Variability (AMV)
The Atlantic Multi-decadal Oscillation (AMO) has been identified as a coherent mode of natural variability occurring in the North Atlantic Ocean with an estimated period of 60-80 years. It is based upon the average anomalies of sea surface temperatures (SST) in the North Atlantic basin, typically over 0-80N.
To remove the signal of long-term change from the AMO index, users typically detrend the SST data at each gridpoint or detrend the spatially averaged timeseries. Trenberth and Shea (2006) recommend that this be done by subtracting the global-mean SST anomaly timeseries from the spatially averaged timeseries. See the Expert Guidance by Dr. Kevin Trenberth for the rationale for the global-mean detrending approach.
A recent paper, Deser and Phillips (2021), has a more extensive discussion of how to define the unforced AMO/AMV in a changing climate.
The Expert Guidance by Dr. Rong Zhang discusses the impacts and mechanisms of the AMO.
Key Strengths
The SST-based AMO index provides a simple, concise way to describe multidecadal climate variability in the North Atlantic
Associated with important climate impacts, such as the multidecadal variability of Atlantic Hurricane activity, North American and European summer climate, northern hemispheric mean surface temperature, and Arctic sea ice anomalies
The AMO pattern is robust across different datasets (i.e. HadISST, ERSST, Kapan SST)
Key Limitations
Instrumental SST data are short in length compared to the multidecadal timescale of the AMO
The SST-based AMO index does not directly capture aspects of the AMO related to coherent variations in salinity, subsurface temperature and ocean-driven turbulent heat fluxes
Quantifying the relative importance of large scale ocean circulation (especially AMOC) vs. external radiative forcing in causing the AMO is challenging
- AMO Index monthly (10-yr lowpass) based on Trenberth and Shea (2006), HadISST1
Missing Value
-999Units
degCUpdated Through
2021-03-01Next Update
2022-03-01Start Date
1870-01-01File Notes
HadISST1 is the input SST dataset. The anomalies are with respect to the entire time period (1870-present). The Trenberth and Shea (2006) method has been applied to the monthly data. A 10-year running mean is applied to the monthly AMO Index to form the low-pass index. Due to the smoothing, missing values occur near the beginning and end of the low-pass index. This index will only be updated occasionally (approximately yearly).CAS Citation
AMO Index Data provided by the Climate Analysis Section, NCAR, Boulder, USA, Trenberth and Shea (2006). Updated yearly. Accessed DD Month YYYY [list date you accessed the data]. - AMO Index monthly (raw) based on Trenberth and Shea (2006), HadISST1
Missing Value
-999Units
degCUpdated Through
2021-03-01Next Update
2022-03-01Start Date
1870-01-01File Notes
HadISST1 is the input dataset Trenberth and Shea (2006) method has been applied Anomalies, in degC, are relative to the entire time period of the input dataset. This index will only be updated occasionally (approximately yearly).CAS Citation
AMO Index Data provided by the Climate Analysis Section, NCAR, Boulder, USA, Trenberth and Shea (2006). Updated yearly. Accessed DD Month YYYY [list date you accessed the data].
Expert User Guidance
The following was contributed by Dr. Rong Zhang, March, 2016:
The observed large-scale multidecadal fluctuations in the Atlantic sea surface temperature (SST), has been referred to as the Atlantic Multidecadal Oscillation (AMO) (Kerr, 2000) to emphasize the “multidecadal” character of this oceanic phenomenon and to distinguish it from the inter-annual variability associated with the atmospheric North Atlantic Oscillation (NAO) (Enfield et al. 2001). The AMO index is defined as an area average of detrended low-pass filtered North Atlantic SST anomalies to reflect the Atlantic low frequency variability at time scales longer than a decade (Enfield et al., 2001; Sutton and Hodson, 2005; Knight et al 2005; Ruiz-Barradas et al., 2013).
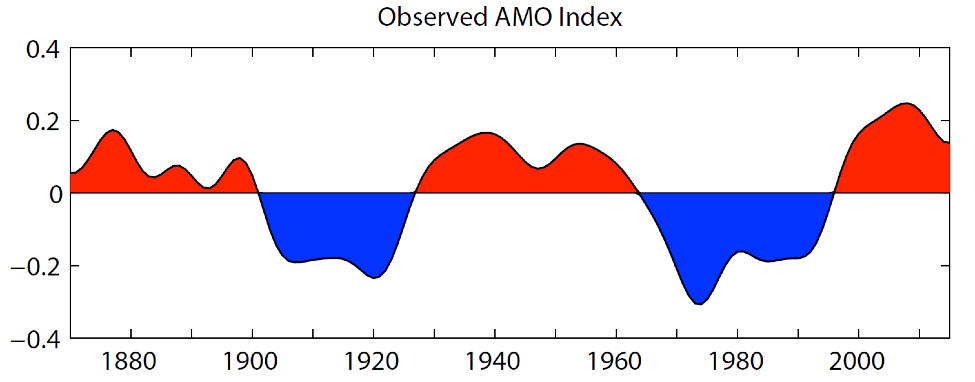
The AMO pattern (Figure 2a) is derived by regressing detrended SST anomalies on the AMO index (Figure 1) (Sutton and Hodson, 2005; Knight et al., 2005; Ruiz-Barradas et al., 2013). The positive AMO phase corresponds with positive SST anomalies over most of the North Atlantic, with stronger anomalies in the subpolar region and weaker anomalies in the tropics (Figure 2a). The warm AMO phases occurred during the middle of the 20th century and the recent decades since 1995, and cold phases occurred during the early 20th century and during 1964-1995 (Figure 1). The monopolar AMO pattern associated with this multidecadal variability should be distinguished from the tripolar SST pattern induced by the NAO at the inter-annual time scale (Figure 2b), and hence the AMO pattern should not be derived by regressing on the detrended “unfiltered” North Atlantic basin averaged SST index (see Figure 2).
The AMO has significant regional and hemispheric climate impacts, such as modulating multidecadal variations in U.S. rainfall and drought frequency (Enfield et al., 2001; McCabe et al. 2004), summer climate over North America and Europe (Sutton and Hodson, 2005, 2007; Sutton and Dong, 2012), Atlantic Hurricane activity and India/Sahel summer rainfall (Folland et al., 1986; Goldenberg et al. 2001; Knight et al., 2006; Zhang and Delworth, 2006; Latif et al., 2007), northern hemispheric mean surface temperature (Zhang et al. 2007; Semenov et al., 2010), and Arctic sea ice (Mahajan et al. 2011; Day et al. 2012; Miles et al. 2014; Zhang, 2015; Yeager et al. 2015). Zhang and Delworth (2007) found that the AMO can contribute to the Pacific Decadal Oscillation (PDO) and the associated Pacific/North America (PNA) pattern at the multidecadal time scale, and suggested that a North Pacific regime shift (opposite to the 1976–77 shift) might occur several years after the mid 90’s shift in the observed AMO. The AMO is also found to have had a substantial influence on the equatorial Pacific decadal variability (Kucharski et al. 2015) and have modulated the El Niño Southern Oscillation (ENSO) variability at low frequency (Dong and Sutton, 2007; Kang et al. 2014). Observational and modeling studies suggest that multidecadal variations of the atmospheric NAO are modulated by the AMO, with the positive AMO phase leading the negative winter NAO phase by a few years (Gastineau and Frankignoul, 2012; Hodson et al. 2014). Recent modeling studies show that the simulated multidecadal winter NAO response to the AMO can be significantly improved by resolving the stratosphere and enhancing stratosphere/troposphere coupling (Omrani et al., 2014, 2016).
The AMO is often thought to be driven by the variability of the Atlantic Meridional Overturning Circulation (AMOC) (Kushnir, 1994; Delworth and Mann, 2000; Knight et al., 2005; Latif et al., 2006), although some have suggested that the AMO is mainly driven by changes in anthropogenic radiative forcing (Mann and Emanuel, 2006). Various approaches have been proposed for the quantitative attribution of the AMO to an anthropogenic radiatively forced part and a part arising from natural variability (Trenberth and Shea, 2006; Kravtsov and Spannagle, 2008; Ting et al. 2009; DelSole et al. 2011; Wu et al. 2011). Recently it has been suggested that anthropogenic aerosols are a prime driver of the AMO using climate model simulations incorporating aerosol indirect effects (Booth et al., 2012). However, there are major discrepancies between the simulations in Booth et al. (2012) and observations in the North Atlantic upper-ocean heat content, in the spatial pattern of multidecadal SST changes within and outside the North Atlantic, and in the subpolar North Atlantic sea surface salinity (SSS), due to overestimated aerosol indirect effects (Zhang et al. 2013). Besides, the aerosol effects cannot account for the observed anticorrelation between detrended multidecadal surface and subsurface temperature variations in the tropical North Atlantic. These discrepancies cast considerable doubt on the claim that aerosols drive the bulk of the AMO. On the other hand, independent AMOC fingerprints derived from the observed subsurface ocean temperature indicate that the past AMOC variations are coherent with the observed AMO (Zhang, 2007, 2008; Wang and Zhang, 2013), bringing more evidence that the observed AMO is linked to AMOC variations rather than merely a 20th century artifact of changes in radiative forcing.
The SST-based definition of the AMO index often leads to the incomplete understanding of the AMO only in terms of North Atlantic SST anomalies. In contrast, the AMO actually reflects coherent multivariate low frequency variability observed in the Atlantic, including correlated variations in the subpolar North Atlantic heat content, salt content, and ocean-driven surface turbulent heat fluxes, as well as anticorrelated variations in the tropical North Atlantic subsurface temperature (Zhang 2007, 2008; Wang et al. 2010, Robson et al. 2012; Zhang et al. 2013; Gulev et al. 2013; Wang and Zhang, 2013). Mechanisms proposed for the AMO have to account for the observed coherent multivariate low frequency variability in the Atlantic, in addition to the low frequency North Atlantic SST variations. It is crucial to use multivariate metrics to understand the mechanisms causing the AMO.##
Expert Developer Guidance
The following was contributed by Dr. Kevin Trenberth, August, 2015:
The increasing human influence on climate, mainly through changes in atmospheric composition, produce global warming. Many variables and climate indices are therefore influenced by associated climate changes and any analysis of variance can be dominated by the recent trends. It is therefore desirable to remove the trends to examine the underlying variability and associated patterns. One approach has been to fit a linear trend to a time series of an index, but this is a seriously flawed procedure because (i) it depends on the length of the time series; (ii) it implies the trend goes on indefinitely into the future and into the past; and (iii) there is no such trend evident in the earlier part of the 20th Century. A relatively simple approach instead is to use the global mean time series as a primary indicator of the non-stationary component, and remove that from each grid point prior to carrying out an analysis. This approach has been shown to work effectively by using model results, where the cause of the non-stationarity is known. A good example is the AMO, which is based on an index of area average SST over the North Atlantic from 0 to 60N (see Trenberth and Shea (2006)). The PDO is also derived from SSTs where the global mean has been removed, and a determination of the first mode of variability for 20-70N over the North Pacific (see Trenberth and Fasullo (2013)).##
Cite this page
Acknowledgement of any material taken from or knowledge gained from this page is appreciated:
Trenberth, Kevin &, Zhang, Rong & National Center for Atmospheric Research Staff (Eds). Last modified "The Climate Data Guide: Atlantic Multi-decadal Oscillation (AMO) and Atlantic Multidecadal Variability (AMV).” Retrieved from https://climatedataguide.ucar.edu/climate-data/atlantic-multi-decadal-oscillation-amo on 2026-07-10.
Citation of datasets is separate and should be done according to the data providers' instructions. If known to us, data citation instructions are given in the Data Access section, above.
Acknowledgement of the Climate Data Guide project is also appreciated:
Schneider, D. P., C. Deser, J. Fasullo, and K. E. Trenberth, 2013: Climate Data Guide Spurs Discovery and Understanding. Eos Trans. AGU, 94, 121–122, https://doi.org/10.1002/2013eo130001
Key Figures

Observed AMO index, defined as detrended 10-year low-pass filtered annual mean area-averaged SST anomalies over the North Atlantic basin (0N-65N, 80W-0E), using HadISST dataset (Rayner et al. 2003) for the period 1870-2015. (Created by Dennis Shea and Dr Rhong Zhang for the Climate Data Guide)
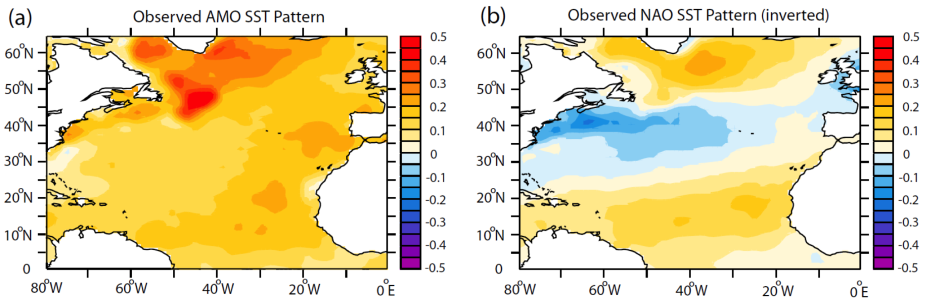
(a) Observed AMO SST pattern, derived by regressing detrended North Atlantic annual mean SST anomalies on the observed AMO index (Figure 1), using HadISST dataset (Rayner et al. 2013) for the period 1870-2015. The regression corresponds to 1 standard deviation of the observed AMO index. (b) Observed NAO SST pattern (inverted), derived by regressing detrended North Atlantic annual mean SST anomalies (HadISST dataset) on the inverted detrended observed winter NAO index (Hurrell Station-Based DJFM NAO Index) for the period 1870-2015. The regression corresponds to 1 standard deviation of the inverted observed NAO index. (Created by Dr Rhong Zhang for the Climate Data Guide)
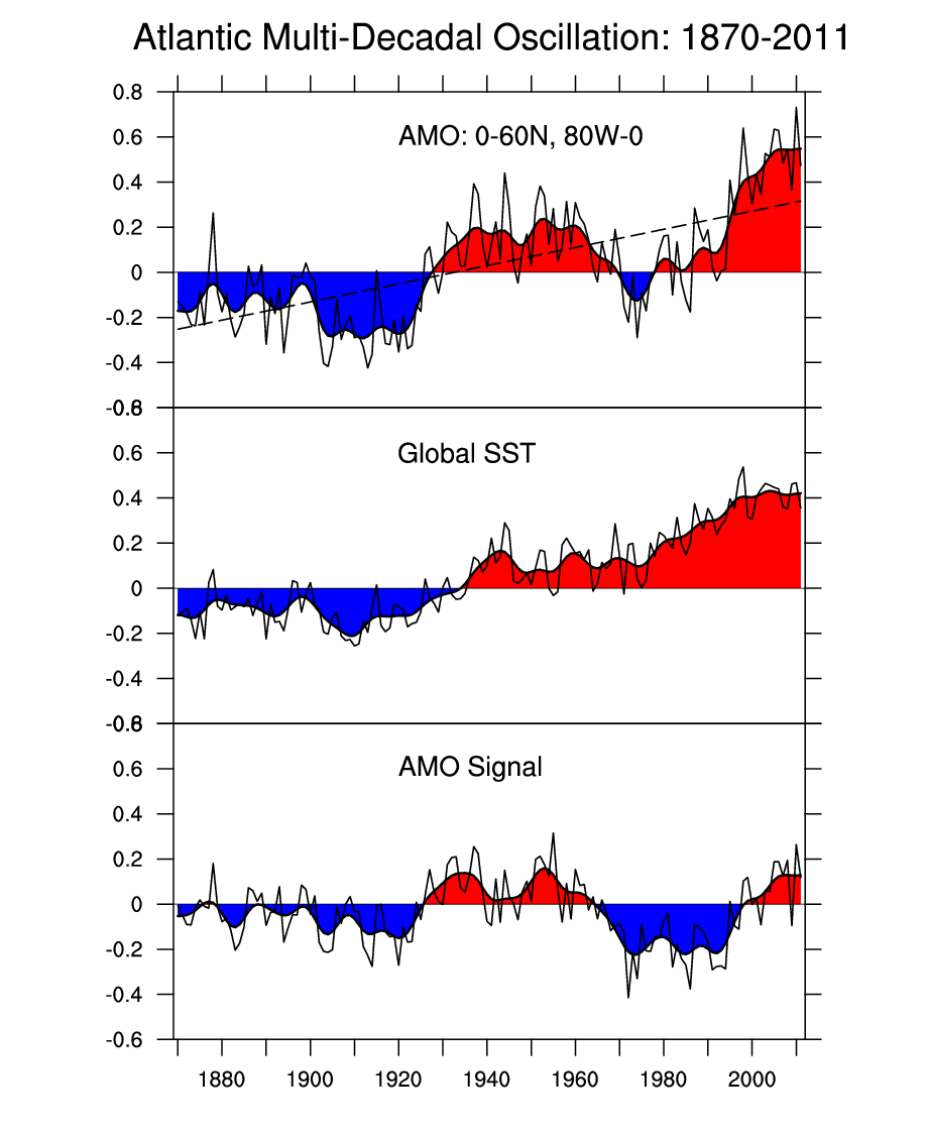
Atlantic Multi-decadal Oscillation (AMO) 1870-2011 derived from HadISST and using the Trenberth and Shea (2006) definition. [Climate Data Guide; D. Shea]
Other Information
- Booth, B. B. B., N. J. Dunstone, P. R. Halloran, T. Andrews, and N. Bellouin, 2012, Aerosols implicated as a prime driver of twentieth-century North Atlantic climate variability. Nature, 484, 228–232.
- Day, J. J., J. C., Hargreaves, J. D., Annan, A., Abe-Ouchi, 2012, Sources of multi-decadal variability in Arctic sea ice extent. Environ. Res. Lett., 7, 034011.
- DelSole, T., M. K. Tippett, J. Shukla, 2011, A significant component of unforced multidecadal variability in the recent acceleration of global warming. J. Climate, 24, 909–926.
- Delworth, T. L., and M. E. Mann, 2000, Observed and simulated multidecadal variability in the Northern Hemisphere. Clim. Dyn., 16, 661–676.
- Deser, C., and A. S. Phillips, 2021: Defining the Internal Component of Atlantic Multidecadal Variability in a Changing Climate. Geophysical Research Letters, 48, https://doi.org/10.1029/2021gl095023.
- Dong, B., R. T. Sutton, and A. A. Scaife, 2006: Multidecadal modulation of El Niño–Southern Oscillation (ENSO) variance by Atlantic Ocean sea surface temperatures. Geophys. Res. Lett., 33, L08705, doi:10.1029/2006GL025766.
- Enfield, D.B., A.M. Mestas-Nunez, and P.J. Trimble, 2001: The Atlantic Multidecadal Oscillation and its relationship to rainfall and river flows in the continental U.S., Geophys. Res. Lett., 28: 2077-2080
- Folland, C. K., T. N. Palmer, and D. E. Parker, 1986, Sahel rainfall and worldwide sea temperatures. Nature, 320, 602–607.
- Gastineau, G., and C. Frankignoul, 2012, Cold-season atmospheric response to the natural variability of the Atlantic meridional overturning circulation. Climate Dyn., 39, 37–57.
- Gastineau, G., and C. Frankignoul, 2012, Cold-season atmospheric response to the natural variability of the Atlantic meridional overturning circulation. Climate Dyn., 39, 37–57.
- Goldenberg, S. B., C. W. Landsea, A. M. Mestas-Nuñez, and W. M. Gray, 2001, The recent increase in Atlantic hurricane activity: Causes and implications. Science, 293, 474–479.
- Gulev, S. K., M. Latif, N. Keenlyside, W. Park, K. P. Koltermann, 2013, North Atlantic Ocean control on surface heat flux on multidecadal timescales, Nature, 499, 464-467.
- Hodson, D. L. R., J. I. Robson, and R. T. Sutton, 2014, An anatomy of the cooling of the North Atlantic Ocean in the 1960s and 1970s, J. Clim., 27, 8229–8243.
- Kang, I. S., H-H. No, F. Kucharski, 2014, ENSO amplitude modulation associated with the mean SST changes in the tropical central pacific induced by atlantic multidecadal oscillation. J. Clim., 27:7911–7920
- Kerr, R. A., 2000, "A North Atlantic climate pacemaker for the centuries". Science 288, 1984–1986.
- Knight, J. R., R. J. Allan, C. K. Folland, M. Vellinga, and M. E. Mann, 2005, A signature of persistent natural thermohaline circulation cycles in observed climate, Geophys. Res. Lett., 32, L20708
- Knight, J. R., C. K. Folland, and A. A. Scaife, 2006, Climate impacts of the Atlantic Multidecadal Oscillation, Geophys. Res. Lett., 33, L17706
- Kravtsov, S., and C. Spannagle, 2008, Multi-decadal climate variability in observed and simulated surface temperatures. J. Climate, 21, 1104–1121.
- Kucharski, F., F. Ikram, F. Molteni, R. Farneti, I. S. Kang, H-H. No, M. P. King, G. Giuliani, K. Mogensen, 2015, Atlantic forcing of Pacific decadal variability, Clim. Dyn.
- Kushnir, Y., 1994, Interdecadal variations in the North Atlantic sea surface temperature and associated atmospheric conditions, J. Clim. 7, 141-157.
- Latif, M., M. Collins, H. Pohlmann, and N. Keenlyside, 2006, A review of predictability studies of the Atlantic sector climate on decadal time scales. J. Climate, 19, 5971-5987.
- Latif, M., N. Keenlyside, and J. Bader, 2007, Tropical sea surface temperature, vertical wind shear, and hurricane development. Geophys. Res. Lett., 34, L01710
- Mahajan S, Zhang R, T. L. Delworth, 2011, Impact of the Atlantic Meridional Overturning Circulation (AMOC) on Arctic surface air temperature and sea-ice variability. J. Clim., 24, 6573–6581.
- Mann, M. E., and K. A. Emanuel, 2006, Atlantic hurricane trends linked to climate change, Eos Trans. AGU, 87(24), doi:10.1029/2006EO240001.
- McCabe, G., M. A. Palecki, and J. Betancourt, 2004, Pacific and Atlantic Ocean influences on multidecadal drought frequency in the United States, PNAS, 101, 4136-4141
- Miles, M. W., D. V. Divine, T. Furevik, E. Jansen, M. Moros, and A. E. J. Ogilvie, 2014, A signal of persistent Atlantic multidecadal variability in Arctic sea ice, Geophys. Res. Lett., 41, 463–469
- Omrani, N.-E., N. S. Keenlyside, J. Bader, and E. Manzini, 2014, Stratosphere key for wintertime atmospheric response to warm Atlantic decadal conditions, Clim. Dyn., 42, 649–663.
- Omrani, N.-E., J. Bader, N. S. Keenlyside, and E. Manzini, 2016, Troposphere–stratosphere response to large-scale North Atlantic Ocean variability in an atmosphere/ocean coupled model, Clim. Dyn., 46, 1397–1415
- Rayner, N. A., D. E. Parker, E. B. Horton, C. K. Folland, L. V. Alexander, D. P. Rowell, E. C. Kent, and A. Kaplan, 2003, Global analyses of sea surface temperature, sea ice, and night marine air temperature since the late nineteenth century. J. Geophys.
- Robson, J., R. Sutton, K. Lohmann, D. Smith, M. Palmer, 2012, Causes of the Rapid Warming of the North Atlantic Ocean in the Mid-1990s, J. Clim., 25, 4116-4134.
- Ruiz-Barradas, A., S. Nigam, and A. Kavvada, 2013, The Atlantic Multidecadal Oscillation in twentieth century climate simulations: uneven progress from CMIP3 to CMIP5, Clim. Dyn. 41, 3301-3315.
- Schlesinger, M.E. and Navin Ramankutty (1994): An oscillation in the global climate system of period 65-70 years. Nature, 367, Issue 6465, pp. 723-726
- Semenov V., M. Latif, D. Dommenget, N. Keenlyside, A. Strehz, T. Martin, and W. Park, 2010, The Impact of North Atlantic–Arctic Multidecadal Variability on Northern Hemisphere Surface Air Temperature, J. Clim., 23, 5668-5677.
- Sutton, R. T. and B. Dong, 2012, Atlantic Ocean influence on a shift in European climate in the 1990s, 5, 788-792.
- Sutton, R. T., and D. L. R. Hodson, 2005, Atlantic Ocean forcing of North American and European summer climate. Science, 309, 115–118
- Sutton, R. and D. Hodson, 2007, Climate response to basin-scale warming and cooling of the North Atlantic Ocean, Journal of Climate, 20, 891-907.
- Ting, M. F., Y. Kushnir, R. Seager and C. H. Li, 2009, Forced and Internal Twentieth-Century SST Trends in the North Atlantic. Journal of Climate, 22, 1469-1481.
- Trenberth, K.E. and D.J. Shea (2006): Atlantic hurricanes and natural variability in 2005. Geophysical Research Letters 33, L12704
- Trenberth, K. E., and J. T. Fasullo, 2013: An apparent hiatus in global warming? Earth's Future. Doi: 10.002/2013EF000165
- Wang, C., S. Dong, and E. Munoz, 2010, Seawater density variations in the North Atlantic and the Atlantic meridional overturning circulation. Climate Dynamics, 34, 953-968.
- Wang, C., and L. Zhang, 2013, Multidecadal ocean temperature and salinity variability in the tropical North Atlantic: Linking with the AMO, AMOC and subtropical cell. Journal of Climate, 26, 6137-6162
- Wu, Z., N. E. Huang, J. M. Wallace, B. Smoliak, and X. Chen, 2011, On the time-varying trend in global-mean surface temperature. Clim. Dyn., 37, 759–773
- Yeager, S. G., A. R. Karspeck, and G. Danabasoglu, 2015, Predicted slowdown in the rate of Atlantic sea ice loss, Geophys. Res. Lett., 42, 10,704–10,713
- Zhang, R., and T. L. Delworth, 2006, Impact of Atlantic multidecadal oscillations on India/Sahel rainfall and Atlantic hurricanes. Geophysical Research Letters, 33, L17712
- Zhang, R., 2007, Anticorrelated multidecadal variations between surface and subsurface tropical North Atlantic. Geophysical Research Letters, 34, L12713
- Zhang, R., and T. L. Delworth, 2007, Impact of the Atlantic Multidecadal Oscillation on North Pacific climate variability. Geophysical Research Letters, 34, L23708
- Zhang, R., T. L. Delworth, and I. M. Held, 2007, Can the Atlantic Ocean drive the observed multidecadal variability in Northern Hemisphere mean temperature? Geophysical Research Letters, 34, L02709
- Zhang, R., 2008, Coherent surface-subsurface fingerprint of the Atlantic meridional overturning circulation. Geophysical Research Letters, 35, L20705
- Zhang, R. and Coauthors, 2013, Have aerosols caused the observed Atlantic multidecadal variability? J. Atmos. Sci., 70, 1135–1144
- Zhang, R., 2015, Mechanisms for low-frequency variability of summer Arctic sea ice extent, PNAS, 112, 4570–4575