Sea Ice Thickness Data Sets: Overview & Comparison Table
While satellite observations of sea ice extent and concentration are available from 1979, long-term high quality (daily and high spatial resolution) observations of sea ice thickness remain limited as a result of few satellite and in situ observations. Reconstructions using numerous observational sources show a 65% decline in annual mean sea ice thickness in the central Arctic since the 1970s (Lindsay and Schweiger , 2015). Existing observations of sea ice thickness can differ through spatial and temporal coverage, measurement uncertainties, and methods of estimation. More recently, sea ice thickness data from ICESat, CryoSat-2 and ICESat-2 have been used to produce a combined 18-year record of sea ice volume, which showed a loss of one-third of the winter Arctic ice volume driven by a shift from multiyear to seasonal ice cover (Kacimi and Kwok, 2022).
Key Strengths
Sea ice thickness data is necessary for assessing sea ice mass balance, the surface energy budget, seasonal and annual sea ice prediction, and changes in the polar climate system
Total sea ice volume can be estimated through sea ice thickness and sea ice concentration
Key Limitations
Numerous uncertainties as a result of different methods, assumptions, and data sources
The spatial and temporal coverage of sea ice thickness have, until recently, prevented a consistent record of long-term change and variability
Methods for assessing snow depth on top of the sea ice (i.e. use of climatology) may lead to biases in sea ice thickness estimates
Expert User Guidance
The following was originally contributed by Zachary Labe in August, 2017. Updates were contributed by Rachel Tilling in May, 2023.
While satellite observations of sea ice extent and concentration are available from 1979, long-term high quality (daily and high spatial resolution) observations of sea ice thickness remain limited as a result of few satellite and in situ observations. Reconstructions using numerous observational sources show a 65% decline in annual mean sea ice thickness in the central Arctic since the 1970s (Lindsay and Schweiger , 2015). Existing observations of sea ice thickness can differ through spatial and temporal coverage, measurement uncertainties, and methods of estimation.
In the last two decades, satellite-based altimetry has improved our spatial and temporal coverage of sea ice thickness. Prior to these satellite observations, sparse sea ice thickness data are available from submarine upward looking sonar and moorings. These measure the depth of ice below the water level (draft), which can then be converted to ice thickness. Limited data is even available from 1947 in the Canadian Arctic Archipelago. Since the early 1990s satellite altimeters including ERS-1/ERS-2 (1993-2001), Envisat (2002-2012) and ICESat (2003-2009) have been used to estimate sea ice thickness, but their orbital coverage meant measurements were limited to the region of oldest, thickest ice in the Arctic Ocean. Currently, CryoSat-2 (2010-) and ICESat-2 (2018-) provide nearly pan-Arctic observations of sea ice thickness up to 88N. They also measure the sea ice in much finer detail than their predecessors. ICESat-2, for example, is able to detect individual photons form the sea ice surface, from an area as small as 11 m diameter. Altimetry-based estimates of sea ice thickness can be derived by measuring the height above the water level (freeboard), using snow and sea ice densities, estimating the snow depth on top of the ice, and assuming hydrostatic equilibrium.
Sources of error and uncertainty in altimeter sea ice thickness include: freeboard, snow depth, and the densities of sea ice and snow (Zygmuntowska et al., 2014). Of these, snow depth is the main contributor of uncertainty. Most satellite sea ice thickness data is not available during the melt season due to the formation of melt ponds, which complicate the satellite return signal.
Through these various observational data sets and methodological assumptions, sea ice thickness remains one of the more poorly observed variables in the Arctic. Sources of error and uncertainty in altimeter sea ice thickness include: freeboard, freeboard measurements, snow depth, and the and densitiesy ofestimates for sea ice and snow (Zygmuntowska et al., 2014). Of these, snow depth is the main contributor of uncertainty. Most satellite sea ice thickness data is not available during the melt season due to the formation of melt ponds, which complicate the satellite return signal.
New techniques are being developed to overcome uncertainties in sea ice thickness estimates from altimetry. A major advantage of having CryoSat-2 and ICESat-2 orbiting at the same time is the ability to directly estimate snow depth from their freeboard differences, rather than relying on outdated in situ measurements or model estimates (Kacimi and Kwok, 2022). This is possible because CryoSat-2 is a radar that reflects from the ice surface, and ICESat-2 is a lidar that reflects from the overlying snow surface. In 2020, the European Space Agency started their Cryo2Ice campaign, where the orbit of CryoSat-2 was shifted so it periodically aligns with ICESat-2, marking a huge international effort to further improve the accuracy of snow depth and sea ice thickness observations from space. Additionally, machine learning techniques have been applied to CryoSat-2 data to produce sea ice thickness estimates in summer (Landy et al., 2022). Satellites estimates of sea ice thickness can also be derived from brightness temperature, such as in the Soil Moisture and Ocean Salinity (SMOS) Mission.
As a result of the limited temporal and spatial estimates of sea ice thickness, ice-ocean models with data assimilation are also a useful tool in providing sea ice thickness “reanalysis.” The Pan-Arctic Ice-Ocean Modeling and Assimilation System (PIOMAS) is a coupled ice and ocean model with sea ice thickness data available over the satellite era (from 1979) (Zhang and Rothrock , 2003). PIOMAS has been widely validated against sea ice thickness data sets (such as ICESat), and its uncertainties are addressed in Schweiger et al.(2011). PIOMAS has the capabilities of assimilating sea surface temperatures, sea ice concentration, and sea ice velocity data. The model is driven by atmospheric surface forcings from daily mean NCEP-NCAR (R1) reanalysis.
The following list of data sets and links provide a starting point for using sea ice thickness data. Particularly, the “Unified Sea Ice Thickness Climate Data Record” is a comprehensive archive of various sea ice thickness observational data sets, which are available at a 50 km resolution from 1947 to 2017 (Lindsay, 2010). The archive identifies each data set type along with any associated uncertainty statistics and additional concise documentation.
The use of these data sets requires an understanding of the documentation and potential sources of error. For example, estimates of snow depth on the top of sea ice often use a climatology from Warren et al. (1999), which may not reflect the actual snow depth at the time of sea ice thickness estimation. Comparisons and validations between many of these sea ice thickness products can be found in recent studies (e.g., Stroeve et al., 2014; Wanget al., 2016).##
Key Figures
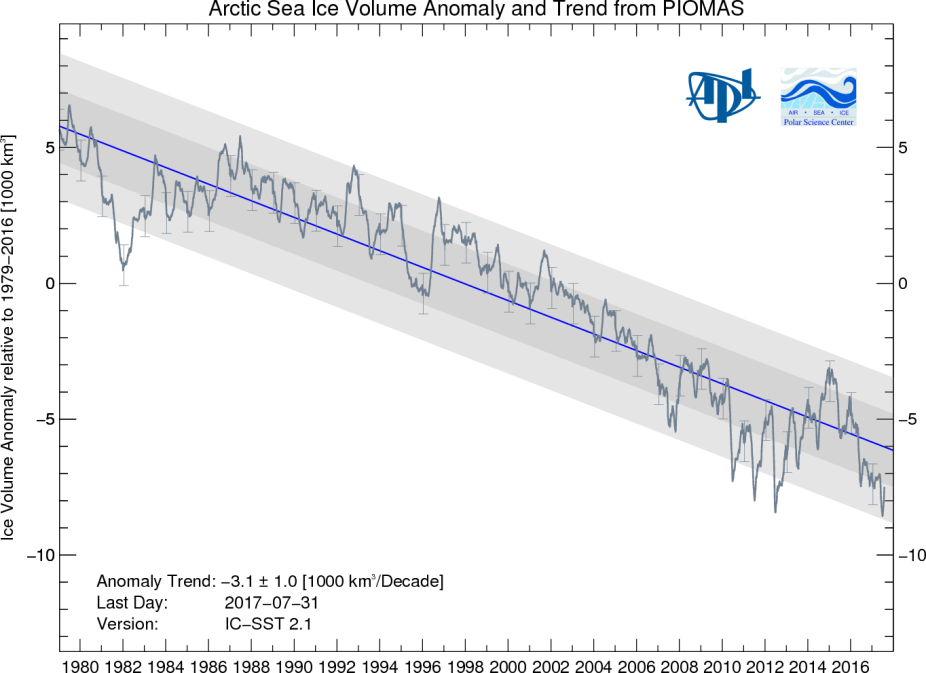
Sea ice volume anomalies in PIOMAS (Zhang and Rothrock , 2003) calculated from a 1979 to 2016 baseline. The linear trend is shown in blue. The shaded areas are highlighted for one and two standard deviations from the trend. Figure by the Polar Science Center at the University of Washington. (provided by Z Labe)
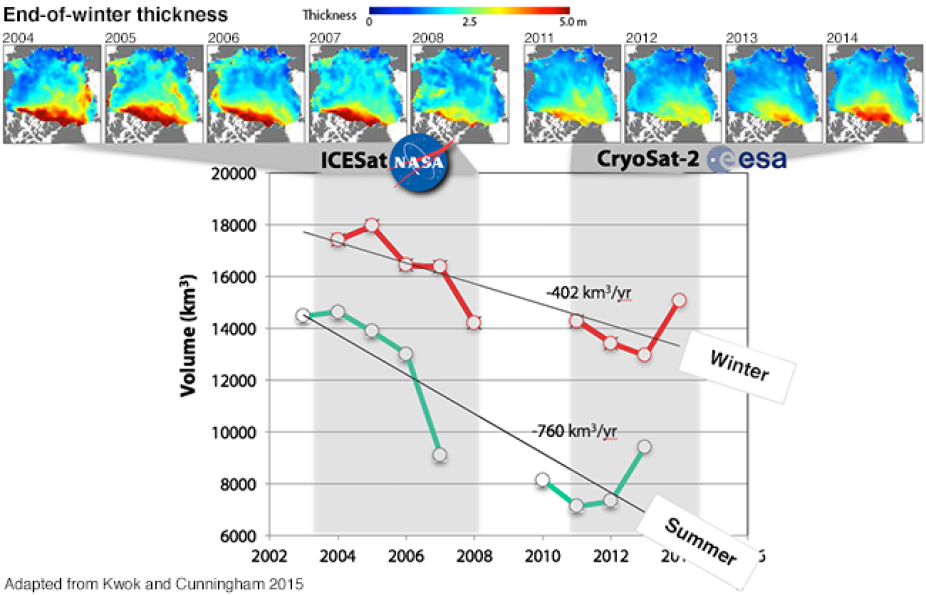
Winter Arctic sea ice thickness in ICESat (2004-2008) and CryoSat-2 (2011-2014) [top]. Sea ice volume in winter and summer along with corresponding trends for ICESat and CryoSat-2 [bottom]. Figure by Ron Kwok (Jet Propulsion Laboratory) and adapted from Kwok and Cunningham (2015). (provided by Z Labe)
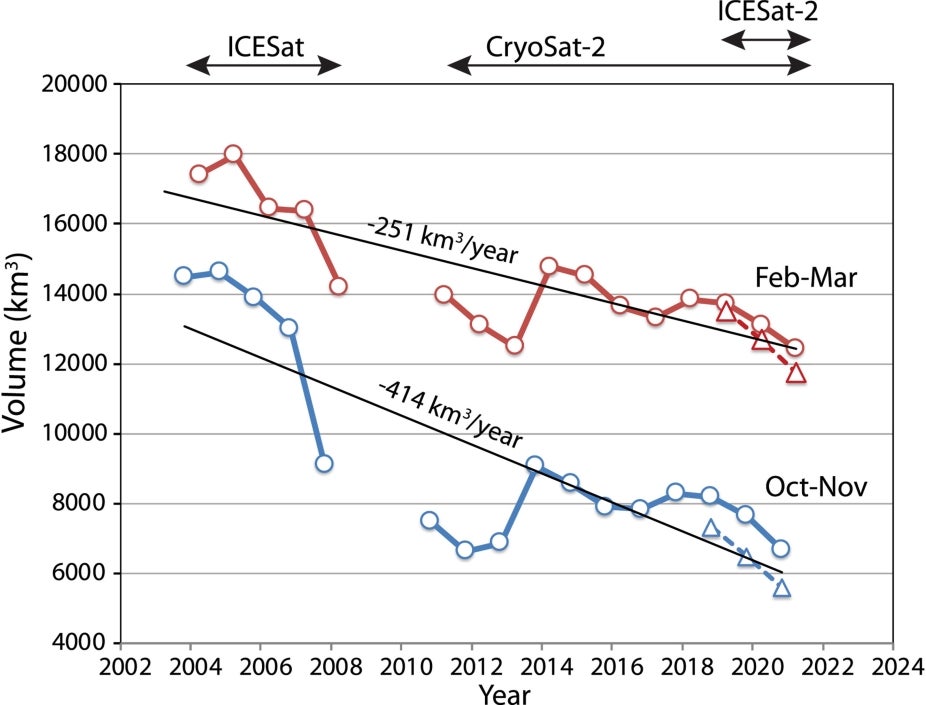
Arctic sea ice volume calculated from ICESat (2003–2008), CryoSat‐2 (2010–2021) and ICESat‐2 (2018–2021) sea ice thickness, for February–March (in red) and October–November (in blue). Also shown are ice volume using ice thickness estimates derived from satellite snow depths from differencing IS‐2 and CS‐2 freeboards (depicted by the triangles). From Kacimi et al. (2022). (contributed by R Tilling)
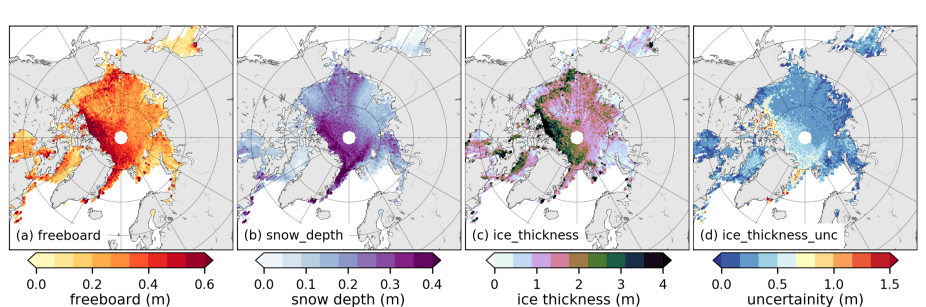
Monthly Arctic sea ice freeboard from ICESat-2, coincident NESOSIM model snow depths, and sea ice thickness for March 2019. From Petty et al. (2020). (provided by Rachel Tilling)
Other Information
varies
See Table below for numerous data sources and citation information.
- Kacimi, S., and Kwok, R. (2022). Arctic snow depth, ice thickness, and volume from ICESat-2 and CryoSat-2: 2018–2021. Geophysical Research Letters, 49, e2021GL097448. https://doi.org/10.1029/2021GL097448
- Kwok, R., and G. F. Cunningham (2015), Variability of Arctic sea ice thickness and vol- ume from CryoSat-2., Philosophical transactions. Series A, Mathematical, physical, and engineering sciences, 373 (2045), 20140,157–, doi:10.1098/rsta.2014.0157
- Landy, J.C., Dawson, G.J., Tsamados, M. et al. (2022). A year-round satellite sea-ice thickness record from CryoSat-2. Nature, 609, 517–522. https://doi.org/10.1038/s41586-022-05058-5
- Lindsay, R. (2010), New Unified Sea Ice Thickness Climate Data Record, Eos, Transactions American Geophysical Union, 91 (44), 405, doi:10.1029/2010EO440001
- Lindsay, R., and A. Schweiger (2015), Arctic sea ice thickness loss determined using subsur- face, aircraft, and satellite observations, The Cryosphere, 9 (1), 269–283, doi:10.5194/tc- 9-269-2015.
- Petty, A. A., N. T. Kurtz, R. Kwok, T. Markus, and T. A. Neumann (2020), Winter Arctic sea ice thickness from ICESat‐2 freeboards, Journal of Geophysical Research: Oceans, 125, e2019JC015764. https://doi.org/10.1029/2019JC015764)
- Schweiger, A., R. Lindsay, J. Zhang, M. Steele, H. Stern, and R. Kwok (2011), Uncertainty in modeled Arctic sea ice volume, Journal of Geophysical Research, 116 (C8), C00D06, doi:10.1029/2011JC007084.
- Schweiger, A., R. Lindsay, J. Zhang, M. Steele, H. Stern, and R. Kwok (2011), Uncertainty in modeled Arctic sea ice volume, Journal of Geophysical Research, 116 (C8), C00D06, doi:10.1029/2011JC007084.
- Stroeve, J., A. Barrett, M. Serreze, and A. Schweiger (2014), Using records from submarine, aircraft and satellites to evaluate climate model simulations of Arctic sea ice thickness, The Cryosphere, 8 (5), 1839–1854, doi:10.5194/tc-8-1839-2014.
- Wang, X., J. Key, R. Kwok, and J. Zhang (2016), Comparison of Arctic Sea Ice Thickness from Satellites, Aircraft, and PIOMAS Data, Remote Sensing, 8 (9), 713, doi:10.3390/ rs8090713.
- Warren, S. G., I. G. Rigor, N. Untersteiner, V. F. Radionov, N. N. Bryazgin, Y. I. Aleksan- drov, R. Colony, S. G. Warren, I. G. Rigor, N. Untersteiner, V. F. Radionov, N. N. Bryazgin, Y. I. Aleksandrov, and R. Colony (1999), Snow Depth on Arctic Sea Ice,
- Zhang, J., and D. A. Rothrock (2003), Modeling Global Sea Ice with a Thickness and Enthalpy Distribution Model in Generalized Curvilinear Coordinates, Monthly Weather Review, 131 (5), 845–861, doi:10.1175/1520-0493(2003)131 0845:MGSIWA 2.0.CO;2.
- Zygmuntowska, M., P. Rampal, N. Ivanova, and L. H. Smedsrud (2014), Uncertainties in Arctic sea ice thickness and volume: new estimates and implications for trends, The Cryosphere, 8 (2), 705–720, doi:10.5194/tc-8-705-2014.
Summary of sea ice thickness datasets
| Name | Source | Domain | Period of Record | Timesteps | Resolution | Formats | Formats |
|---|---|---|---|---|---|---|---|
| Sea ice freeboard, snow depth and thickness from Envisat, CryoSat-2 and CryoSat-2/Saral fusion | AVISO/Center for Topographic studies of the Ocean and Hydrosphere | Antarctic, Arctic | 2002/03 to present | Monthly | 25 km | netCDF | Envisat, CryoSat-2 and CryoSat-2/Saral fusion |
| Along-track sea ice freeboard from ICESat-2 | NSIDC | Antarctic, Arctic | 2018/10 to present | Sub-daily | Variable along-track (typically ~30-75 m) | HDF5 | ICESat-2 |
| Along-track, quick look sea ice freeboard from ICESat-2 | NSIDC | Antarctic, Arctic | 2023/01 to present | Sub-daily | Variable along-track (typically ~30-75 m) | HDF5 | ICESat-2 |
| Gridded sea ice freeboard from ICESat-2 | NSIDC | Antarctic, Arctic | 2018/10 to present | Daily, Monthly | 25 km | HDF5 | ICESat-2 |
| Unified Sea Ice Thickness Climate Data Record | NSIDC/Axel Schweiger and others | Antarctic, Arctic | 1947/01 to present | Daily, Weekly, Monthly | 50 km | ascii | aircraft, satellites, moorings |
| Sea Ice Thickness Data from Gridded Products | NSIDC | Arctic | 1993/01 to 2014/12 | Monthly | 100 km | netCDF | ULS, airborne laser, and radar altimetry |
| Sea Ice Freeboard and Thickness from ICESat (G) | NSIDC/Donghui Yi, H. Zwally | Arctic | 2003/02/20 to 2008/10/19 | Campaigns, Daily | 70 m | ascii | GGLAS, SSM/I, snow climatology |
Sea Ice Freeboard, Thickness and Snow Depth from IceBridge |
NSIDC/Nathan Kurtz and others | Antarctic, Arctic | 2009/03/19 to 2013/04/25 | Varies | varies | ascii | Airborne altimetry |
| Near Real-time (NRT) Sea Ice Thickness (and archive) from CryoSat-2 | ESA, processed at the NERC Center for Polar Observation and Modelling (CPOM), UCL | Arctic | 2010/10 to present | 2 Days, 14 Days, 28 Days | 5 km | netCDF, ascii, GeoTIFF | CryoSat-2 |
| Sea Ice Thickness from AWI-CryosSat-2 | Alfred Wegener Institute, Helmholtz Centre for Polar and Marine Research | Arctic | 2010/11 to present | Monthly | 25 km | netCDF | CryoSat-2 |
| Daily Thickness of Thin Sea Ice from SMOS | Alfred Wegener Institute, Helmholtz Centre for Polar and Marine Research, University of Hamburg | Antarctic, Arctic | 2010/10 to present | Daily | 12.5 km | netCDF | SMOS |
| Weekly Sea Ice Thickness from CryoSat2/SMOS Data Fusion | Alfred Wegener Institute, Helmholtz Centre for Polar and Marine Research, University of Hamburg | Antarctic, Arctic | 2010/11/15 to present | Weekly | 25 km | netCDF | CS2-SMOS Data Merging |
| Simulated Sea Ice Thickness from the Pan-Arctic Ice Ocean Modeleing and Assimilation System (PIOMAS) | Polar Science Center at the University of Washing- ton/Jinlun Zhang | Arctic | 1979/01 to present | Daily, Monthly | mean 22 km | binary | coupled Parallel Ocean and Sea Ice model and assimilation |
| Simulated Sea Ice Thickness from the Global Ice-Ocean Modeleing and Assimilation System (GIOMAS) | Polar Science Center at the University of Washing- ton/Jinlun Zhang | Global | 1979/01 to present | Monthly | mean 22 km | binary | coupled Parallel Ocean and Sea Ice model and assimilation |