Sea Ice Concentration data: Overview, Comparison table and graphs
Sea ice concentration is both an indicator and driver of changes high-latitude climate with strong societal and ecological importance. It is a key boundary condition for atmospheric models (including those used in atmospheric reanalyses) and a benchmark for coupled climate models. As such, numerous methods have been developed to estimate sea ice concentration. The most widely used sea ice data sets for climate research are derived from passive microwave instruments, including SMMR, SSMI, SSMIS, AMSR-E and AMSR-2, flying on various satellite platforms. The algorithms applied to the microwave brightness temperatures use different combinations of channels, making different corrections for weather, satellite drift, and other factors. Users of sea ice data should be aware of the different algorithms and their attributes, the different spatial footprints of the satellite instruments and channels, and the methods for combining different source data into long-term data sets. The table and links below provide a starting point for understanding and locating the appropriate data sets. The focus is on long-term data sets rather than near-real-time products.
Expert User Guidance
We are actively seeking contributions from sea ice data users and developers! Please consider contributing your knowledge and questions! Possible topics include discussing the pros and cons of each algorithm, how weather effects can be dealt with, differences among passive microwave satellite sensors, alternative means of estimating sea ice beyond passive microwave, comparisions of data sets among each other and with field observations, best data sets for boundary conditions, best data sets for evaulating coupled models, etc.
Key Figures
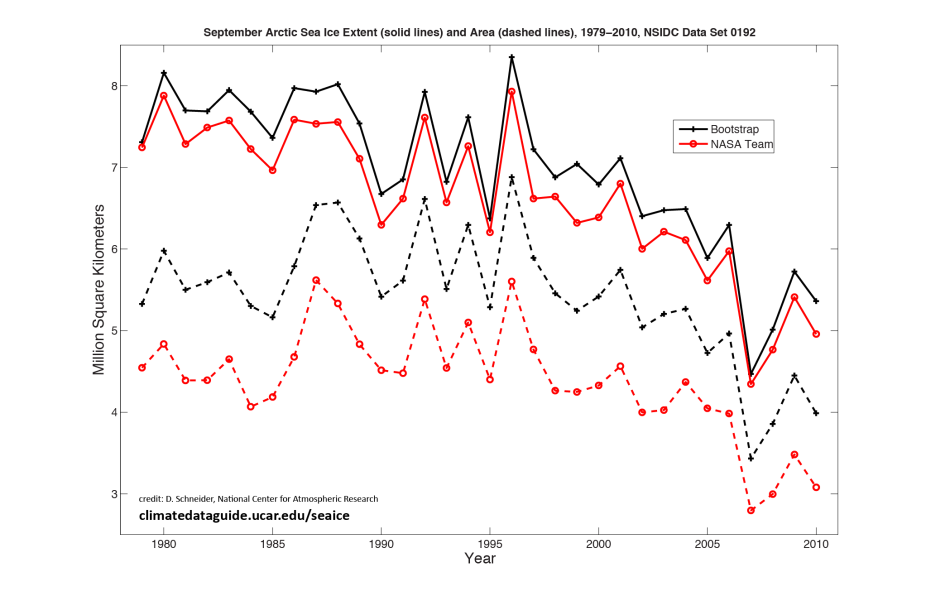
September Arctic sea ice extent (solid lines) and area (dashed lines), 1979-2010, for the NASA Team (red) and Bootstrap (black) algorithms. Source: NSIDC Data Set 0192: Stroeve, J., and W. Meier. 1999, updated 2011. Sea Ice Trends and Climatologies from SMMR and SSM/I-SSMIS, 1979-2010. Boulder, Colorado USA: NSIDC. Digital media. (Figure by D. Schneider, NCAR)
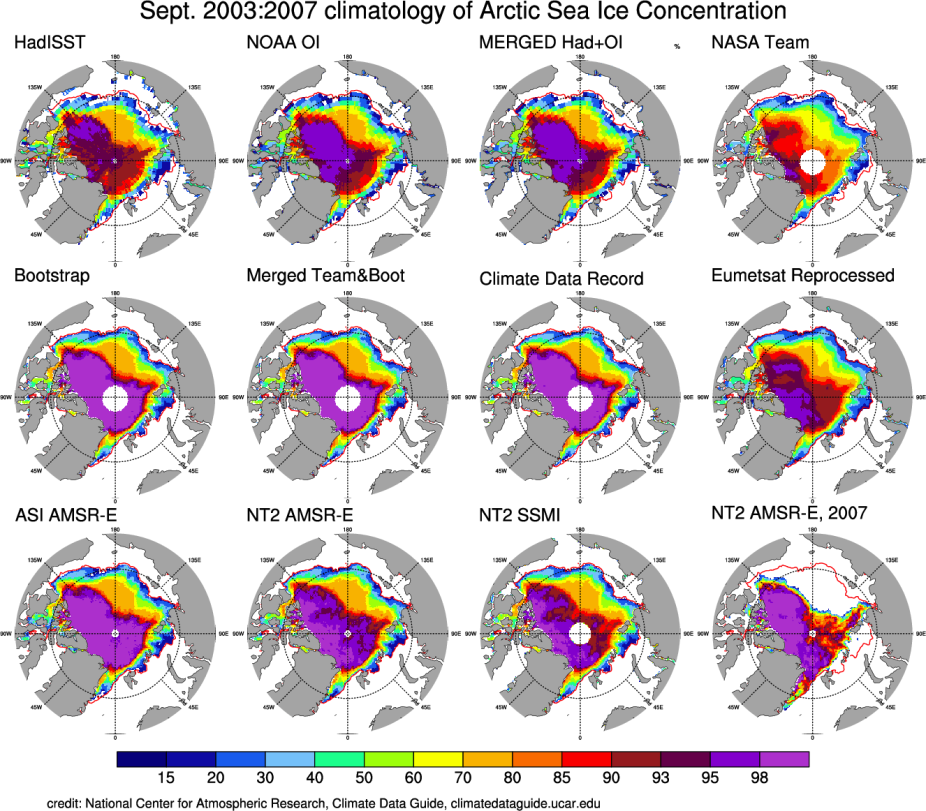
Comparison of September Arctic sea ice concentration climatologies for 2003-2007. For reference, the 15% ice concentration contour of the NT2 AMSR-E data set is plotted as a red line on all of the maps. Bottom right map is for 2007 only. Data are from various sources; see the table on climatedataguide.ucar.edu/seaice. (figure by D. Schneider).
Other Information
Summary of sea ice concentration datasets
| Name | Snapshot | Source | Domain | Years of record | Timestep | Spatial Resolution | Formats | Input Data |
|---|---|---|---|---|---|---|---|---|
| CERA-20C: ECMWF's Coupled Ocean-Atmosphere Reanalysis of the 20th Century | 
|
ECMWF | Global | to | Sub-daily, Daily, Monthly | ~ 125km; 160 x 320; 91 model levels/ 37 pressure levels / 16 potential temperature levels, and the 2 PVU potential vorticity level | netCDF, GRIB | Surface pressures and mean sea level pressures from ISPDv3.2.6 and ICOADSv2.5.1. Surface marine winds from ICOADSv2.5.1. Sea surface temperature from HadISST2. Temperature and salinity profiles from EN4. |
| Merged Hadley-NOAA/OI Sea Surface Temperature & Sea-Ice Concentration (Hurrell et al, 2008) | 
|
NCAR / James Hurrell, Adam Phillips, Dennis Shea | Global, Antarctic, Arctic, NH - Northern Hemisphere, SH - Southern Hemisphere | to | Monthly | 1° x 1° | netCDF | HadISST 1870-Nov 1981; NOAA OI Dec 1981-present |
| NSIDC Sea Ice Index | 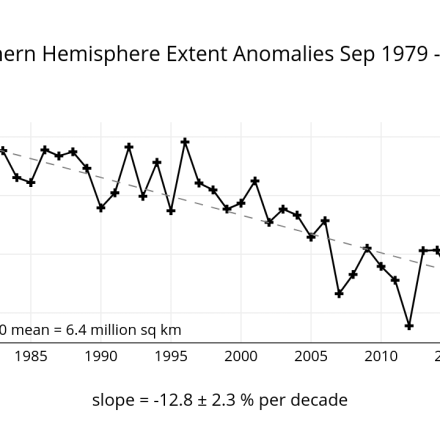
|
National Snow and Ice Data Center | Antarctic, Arctic | to | Daily, Monthly | 25km x 25km | ascii, csv, GeoTIFF, Image, shapefile | |
| Sea Ice Concentration Climate Data Record from OSI SAF | 
|
Norwegian Meteorological Institute , Danish Meteorological Institute | Antarctic, Arctic, NH - Northern Hemisphere, SH - Southern Hemisphere | to | Daily | 25 x 25 km | netCDF | SMMR and SSM/I |
| Sea Ice Concentration data from AMSR-E, AMSR2 & SSMIS, U Bremen and U Hamburg ASI algorithm | 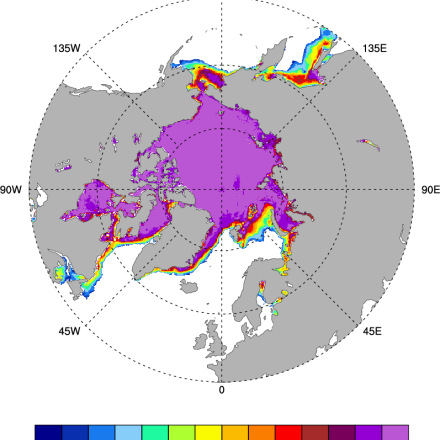
|
Lars Kaleschke - CLiSAP (Hamburg, Germany) , Stefan Kern - CliSAP (Hamburg, Germany) , Gunnar Spreen - JPL | NH - Northern Hemisphere, SH - Southern Hemisphere, Antarctic, Arctic | to | Daily | 6.25 x 6.25 km | netCDF, HDF, GeoTIFF | AMSR-E 89 GHz channel; separate data from SSMIS; planned AMSR-2 |
| Sea Ice Concentration data from HadISST | 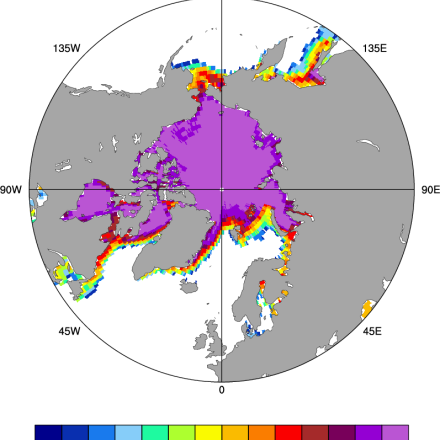
|
UK Met Office Hadley Center / N. Rayner and others | Antarctic, Arctic, NH - Northern Hemisphere, SH - Southern Hemisphere | to | Monthly | 1° x 1° | netCDF, ascii | numerous sea ice charts, Walsh and Chapman sea ice (NH), adjusted passive microwave sea ice |
| Sea Ice Concentration data from NASA Goddard and NSIDC based on Bootstrap algorithm | 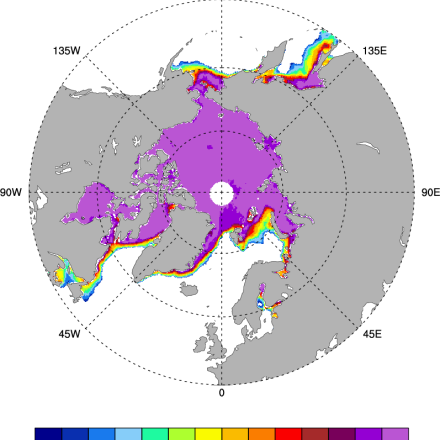
|
NASA Goddard / Joesefino Comiso , NSIDC | Antarctic, Arctic, NH - Northern Hemisphere, SH - Southern Hemisphere | to | Daily, Monthly | 25 x 25 km | netCDF, binary | SMMR, SSMI, SSMI/S, AMSR-E |
| Sea Ice Concentration data from NASA Goddard and NSIDC based on NASA Team algorithm | 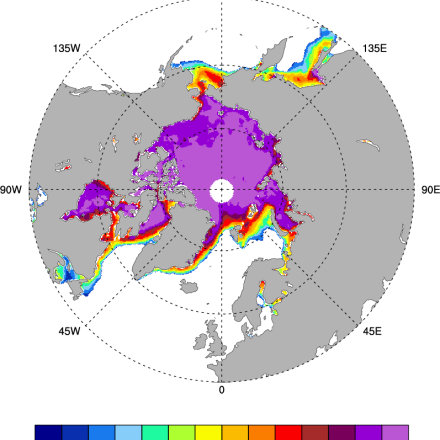
|
NASA Goddard / Donald Caveleri, Claire Parkinson and others , NSIDC | Antarctic, Arctic, NH - Northern Hemisphere, SH - Southern Hemisphere | to | Daily, Monthly | 25 x 25 km | netCDF, binary | SMMR, SSMI, SSMI/S |
| Sea Ice Concentration data from NASA Goddard and NSIDC using AMSR-E and NASA TEAM2 (NT2) algorithm | 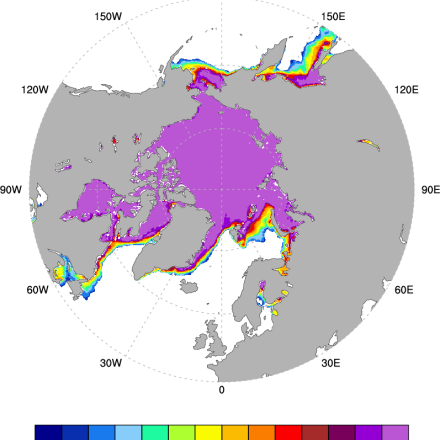
|
NASA Goddard / Donald Caveleri, Thorsten Markus and Josefino Comiso , NSIDC | Antarctic, Arctic | to | Daily | 12.5x12.5 Km or 25x25km | HDF-EOS | AMSR-E brightness temperatures |
| Sea ice concentration data from NASA Goddard based on SSMI and NASA Team (NT2) algorithm | 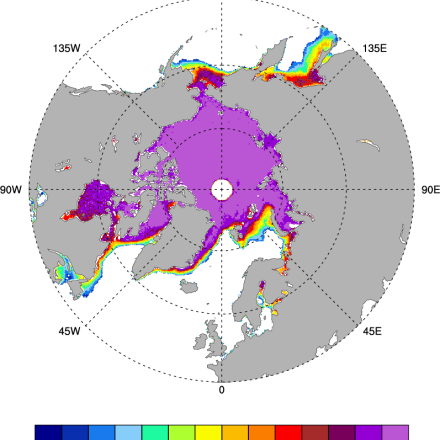
|
NASA Goddard | T. Markus; D. Cavalieri | Antarctic, Arctic | to | Daily | 25 x 25 km | binary | SSMI: multiple channels |
| Sea Ice Concentration data from NOAA OI | 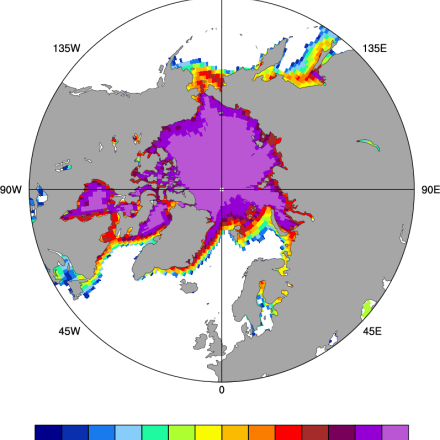
|
NOAA / Richard Reynolds and others | Antarctic, Arctic, NH - Northern Hemisphere, SH - Southern Hemisphere | to | Monthly, Weekly | 1° x 1° | netCDF | adjusted passive microwave -derived sea ice from NASA Goddard and NCEP operations |
| Sea Ice Concentration: NOAA/NSIDC Climate Data Record | 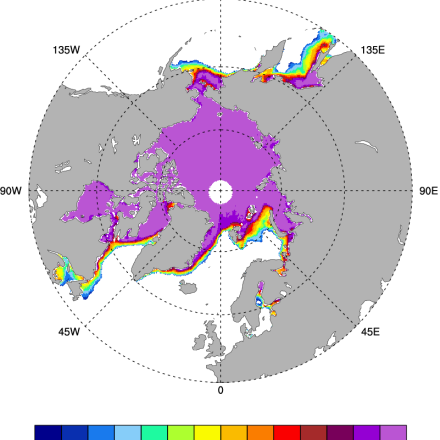
|
NSIDC: Ruth Duerr (Co-I), Florence Fetterer (Co-I), Julienne Stroeve (Co-I) , NASA: Walt Meier (PI) | Antarctic, Arctic, NH - Northern Hemisphere, SH - Southern Hemisphere | to | Daily, Monthly | 25 x 25 km | netCDF | SSMI using NASA Team or Bootstrap |
| SST data: NOAA High-resolution (0.25x0.25) Blended Analysis of Daily SST and Ice, OISSTv2 | 
|
NOAA NCDC/Richard Reynolds | Global | to | Daily | 0.25°x0.25° | netCDF, binary | ships, bouys, large-scale adjustment of satellite biases, AVHRR, AMSRE |
| Walsh and Chapman Northern Hemisphere Sea Ice | John Walsh (U Illinois) , Bill Chapman (U. Illinois) | NH - Northern Hemisphere, Arctic | to | Monthly | 1° x 1° | ascii | historical charts, switching to SMMR & SSM/I in 1978 |