SST data: HadSST3

Note: HadSST3 has been superseded by HadSST4.
HadSST3 provides monthly SST anomalies on a 5°x5° grid for 1850-present. The anomalies are derived from a 30-year climatology spanning 1961-90.Coverage is global but there is no interpolation; Thus, missing data occur in the final product. The primary input data are from ICOADS release 2.5. Bias adjustments to the ICOADS SSTs account for changes in measurement methods (e.g. engine room intake, bucket measurements, or buoy data). Uncertainties in these adjustments have complex spatial and temporal dependencies. The uncertainties are represented in an ensemble of 100 realizations of the data set. This allows the spatial and temporal characteristics of the uncertainties and their effects on climate signals to be explored. In addition to the ensemble, a median estimate is provided. Additional uncertainty arises from limited spatial coverage, differing numbers of samples in a grid box, errors in individual measurements and biases in measurement platforms. Unadjusted raw data are provided but their use for climate studies is discouraged. HadSST3 is the SST component of the HadCRUT4 global combined land-ocean surface temperature data set.
HadSST3 has been replaced by HadSST4, which is now the recommended version to use. HadSST4 uses an updated ICOADS release and offers more comprehensive uncertaity estimates.
Key Strengths
Long record, extending back to 1850 and up to present with regular updates
Quantification of systematic uncertainties (due to measurement methods) in space and time presented as a 100-member ensemble; bias adjustments extend beyond the 1941 cutoff used previously
No interpolation so anomalies in a grid cell can be traced to original observations. Also, no loss of variance that often arises from statistical reconstruction and interpolation methods.
Key Limitations
Coarse resolution. Coverage gaps, especially early in the record
Underestimates recent SST trends (~2003-present) based on comparisons with independent SST measurements from buoys, floats, and satellites
The uncertainty estimates should not be viewed as comprehensive; for example, structural uncertainties in the bias adjustments and analysis methods are not estimated. Users should use HadSST3 in comparison with other data sets like ERSST.
non-commercial scientific research
Expert User Guidance
The following was contributed by Dr. John Kennedy (UK Met Office, Hadley Centre), October, 2014:
#Summary
HadSST3 (the Hadley Centre Sea-Surface Temperature data set version 3) is a gridded data set of sea-surface temperature anomalies from January 1850 to the present. The monthly grids have a resolution of 5 degree latitude by 5 degree longitude. It is based on quality-controlled in situ measurements of sea-surface temperature from the International Comprehensive Ocean Atmosphere Data Set (ICOADS) release 2.5 and is updated using observations from the Global Telecommunication System. In situ measurements are those made at the surface by ships, drifting buoys and moored buoys. Ship measurements are made using a variety of methods. Adjustments have been applied to the data to account for artificial variability caused by changes in instrumentation. Uncertainties associated with bias adjustments, measurement and sampling error have been estimated. Grid-cell average SST anomalies are only estimated in those grid cells that contain observations, and consequently the data set is not globally complete; there are numerous data voids.
What are the key strengths of this data set?
- The data set is long compared to most instrumental data sets, starting in 1850
- Regularly updated. Typically a month’s data is available before the end of the following month.
- SSTs are only estimated for a grid box when there are observations in that grid box. This has the virtue of simplicity.
- The grid box average is estimated using simple resistant statistics that are less sensitive to outliers in the input data.
- Adjustments have been applied to the whole data set to minimise the effect of changes in measurement method.
- Detailed uncertainty information is included.
- Uncertainties associated with the bias adjustments are presented as an ensemble of 100 data sets which are presented in a common format.
What are the key limitations of this data set?
- The resolution of the data sets is limited. Monthly fields are presented on a monthly 5 degree latitude by 5 degree longitude grid.
- There are gaps in the data, particularly early in the record. There are many interpolated SST data sets, such as ERSST, COBE-SST and HadISST, which could be used if a globally complete analysis is needed.
- There is no smoothing or interpolation applied, so the data are noisier than more heavily processed data sets. Use of the uncertainty estimates can help to understand when values are reliable.
- The uncertainties associated with random and systematic errors from individual ships lead to large scale correlations in the errors, but these have not been explicitly calculated due to a large number of observations lacking appropriate metadata (ship callsigns).
- The uncertainty analysis does not include an estimate of structural uncertainty. Therefore, it is best to use HadSST3 in combination with at least one other long term analysis such as ERSST or COBE.
- Some users find the ensemble of 100 data sets unwieldy. Therefore a ‘median’ estimate is also provided.
What are the typical research applications of this data set?
- Studies of long term (particularly multi-decadal) changes in sea-surface temperature. HadSST3 is also used as the ocean component of the global blended land and ocean near surface temperature data set, HadCRUT4 (Morice et al. 2012)
- Detection and attribution studies.
- Climate monitoring.
What are the most common mistakes that users encounter when processing or interpreting these data?
Some users have assumed that the ensemble contains information about all the uncertainties in the data set. This is not the case. The ensemble does not contain information about the ‘high-frequency’ measurement and sampling error uncertainties which are provided as additional fields.
What are some comparable data sets, if any?
- There are many SST data sets that cover the satellite period from 1980 to the present. Data sets that are of comparable length to HadSST3 are:
- ERSST NOAA Extended Reconstruction SST version 3 (Smith et al. 2008)
- Kaplan et al. (1997)
- COBE-SST Centennial Observation Based Estimates of Sea Surface Temperature (Ishii et al. 2005, or Hirahara et al 2013)
- ICOADS summaries (Woodruff et al. 2011)
How is uncertainty characterized in these data?
- Uncertainties estimated are those associated with: adjustments made to minimise the effect of changes in measurement method, random and systematic measurement errors associated with measurements from individual ships, sampling errors arising from estimating a grid box average from a finite number of observations.
- Uncertainties associated with adjustments are presented as an ensemble of 100 versions of the data set. Each ensemble member represents a plausible estimate of the SST based on uncertainties in the parameters of the bias adjustment scheme. An ensemble is used in order to preserve information about the spatial and temporal correlations of the uncertainties in the data.
- Uncertainties associated with random and systematic measurement errors and sampling errors are presented as gridded fields and can be provided as error covariances on request.
Were corrections made to account for changes in observing systems or practices, sampling density, satellite drift, or similar issues?
Yes. Historically, sea-surface temperature measurements have been measured by ships, drifting buoys and moored buoys. Ship measurements have been made using: buckets of various design to sample the surface water; water taken in below the surface to cool the ship’s engines; or using a dedicated hull-mounted sensor. Adjustments have been applied to minimise the effects of such changes on the composite record. However, there are uncertainties in these adjustments. The uncertainties are presented as an ensemble of 100 interchangeable data sets which characterise the uncertainty in the adjustments.
How do I best compare these data with model output?
It depends on what you are doing. There are two principle things to bear in mind. First, there are gaps in the data and the gaps are highly heterogeneous in time. Early in the record and during the two World Wars, the coverage is very sparse. Some analyses have accounted for this by masking the model output to have a similar coverage to that of the observations. Second, there are uncertainties in the data. The data set has been presented as an ensemble of 100 data sets that characterise the uncertainties in the bias adjustments and, together with separate fields of uncertainties associated with other measurement and sampling errors, these provide information about the estimated total uncertainty in the gridded fields. The idea behind providing an ensemble was that it would be relatively easy to assess the sensitivity of an analysis to observational uncertainty by re-running the analysis on some, or all, of the observational ensemble.
We welcome feedback from users on this general approach of using ensembles of observational data sets.
Are there spurious (non-climatic) features in the temporal record?
Probably. Although every effort has been made to minimise the effects of known changes in measurement methods, information concerning how measurements were made is limited. The period between 1935 and 1970 is particularly problematic as there were large changes in the way that measurements were made (with relatively poor documentation) and discontinuities in the data sources used to form the ICOADS data base.
##
Cite this page
Acknowledgement of any material taken from or knowledge gained from this page is appreciated:
Kennedy, John & National Center for Atmospheric Research Staff (Eds). Last modified "The Climate Data Guide: SST data: HadSST3.” Retrieved from https://climatedataguide.ucar.edu/climate-data/sst-data-hadsst3 on 2026-07-20.
Citation of datasets is separate and should be done according to the data providers' instructions. If known to us, data citation instructions are given in the Data Access section, above.
Acknowledgement of the Climate Data Guide project is also appreciated:
Schneider, D. P., C. Deser, J. Fasullo, and K. E. Trenberth, 2013: Climate Data Guide Spurs Discovery and Understanding. Eos Trans. AGU, 94, 121–122, https://doi.org/10.1002/2013eo130001
Key Figures
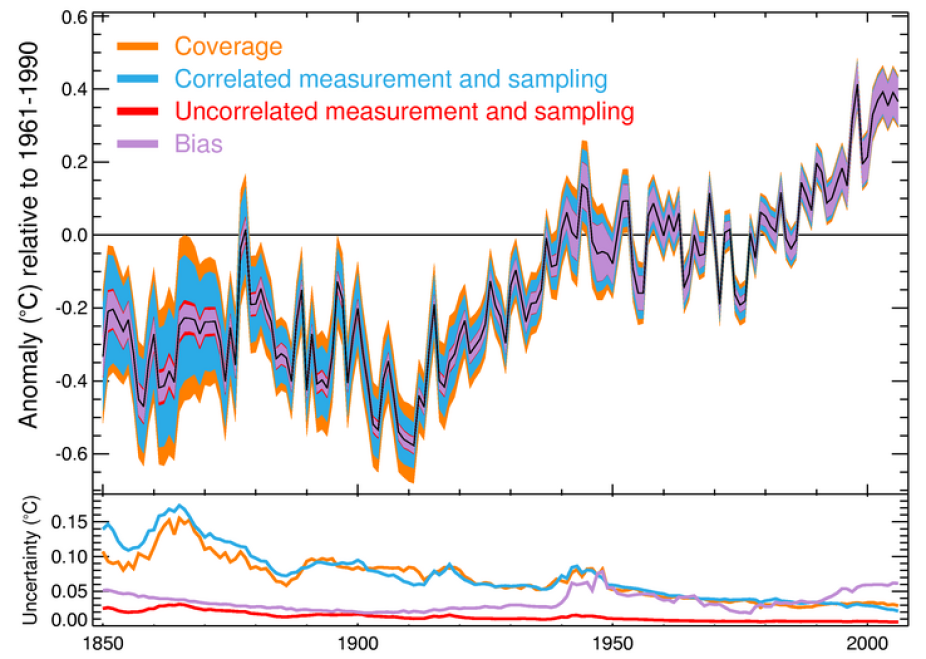
HADSST3 observationally based SST anomalies. Figure 11 of Kennedy et al (2011b) (with permission; source: http://www.metoffice.gov.uk/hadobs/hadsst3)