SST data: NOAA daily Optimum Interpolation Sea Surface Temperature version 2.1, OISSTv2.1
NOAA’s daily Optimum Interpolation Sea Surface Temperature (dOISST, also known as Reynolds’ SST or OISST) is a global SST analysis product. An SST analysis is a spatially gridded product created by interpolating and extrapolating data, resulting in a smoothed spatially-complete field. dOISST provides global fields that are based on a combination of ocean temperature observations from satellite and in situ platforms (i.e., ships, buoys, and Argo floats). The input data are irregularly distributed in space and time and must be first placed on a regular 0.25° grid. The OISSTv2.1 methodology also includes bias adjustment steps of (a) ship SST bias correction according to buoy and Argo SST and (b) satellite SST bias correction according to in situ SST. Optimum interpolation (OI), a spatial interpolation method, is applied to the bias-corrected observed data to estimate values in regions without observations. In general, SST analyses including OISST are used in a range of applications including weather forecasting, climate studies, modeling, ENSO monitoring and prediction, marine ecosystem monitoring, commercial and recreational fisheries, marine heatwaves, and as a reference field for other satellite algorithms.
Key Strengths
Daily, spatially complete estimates of SST on a 0.25° grid from 1981-present enables study of high-resolution ocean climate variability and change.
Consistency in remote sensed observations as the same sensor type (AVHRR) has used throughout the entire OISST record.
The product includes seas and large lakes in addition to the global ocean
Key Limitations
No uncertainty assessment or estimated uncertainty magnitude is provided.
Satellite bias corrections require adequate in-situ observations which are very sparse in some regions, especially the high latitudes.
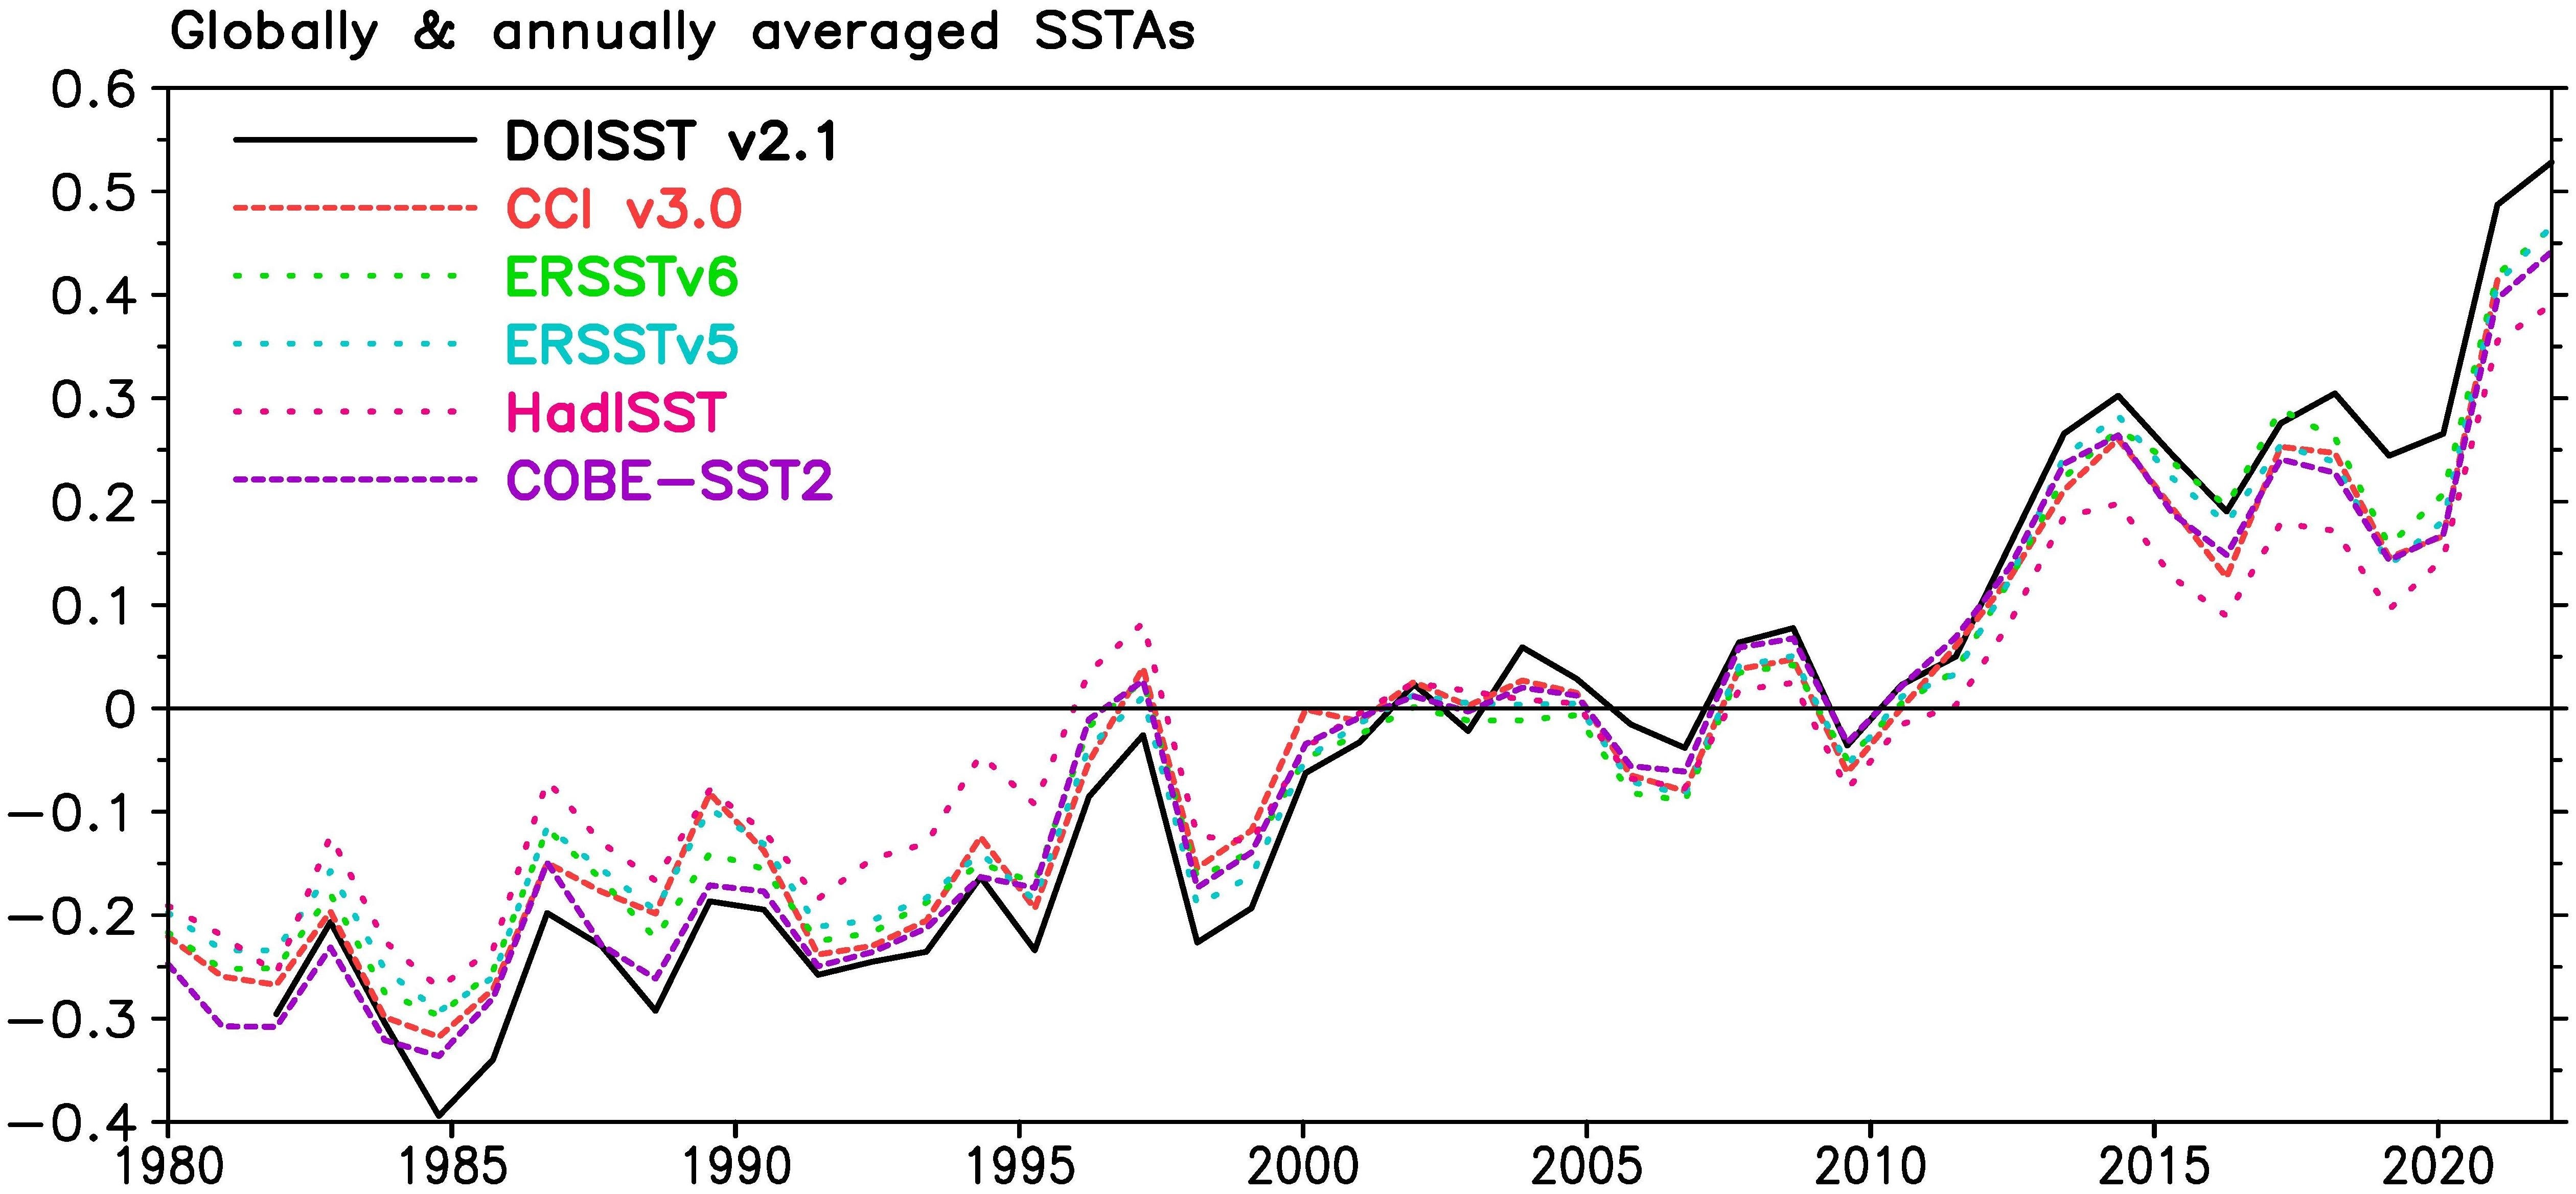
The long-term trend of OISST shows more warming than other SST analyses over the 1982-present period.
Huang, Boyin, Chunying Liu, Viva Banzon, Eric Freeman, Garrett Graham, Bill Hankins, Tom Smith, and Huai-Min Zhang. "Improvements of the daily optimum interpolation sea surface temperature (DOISST) version 2.1." Journal of Climate 34, no. 8 (2021): 2923-2939. https://doi.org/10.1175/JCLI-D-20-0166.1
Expert Developer Guidance
The following was contributed by Dr. Boyin Huang and Dr. Xungang Yin (both at NOAA NECI), August, 2025:
What are the key strengths of the dataset?
The data has a daily temporal resolution from from Sep 1981 to present and is updated daily. The product is gridded on 0.25°×0.25° latitude-longitude, enabling the study of fine-scale features. OISST provides complete global coverage of oceans, seas, and large lakes. In terms of the consistency, the same satellite sensor type (AVHRR) has been used throughout the entire time series for the daily OISST product. When compared to other products, the spatial patterns of OISST are very close to the coarse resolution analysis such as ERSSTv6.
What are the key limitations of the dataset?
Satellite bias corrections require adequate in-situ observations which are very sparse in some regions, especially the high latitudes. Furthermore, AVHRR-only version may not represent actual conditions in persistently cloudy regions. A resolution of 0.25°×0.25° may not be enough for some high-resolution applications. The product is limited to the satellite era since 1981 only. Only daily values are provided; diurnal variability is not captured. OISST's long-term trend is likely higher than other similar types of analyses.
What are the typical research applications of this data set?
Climate studies, ENSO monitoring and prediction, marine heatwaves (MHWs). OISST was widely used in MHW classification and monitoring over the world (Huang et al. 2021b), was used for ENSO diagnostics and prediction by NOAA Climate Prediction Center (CPC), many regional coastal studies.
What are the most common mistakes that users encounter when processing or interpreting these data?
SST may be biased in the coastal and regions with sparse observations, and should not be taken as the truth. As will most climate data products, as many possible products should be used when testing hypotheses (see comparable datasets below)
What are some comparable data sets, if any?
UK OSTIA, CCI, Canada CMC, but the differences in mean and RMSD are found due to different interpolation algorithms, data ingest, and ship and satellite bias corrections (Huang et al. 2021a, Huang et al. 2021b, Huang et al. 2023).
How is uncertainty characterized in these data?
Uncertainty is not characterized in this data. However, the data provided is uncertain, particularly in regions without regular in situ observations and regions with persistent cloud cover.
Were corrections made to account for changes in observing systems or practices, sampling density, satellite drift, or similar issues?
The major source of biases are (a) ship SST bias relative to buoy and Argo SSTs and (b) daytime and nighttime satellite SST biases relative to in situ SSTs. These bias corrections are applied in OISST, but the accuracy of these bias correction remains uncertain.
How useful are these data for characterizing means as well as extremes?
These data are useful for characterizing means as well as extremes in SSTs. Since the spatial and temporal resolution is relatively high in comparison with in situ-only products such as ERSST and HadSST, extreme SST events can be reasonably-well represented (Huang et al. 2024).
How does one best compare these data with model output?
RMSD on 0.25°×0.25° resolution. A common problem is that many comparisons are done by interpolating SSTs with different spatial resolution to the in situ buoy and Argo SST locations, which enables advantages of high-resolution products due to a short mean distance between the grids of SST products and in situ SSTs. It is suggested, to make a fair comparison, to downgrade the high-resolution SST products to the common low-SST grids (0.25°) before they are compared with each other (Huang et al. 2023).
Are there spurious (non-climatic) features in the temporal record?
Unknown but possible in partially ice-covered regions due to spurious and/or ice concentration from satellite measurements and in coastal and high-latitude regions where in situ observations are sparse so that satellite bias correction becomes difficult.
How do I access these data?
From the NOAA NCEI OISSTv2.1 home page
How frequently are the data updated?
The data are updated daily, allowing the real time monitoring and study of SSTs
Cite this page
Acknowledgement of any material taken from or knowledge gained from this page is appreciated:
Huang, Boyin &, Yin, Xungang & National Center for Atmospheric Research Staff (Eds). Last modified "The Climate Data Guide: SST data: NOAA daily Optimum Interpolation Sea Surface Temperature version 2.1, OISSTv2.1.” Retrieved from https://climatedataguide.ucar.edu/climate-data/sst-data-noaa-daily-optimum-interpolation-sea-surface-temperature-version-21-oisstv21 on 2026-07-14.
Citation of datasets is separate and should be done according to the data providers' instructions. If known to us, data citation instructions are given in the Data Access section, above.
Acknowledgement of the Climate Data Guide project is also appreciated:
Schneider, D. P., C. Deser, J. Fasullo, and K. E. Trenberth, 2013: Climate Data Guide Spurs Discovery and Understanding. Eos Trans. AGU, 94, 121–122, https://doi.org/10.1002/2013eo130001
Key Figures

Figure 1: SSTAs of (a) OISST v2.1 and (b) ERSSTv6 in June 2025 in reference of 1991-2020 climatology of ERSSTv6.
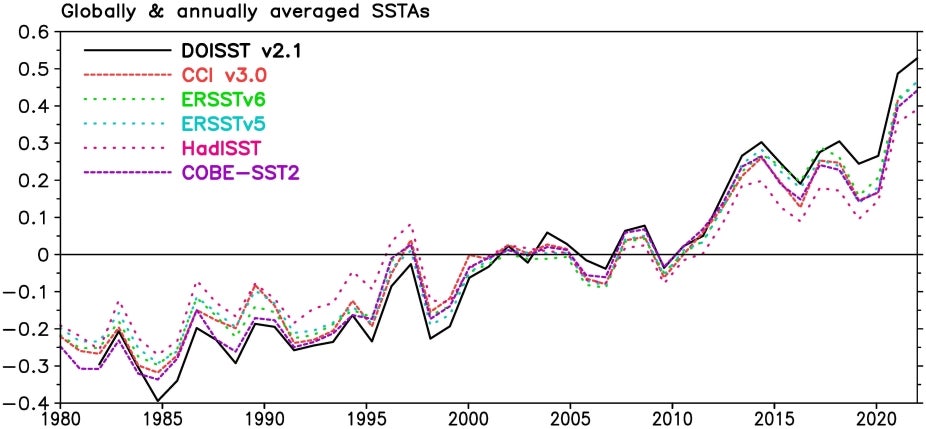
Figure 2: Globally and annually averaged SSTAs of DOISST v2.1 CCI v3.0, ERSSTv6, ERSSTv5, HadISST, and COBE-SST2. The SSTA is relative to the climatology of each SST product over 1991‒2020.