SST Data: NOAA Extended Reconstruction SSTs Version 6 (ERSSTv6)

The NOAA Extended Reconstruction Sea Surface Temperature version 6 (ERSSTv6) is a global, spatially complete SST data at monthly 2°×2° resolutions based on in situ observations for 1850-present. Version 6 is based upon statistical interpolation of the ICOADS release 3.0.2 SST data. Argo float data are also used in the recent years (since ~2000). The data are distributed as absolute SSTs, SST anomalies (SSTAs) relative to a 1991-2020 climatology, and the 1991-2020 monthly climatology. Upgrades in version 6 include interpolation using an artificial neural network (ANN), replacing the EOT method used in previous versions as well as an improved large-scale (>200km) filter and nearest-neighbor-checks in observation quality control (QC). ERSST forms the basis for NOAA's merged global land-ocean surface temperature analysis GlobalTemp as well as NASA's GISTEMP merged global temperature analysis.
Corrections to reconcile different measurement types (ship engine room intakes, ship bucket, buoys) are performed using comparisons of the binned, unadjusted raw SST data with an independent dataset of nighttime marine air temperatures for data through 2010. Post 2010, the ship-based data are adjusted using buoy and Argo SSTs. This statistics-based approach is relatively broad-brush compared with the fine-grained, physics-based corrections employed in HadSST4 and its infilled derivative datasets (e.g. Cowtan & Way, Berkeley Earth) and the hybrid statistical-dynamical approach of DCENT.
Key Strengths
Long record (1850-Present) with full global ocean coverage enables the study of global questions of climate variability and change
Interpolation and infilling by neural networks provides more realistic SST variability in data-poor regions
Bias correction using nighttime marine air temperature (NMAT) mitigates some known biases in the pre-1945 record
Key Limitations
Currently, there is no uncertainty assessment of the interpolation method. Users should use caution when using ERSST to answer questions in data-poor regions prior to 1945 and compare results with other products.
The product may not properly represent known periods of bias in SST observations, including the early 20th century cold anomaly and the WWII warm bias
Huang, B., X. Yin, T. Boyer, C. Liu, M. Menne, Y. D. Rao, T. Smith, R. Vose, H.-M. Zhang, 2025: Extended Reconstructed Sea Surface Temperature Version 6 (ERSSTv6): Part I. An Artificial Neural Network Approach. J. Climate, 38, 1105-1121. https://doi.org/10.1175/JCLI-D-23-0707.1
Huang, B., X. Yin, T. Boyer, C. Liu, M. Menne, Y. D. Rao, T. Smith, R. Vose, H.-M. Zhang, 2025: Extended Reconstructed Sea Surface Temperature Version 6 (ERSSTv6): Part II. Upgrades on Quality Control and Large-scale Filter. J. Climate, 38, 1123-1136. https://doi.org/10.1175/JCLI-D-24-0185.1
Expert Developer Guidance
The following was contributed by Dr. Boyin Huang and Dr. Xungang Yin (both at NOAA NECI), August, 2025:
What are the key strengths of this data set?
Long record spanning 1850-present with global coverage. This and other SST records at a centennial time scale helps our understanding of the historical SST variability and long-term trends. These data are used to build understanding of the physical mechanisms driving variability and change and will help the projection of the future SST change. The spatial variability of ERSSTv6 has been greatly improved over the previous versions of ERSST.
What are the key limitations of this data set?
Potential biases and large uncertainties around the WWII period and during the early 20th century due to biases in the limited observations and before 1900 due to sparse observations. The biases are seen in comparisons with similar types of SST products such as UKMO HadSST and JMA KOBE-SST. The biases are mostly caused by differences in ship SST bias correction as shown by Huang et al. (2017).
What are the typical research applications of this data set?
Three major applications are studies of global and regional climate change and variability, ENSO monitoring and dynamics, and as a SST forcing for AMIP and OMIP climate model simulations. Operationally, the data is currently used by NOAA Climate Prediction Center (CPC) for ENSO monitoring and prediction as well as NOAA GlobalTemp and NASA GISTEMP for global surface temperature. ERSST is commonly used as the surface boundary condition for the AGCM simulation and used as SST restoring condition for the OGCM simulation due to its complete global coverage and long record.
What are the most common mistakes that users encounter when processing or interpreting these data?
ERSST is an SST analysis based on in situ observation, but it is not an observed truth as it may contains biases and uncertainties. Research conducted with ERSST should be replicated with numerous SST products as discussed on the Climate Data Guide SST overview page.
What are some comparable data sets, if any?
UK HadISST (Rayner et al. 2003) and HadSST (Kennedy 2019), JMA COBE-SST (Ishii et al. 2025), and DCENT (Chan et al. 2024).
How is uncertainty characterized in these data?
ERSSTv6 uncertainties are still under development, and are expected to be available in 2026.
Were corrections made to account for changes in observing systems or practices, sampling density, satellite drift, or similar issues?
Biases of ship SST were corrected by nighttime marine air temperature (NMAT) before 1985 in account for the cooling biases due to different types of buckets before the 1940s and engine room intake between 1940s and 1985, and by buoy and Argo SSTs in global average after 1985.
How useful are these data for characterizing means as well as extremes?
These data are useful for characterizing means but not extremes. Due to the nature of its coarse resolutions of space (2°×2°) and time (monthly), the SST in ERSST represents monthly SSTs since 1850, which is unable to represent extreme SSTs in small spatial scales and short time scales such as daily variability.
How does one best compare these data with model output?
We recommend regridding model output to the ERSST 2°×2° resolution and utilizing metrics such as Root Mean Squared Error to assess the difference between model outputs and ERSST analysis. Depending on the application, it is also recommended to compare absolute SST rather than SSTA because the SST climatology may different among different products.
Are there spurious (non-climatic) features in the temporal record?
It is possible that there might be spurious records in ERSST in the early period before the 1900s, during the World War I & II, and in the data sparse regions in the southern hemisphere oceans south of 40°S (Fig. 2). There is some evidence that the trends found in early 20th century SST record are spurious, though this in ongoing research (Sippel et al. 2024).
How do I access these data?
The latest version is available on the NOAA NCEI website, including links to relevant publications and documentation.
How frequently are the data updated?
The data are updated each month.
Cite this page
Acknowledgement of any material taken from or knowledge gained from this page is appreciated:
Huang, Boyin &, Yin, Xungang & National Center for Atmospheric Research Staff (Eds). Last modified "The Climate Data Guide: SST Data: NOAA Extended Reconstruction SSTs Version 6 (ERSSTv6).” Retrieved from https://climatedataguide.ucar.edu/climate-data/sst-data-noaa-extended-reconstruction-ssts-version-6-ersstv6 on 2026-07-14.
Citation of datasets is separate and should be done according to the data providers' instructions. If known to us, data citation instructions are given in the Data Access section, above.
Acknowledgement of the Climate Data Guide project is also appreciated:
Schneider, D. P., C. Deser, J. Fasullo, and K. E. Trenberth, 2013: Climate Data Guide Spurs Discovery and Understanding. Eos Trans. AGU, 94, 121–122, https://doi.org/10.1002/2013eo130001
Key Figures
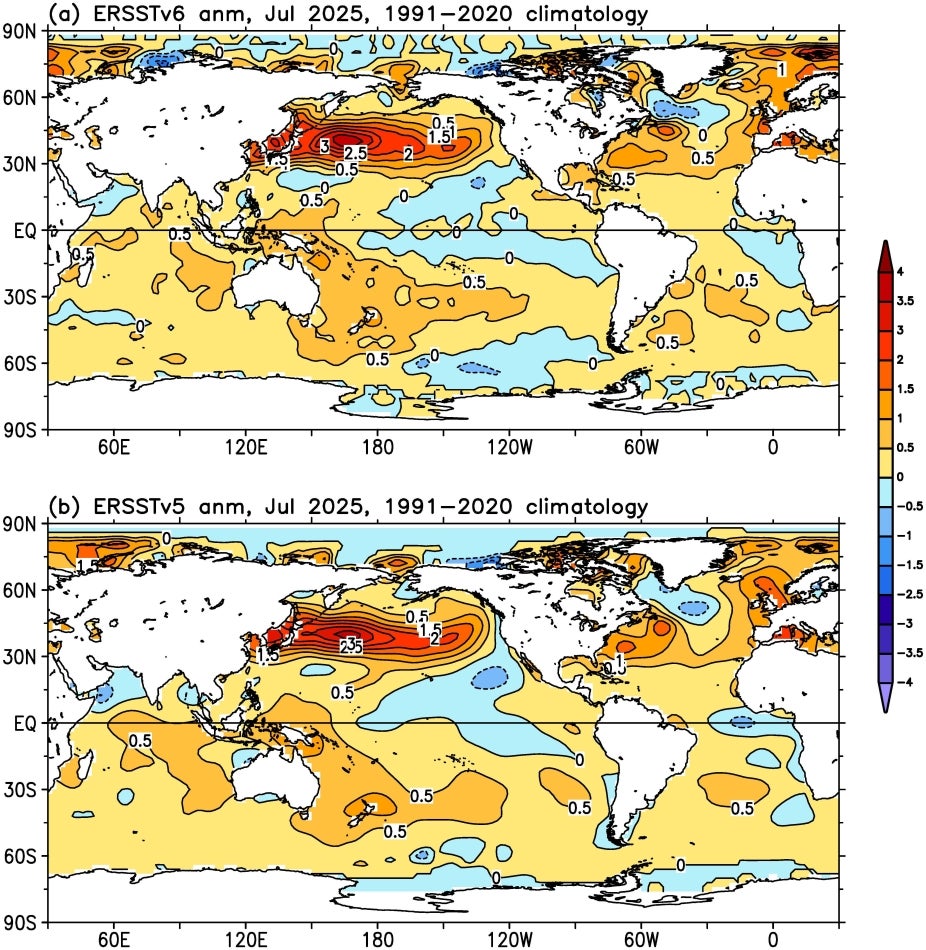
Figure 1: Sea Surface Temperature Anomalies (SSTAs) from (a) ERSSTv6 and (b) ERSSTv5 in July 2025 relative to 1991-2020 climatology.
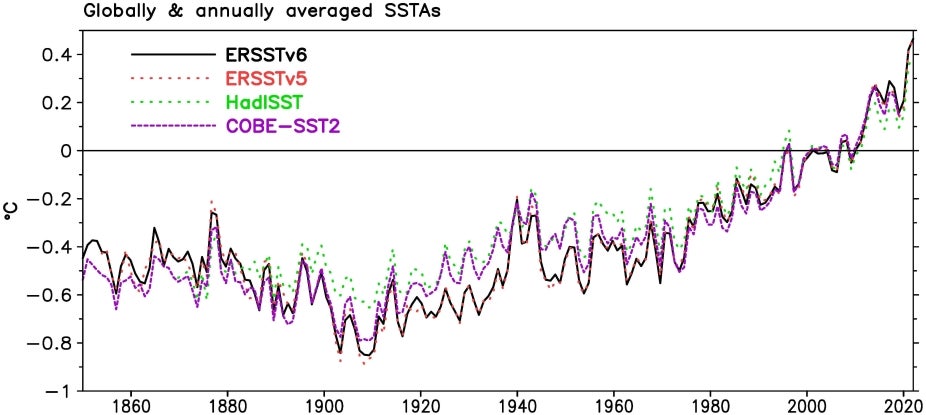
Globally and annually averaged SSTAs of ERSSTv6, ERSSTv5, HadISST, and COBE-SST2. The SSTA is relative to the climatology of each SST product over 1991‒2020.