SST data: NOAA Extended Reconstruction SSTs, Version 4
Note: ERSST is currently on version 6. See the ERSSTv6 page here.
The NOAA Extended Reconstruction Sea Surface Temperature (ERSST) provides global, spatially complete SST data at a monthly timestep for 1854-present. Compared to the previous version, Version 4 uses the more extensive ICOADS Release 2.5 data and revised quality control, bias adjustment, and infilling procedures. The resolved signals are rather damped prior to 1880 and more consistent after 1880. The data are distributed as anomalies; climatologies (absolute values) are available for 1981-2010. As a globally infilled dataset, ERSST v4 is generally suitable for basin-scale and global studies of climate variability and change, and has been used as boundary conditions for atmospheric models.
Version 5 was released in July, 2017 and NOAA's NCEI encourages users to use this updated version. Version 5 has better resolved patterns of SST variability. ERSSTv4 will be produced through December, 2017, after which only ERSSTv5 will be available.
Key Strengths
Long record spanning 1854-present; global coverage
Uses more extensive input data and revised quality control and bias adjustment procedures compared to previous versions
Uncertainty estimates provided
Key Limitations
Coarse spatial resolution and low temporal resolution; some features are highly smoothed or damped
Large uncertainties in the Arctic and Southern Oceans
Resolved signal degrades back through time, especially before 1880
Huang, B., P. W. Thorne, T. M. Smith, W. Liu, J. Lawrimore, V. F. Banzon, H.-M. Zhang, T. C. Peterson, and M. Menne, 2016: Further exploring and quantifying uncertainties for Extended Reconstructed Sea Surface Temperature (ERSST) version 4 (v4). J. Climate, doi:10.1175/JCLI-D-15-0430.1. in press.
Huang, B., V. F. Banzon, E. Freeman, J. Lawrimore, W. Liu, T. C. Peterson, T. M. Smith, P. W. Thorne, S. D. Woodruff, and H.-M. Zhang, 2015: Extended Reconstructed Sea Surface Temperature version 4 (ERSST.v4), Part I. Upgrades and intercomparisons. J. Climate, 28, 911-930, doi:10.1175/JCLI-D-14-00006.1.
- NOAA ERSST v4 ftp site (one month per file)
- NOAA ERSST v4 website with access to ascii and netcdf files (one month per file)
- ERSST v4 at NOAA-ESRL PSD (one netCDF file contains all months)
- NCAR Research Data Archive ERSST v4
- NOAA ERSST v5 ftp site (one month per file or all months in a single file)
- NOAA ERSST v5 website with access to ascii and netcdf files
Expert Developer Guidance
The following was contributed by Dr. Boyin Huang, NOAA National Climatic Data Center, January, 2016:
1. Data Description
The most recent version of the Extended Reconstruction of Sea Surface Temperature (ERSST) analysis is v4 (ERSST v4). The analysis is based on the International Comprehensive Ocean-Atmosphere Data Set (ICOADS) Release 2.5. At the end of every month, the ERSST analysis and its uncertainty are updated with the available GTS ship and buoy data for that month. The anomalies are computed with respect to a 1971-2000 climatology.
The monthly analysis extends from January 1854 to the present, but because of sparse data in the early years, the analyzed signal is damped before 1880. After 1880, the strength of the signal is more consistent over time. ERSST is suitable for long-term global and basin wide studies; local and short-term variations have been smoothed in ERSST. The spatial resolution is 2° in latitude and longitude, and temporal resolution is monthly.
2. Key strengths
Long historic analysis from January 1854 to present
Global coverage
Regular gridded data without missing value on ocean grids
Provides uncertainty at global and gridbox (2°×2°) scales
Updated on the 3rd day of every month for the data of previous month
3. Key weaknesses
Low spatial resolution of 2°×2° and low temporal resolution of monthly
Large uncertainty in the Arctic Ocean and the Antarctic circumpolar oceans
5. ERSST construction
The SSTs from in situ buoy and ship observations are used to reconstruct monthly SSTA in ERSST from 1854 to present. Buoy and ship observations between 1854 and 2007 are taken from ICOADS R2.5. The SST data from 2007 to present are collected from Global Telecommunications System (GTS) transmissions. The SSTs from ships or buoys are rejected under a quality control (QC) criterion that observed SSTs differ from the First-Guess (ERSST v3b) by more than 4 times STD of SST. Satellite observations are excluded due to difficulties in satellite SST bias adjustment. For example, in situ SST observations over the Southern Hemisphere oceans are too sparse to support necessary adjustments of the satellite observations.
The ship and buoy SSTs passing QC are first converted into SSTAs by subtracting the 1971-2000 2°×2° SST climatology interpolated to the in situ observations, and then bin-averaged to generate SSTAs at 2°×2° grids. The ship SSTA are adjusted to remove in homogeneities associated with changing observing practices through time based on night marine air temperature (NMAT) from UK Hadley Centre NMAT version 2 (HadNMAT2). For example, SSTs are observed by un-insulated wood buckets, canvas buckets in the earlier time, and by insulated buckets, engine room intakes, hull sensors, and buoys in the modern time. Therefore, observed in situ SSTs need to be adjusted to eliminate potential biases. In ERSST, the SST bias is estimated based on the difference between observed SSTs and collocated NMATs that were believed to be less biased or easily adjusted since the instruments observing the NMATs did not change much in the past.
The ship and buoy SSTAs are merged and bin-averaged into superobservations on 2°×2° grids. The merging of ship and buoy SSTAs is based on their proportions of the total number of observations. During the merging process, the number of buoy observations is weighted by a factor of 6.8 because of the higher reliability of buoy observations. The SSTA of super observations is further decomposed into low and high frequency components. The low frequency component of SSTA is constructed by applying a 26°×26° spatial running mean using monthly superobservations where the sampling ratio is larger than 3% (5 superobservations). The annual mean SSTA is then defined with a minimum of two months of valid data. The annually averaged SSTA is first filtered with a 3-point binomial average in both longitudinal and latitudinal directions, and then filtered with a 15-yr median filter. Finally, the SSTA is damped towards zero in high latitudes north of 80°N and south of 50°S. These processes are designed to filter out high frequency noise in time and space.
The high frequency component of SSTA, defined as the difference between original and low frequency SSTAs, is reconstructed by first applying a 3-month running filter that replaces invalid data with an average of pre- and post- month valid data. The filtered SSTA is then fitted to as many as 130 Empirical Orthogonal Teleconnections (EOTs) based on monthly SST from 1982 to 2005. The spatial patterns of EOTs look to be similar to those of EOF modes, but EOTs are damped across a scale of 5000 km in zonal and 3000 km in meridional directions. An EOT mode is accepted only if the ratio between its projection onto the grids containing superobservations and its projection onto all grids is great than 0.1. The EOT weighting coefficients are calculated by solving linear equations using LU decomposition method; and the invalid coefficients are filtered out by an average of pre- and post- month valid coefficients weighted with a lag-1 auto-correlation coefficient of EOT weighting coefficients. The high frequency SSTA is finally calculated by summing the accepted EOTs with fitted weighting coefficients. The SST data constructed from low and high frequency components are finally adjusted towards the freezing point of -1.8°C over the regions where the sea ice concentration is greater than 60%.
6. Major revisions from v3b to v4
The monthly ERSST v4 has been revised from v3b. Major revisions include: updated and substantially more complete input data from the International Comprehensive Ocean-Atmosphere Data Set (ICOADS) Release 2.5; revised Empirical Orthogonal Teleconnections (EOTs) and EOT acceptance criterion; updated sea surface temperature (SST) quality control procedures; revised SST anomaly (SSTA) evaluation methods; updated bias adjustments of ship SSTs using Hadley Nighttime Marine Air Temperature version 2 (HadNMAT2); and buoy SST bias adjustment not previously made in v3b. See details in Table 1.
Table 1. Major methodological innovations between the current ERSST v4 and its precursor ERSST.v3b.
| Methodological aspect | ERSST v4 choice | ERSST v3b choice | ||
| SST data |
ICOADS R2.5 (1875-2007) NCEP GTS (2008-present) |
ICOADS R2.4 (1875-2004) NCEP GTS (2008-present) |
||
| Ice data |
HadISST (1870-2010) NCEP (2011-present) |
UKMO (1870-1980) GFSC (1981-2004) NCEP (2004-present) |
||
| 130 EOTs | OISST.v2 1982-2011 | OISST.v2 1982-2005 | ||
| EOT criterion | Crit=0.1 | Crit=0.2 | ||
| EOT weighting | ||||
| SST STD for QC | OISST.v2 (1982-2011) | COADS (1950-1979) | ||
| SSTA calculation | At in situ locations | At regular grid boxes | ||
| Low frequency anomaly gap filling | Nearby anomaly filling | Zero-anomaly filling | ||
|
NMAT in bias adjustment |
HadNMAT2 (1875-2010) (Adjustments before 1886 are set to be the values of 1886) |
R2.4 (1875-1941) | ||
|
Bias adjustment smoothing |
Lowess filter Coefficient f=0.1 |
Linear | ||
|
Ship-buoy SST adjustment |
0.12°C is added to buoy SST |
Not applied | ||
7. SST uncertainty in ERSST v4
In v3b, uncertainties were assessed for the regional averaged SSTs only, while in v4 uncertainties are assessed for global averaged SST and SSTs at each gridbox. The uncertainties in v3b included sampling (low- and high- frequency) and bias uncertainty components, while in v4 uncertainties include reconstruction and parametric uncertainty components as detailed below:
The total uncertainty (Ut) of SST is defined as the standard combination of reconstruction uncertainty Ur and parametric uncertainty Up:
The total uncertainty (Ut) of SST is defined as the standard combination of reconstruction uncertainty Ur and parametric uncertainty Up:
![]() (1)
(1)
The reconstruction uncertainty Ur(x,y,t) for the grid box (x,y) and month t is defined as
![]() (2)
(2)
where D(x,y,t) is a spatiotemporally complete test dataset (e.g., a dataset from a climate model or a global analysis), and Af(x,y,t) is the reconstructed data by using the ERSST v4 reconstruction method but with the data from D(x,y,t). Since the ERSST v4 reconstruction system is a smoothing procedure and both Af(x,y,t) and D(x,y,t) are defined for every grid box, Ur(x,y,t) may be considered to represent a smoothing error.
The parametric uncertainty Up is defined as the standard deviation of reconstructed SSTs due to using different values of parameters in the ERSST v4:
![]() (3)
(3)
![]() (4)
(4)
where Am(x,y,t) is a member of reconstruction based upon the m’th group of parameters used in the ERSST v4, and is the mean of the all the M reconstructions corresponding to the M groups of parameters. We chose M=1000. These 1000 combinations are randomly picked from among the much larger population of possible 24 parameter combinations (Huang et al. 2016).
8. User guide
SST data in both NetCDF and ASCII formats can be downloaded from the ERSST web site in ASCII and NetCDF formats. A Readme file is provided and sample FORTRAN code is included for users to read the ASCII formatted data. In addition, a file (readme.status.changes) is provided on the ERSST web site. This file provides updated information on the latest ERSST data and changes. It is recommended that users read these files before using the data sets. Users can register when they download data to ensure they are kept informed on future ERSST changes and developments. SST uncertainty data are available upon request. ##
Cite this page
Acknowledgement of any material taken from or knowledge gained from this page is appreciated:
Huang, Boyin & National Center for Atmospheric Research Staff (Eds). Last modified "The Climate Data Guide: SST data: NOAA Extended Reconstruction SSTs, Version 4.” Retrieved from https://climatedataguide.ucar.edu/climate-data/sst-data-noaa-extended-reconstruction-ssts-version-4 on 2026-02-27.
Citation of datasets is separate and should be done according to the data providers' instructions. If known to us, data citation instructions are given in the Data Access section, above.
Acknowledgement of the Climate Data Guide project is also appreciated:
Schneider, D. P., C. Deser, J. Fasullo, and K. E. Trenberth, 2013: Climate Data Guide Spurs Discovery and Understanding. Eos Trans. AGU, 94, 121–122, https://doi.org/10.1002/2013eo130001
Key Figures

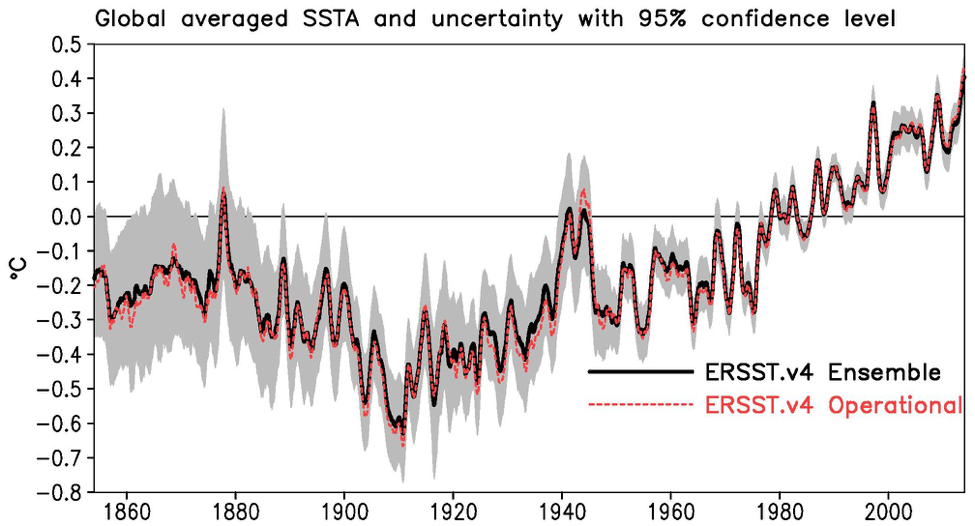
Global averaged SSTAs of ERSST v4 ensemble average (black line) and operational production (dashed red line). The shaded region represents the 95% confidence interval due to total quantified uncertainty in ERSST v4. (contributed by B. Huang)