Global surface temperature data: The Dynamically Consistent ENsemble of Temperature (DCENT)

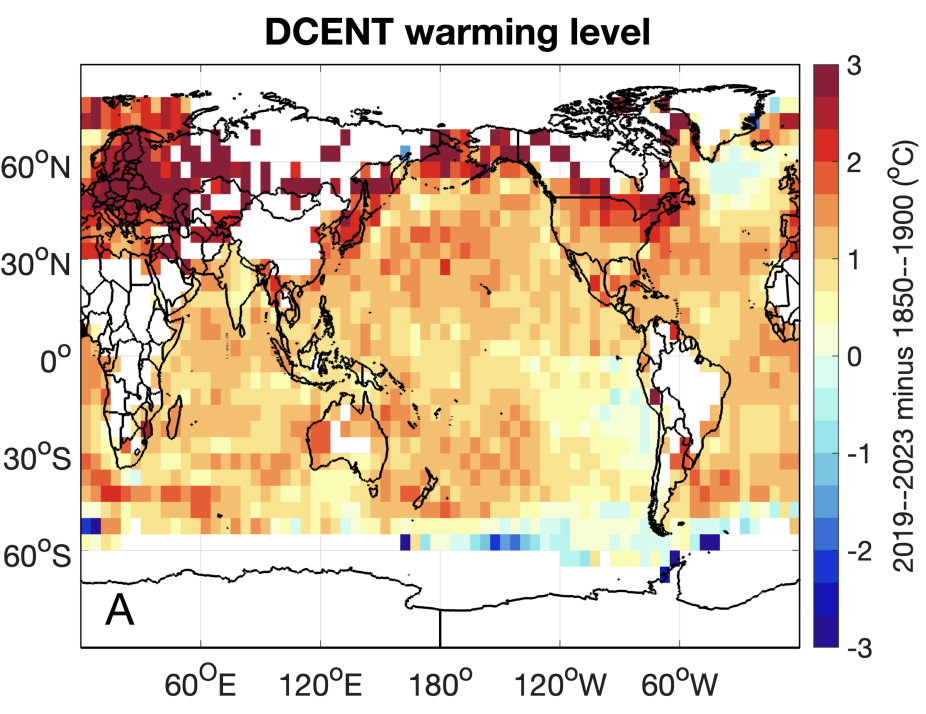
The Dynamically Consistent ENsemble of Temperature (DCENT) provides monthly, global, gridded, surface temperature anomalies since 1850. This product provides combined land surface air temperature (LSAT) and sea surface temperature (SST) anomalies at monthly 5° x 5° resolution. An important feature of DCENT is that both land and ocean measurements are used when bias-correcting observations, an improvement from most existing surface temperature products which analyze LSAT and SST records separately. The LSAT and SST bias corrections are performed using physics-informed statistical techniques. As a result, DCENT reduces regional biases and data artifacts compared with existing surface temperature products. The DCENT product includes a full uncertainty assessment through a 200 member ensemble which samples the distribution of uncertainties across the data homogenisation process.
Key Strengths
Data homogenization and bias correction within and across LSAT and SST archives
Comprehensive estimates of uncertainties associated with data correction that is provided as a 200-member ensemble
Long record starting in 1850
Key Limitations
Coarse spatial resolution of 5° x 5°
Estimates are not interpolated, leading to sparse global coverage in the early record
Chan, D., Gebbie, G., Huybers, P. et al. A Dynamically Consistent ENsemble of Temperature at the Earth surface since 1850 from the DCENT dataset. Sci Data 11, 953 (2024). https://doi.org/10.1038/s41597-024-03742-x
Expert Developer Guidance
The following was submitted by Duo Chan, August, 2024:
What are the typical research applications of this data set?
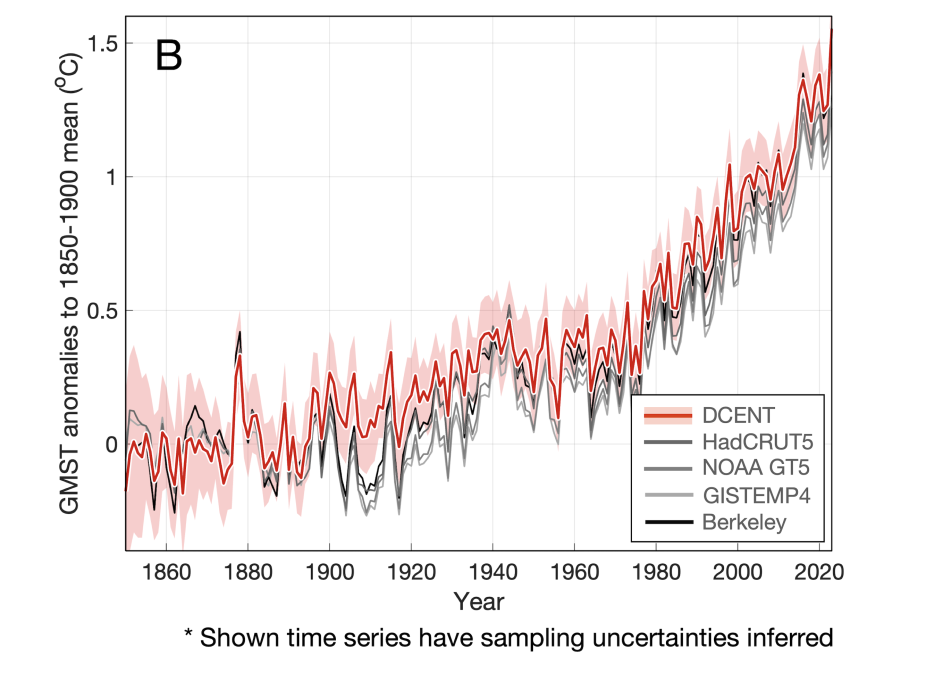
DCENT is an ensemble of monthly gridded temperature anomalies since the 1850s. The data set is suitable for monitoring and quantifying historical and recent trends and variability, detecting and attributing surface temperature changes, validating and constraining climate models, and informing policy goals aimed at mitigating the impacts of global change.
DCENT also provides land surface air temperature (LSAT) and sea-surface temperature (SST)-only estimates, respectively named DCLSAT and DCSST, for analyses segregated by land and ocean.
Note that DCENT has a monthly resolution and is not yet infilled to have global coverage. As a result, it is not suitable for examining synoptic-scale extreme events nor for use as a boundary condition for performing AMIP-type model experiments.
How is uncertainty characterized in these data?
The DCENT ensemble consists of 200 members, each representing an equally likely realization of the data generation process. As a result, although the ensemble-mean estimate is provided, users are encouraged to explore and analyze the entire 200-member ensemble to effectively quantify uncertainty.
What are some comparable data sets, if any?
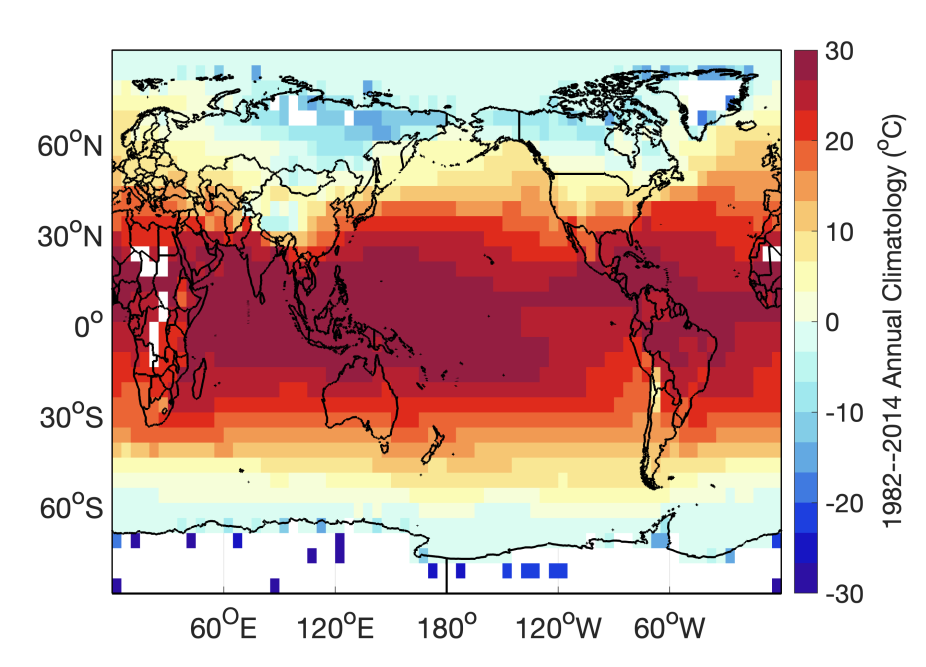
DCENT, DCLAST, and DCSST are most comparable, respectively, to the non-infilled versions of the HadCRUT, CRUTEM, and HADSST data sets. Note that because DCENT uses the 1982–2014 SST climatology derived from satellite observations, its anomalies are relative to a more recent climatology than the 1960–1990 climatology period used by HadCRUT.
To compare DCENT with infilled observational temperature data sets, such as the HadCRUT analysis, NOAA Global Temperature, GISTEMP, and Berkeley Earth, we recommend masking data to common coverage across the data sets being compared. Note that DCENT temperature anomalies in the Arctic Ocean are SSTs, whereas those in infilled temperature estimates are often air temperature anomalies above sea ice. Special attention is, therefore, required when studying Arctic change.
How does one best compare these data with model output?
To compare against model output, we recommend masking the model coverage to that of DCENT. In addition, as noted above, temperature over the ocean should be SST (CMIP6 variable name ’tos’) rather than surface air temperature (CMIP6 variable name ’tas’) because DCENT uses SST rather than marine air temperatures over the ocean. Because the simulated tos fields contain water temperatures over regions covered by sea-ice, no additional treatment other than masking simulated tos is required when comparing Arctic change.
What are the most common mistakes that users encounter when processing or interpreting these data?
When calculating large-scale averaged quantities, such as the annual global mean surface temperature (GMST), we recommend users first calculate the global average of monthly data and then average over months to acquire annual values. This approach accounts for seasonality in data coverage and generally reduces uncertainties associated with sparsely sampled grids.
Were corrections made to account for changes in observing systems or practices, sampling density, satellite drift, or similar issues?
DCENT has accounted for a variety of changes in observation systems and practices, including removing discontinuities in land station temperature series due to changing instrumentation, station locations, and urbanization (Chan et al., 2024c), as well as changing measurement methods and bias structures of SSTs at the level of nations and different ship groupings (Chan and Huybers, 2019; 2021). DCENT also contains harmonized temperature estimates between land and the ocean archives using a physics-based model (Chan et al., 2023).
Are there spurious (non-climatic) features in the temporal record?
Whereas all observational datasets will have spurious features to some extent, we suggest that DCENT, with its improved data homogenization and bias correction, is the most accurate estimate of historical surface temperatures. Improvements are associated with phenomenon on both global and regional scales, including correcting land-ocean inconsistencies before the 1940s, anomalous warmth during the Second World War, and the North Atlantic appearing to warm twice as fast as the North Pacific during the early 20th century (see figure below).
How frequently are the data updated?
DCENT will be updated annually in April.
Additional References
Chan D., Gebbie G., Huybers P., & Kent E. C. (2024a). An Ensemble of Earth Surface Temperature Change since 1850 with Dynamically Consistent Land and Ocean Evolution. Scientific Data.
Chan D., Gebbie G., & Huybers P. (2024b). Larger and Steadier Warming since 1850 from Harmonized Land and Ocean Temperature Records. Under review.
Chan D., Gebbie G., & Huybers P. (2024c). An improved ensemble of land-surface air temperatures since 1880 using revised pair-wise homogenization algorithms accounting for autocorrelation. Journal of Climate , 37(7), 2325-45.
Chan D., Gebbie G., & Huybers P. (2023). Global and Regional Discrepancies between Early 20th Century Coastal Air and Sea-Surface Temperature Detected by a Coupled Energy-Balance Analysis. Journal of Climate, 34(9), 2205-20.
Chan D., & Huybers P. (2021). Correcting sea surface temperature observations removes World War II warm anomaly. Journal of Climate, 34(11), 4585-4602.
Chan D., Kent E., Berry D. & Huybers P. (2019). Correcting datasets leads to more homogeneous early 20th century sea surface warming. Nature , 571, 393-397.
Chan D. & Huybers P. (2019). Systematic differences in bucket sea surface temperature measurements amongst nations identified using a linear-mixed-effect method. Journal of Climate, 32(5), 2569-2589.
Cite this page
Acknowledgement of any material taken from or knowledge gained from this page is appreciated:
Chan, Duo & National Center for Atmospheric Research Staff (Eds). Last modified "The Climate Data Guide: Global surface temperature data: The Dynamically Consistent ENsemble of Temperature (DCENT).” Retrieved from https://climatedataguide.ucar.edu/climate-data/dcent on 2026-07-22.
Citation of datasets is separate and should be done according to the data providers' instructions. If known to us, data citation instructions are given in the Data Access section, above.
Acknowledgement of the Climate Data Guide project is also appreciated:
Schneider, D. P., C. Deser, J. Fasullo, and K. E. Trenberth, 2013: Climate Data Guide Spurs Discovery and Understanding. Eos Trans. AGU, 94, 121–122, https://doi.org/10.1002/2013eo130001
Key Figures
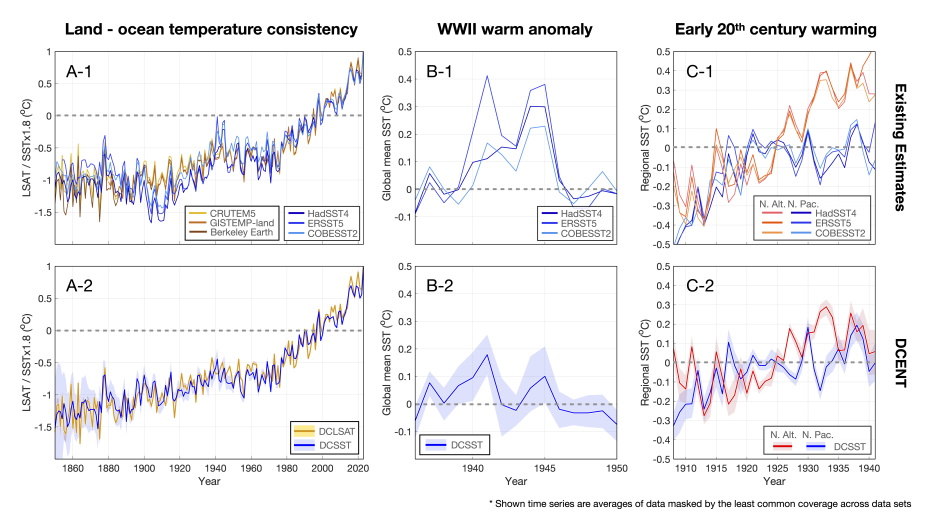
Enhanced Physical Consistency in DCENT Across Key Climate Anomalies. (A-1) Continental-mean LSAT (yellow) versus oceanic-mean SST (blue) anomalies from existing datasets, including CRUTEM5, GISTEMP4, and Berkeley Earth for LSAT, and HadSST4, ERSST5, and COBESST2 for SST. Anomalies are relative to the 1982–2014 climatology (following Chan et al., 2024b), with SST anomalies scaled by 1.8 for visualization and comparison purposes. (B-1) Oceanic-mean SST anomalies from 1936 to 1950 based on existing SST estimates. Anomalies are relative to the mean over the five years before and after the war, i.e., 1936–1940 and 1946–1950 (following Chan and Huybers, 2021). (C-1) Basin-wise SST anomalies from existing SST estimates over the North Atlantic (red) and the North Pacific (blue) during the early 20th century. Anomalies are relative to the 1920–1929 mean (following Chan et al., 2019). The bottom mirrors the top row but for DCENT. All time series are averaged over the least common monthly data coverage after re-gridding all datasets to a common 5◦×5◦ monthly resolution.