Global surface temperature: Maximum Likelihood Estimates of Temperatures using HadCRUT5 (Version 1.2)

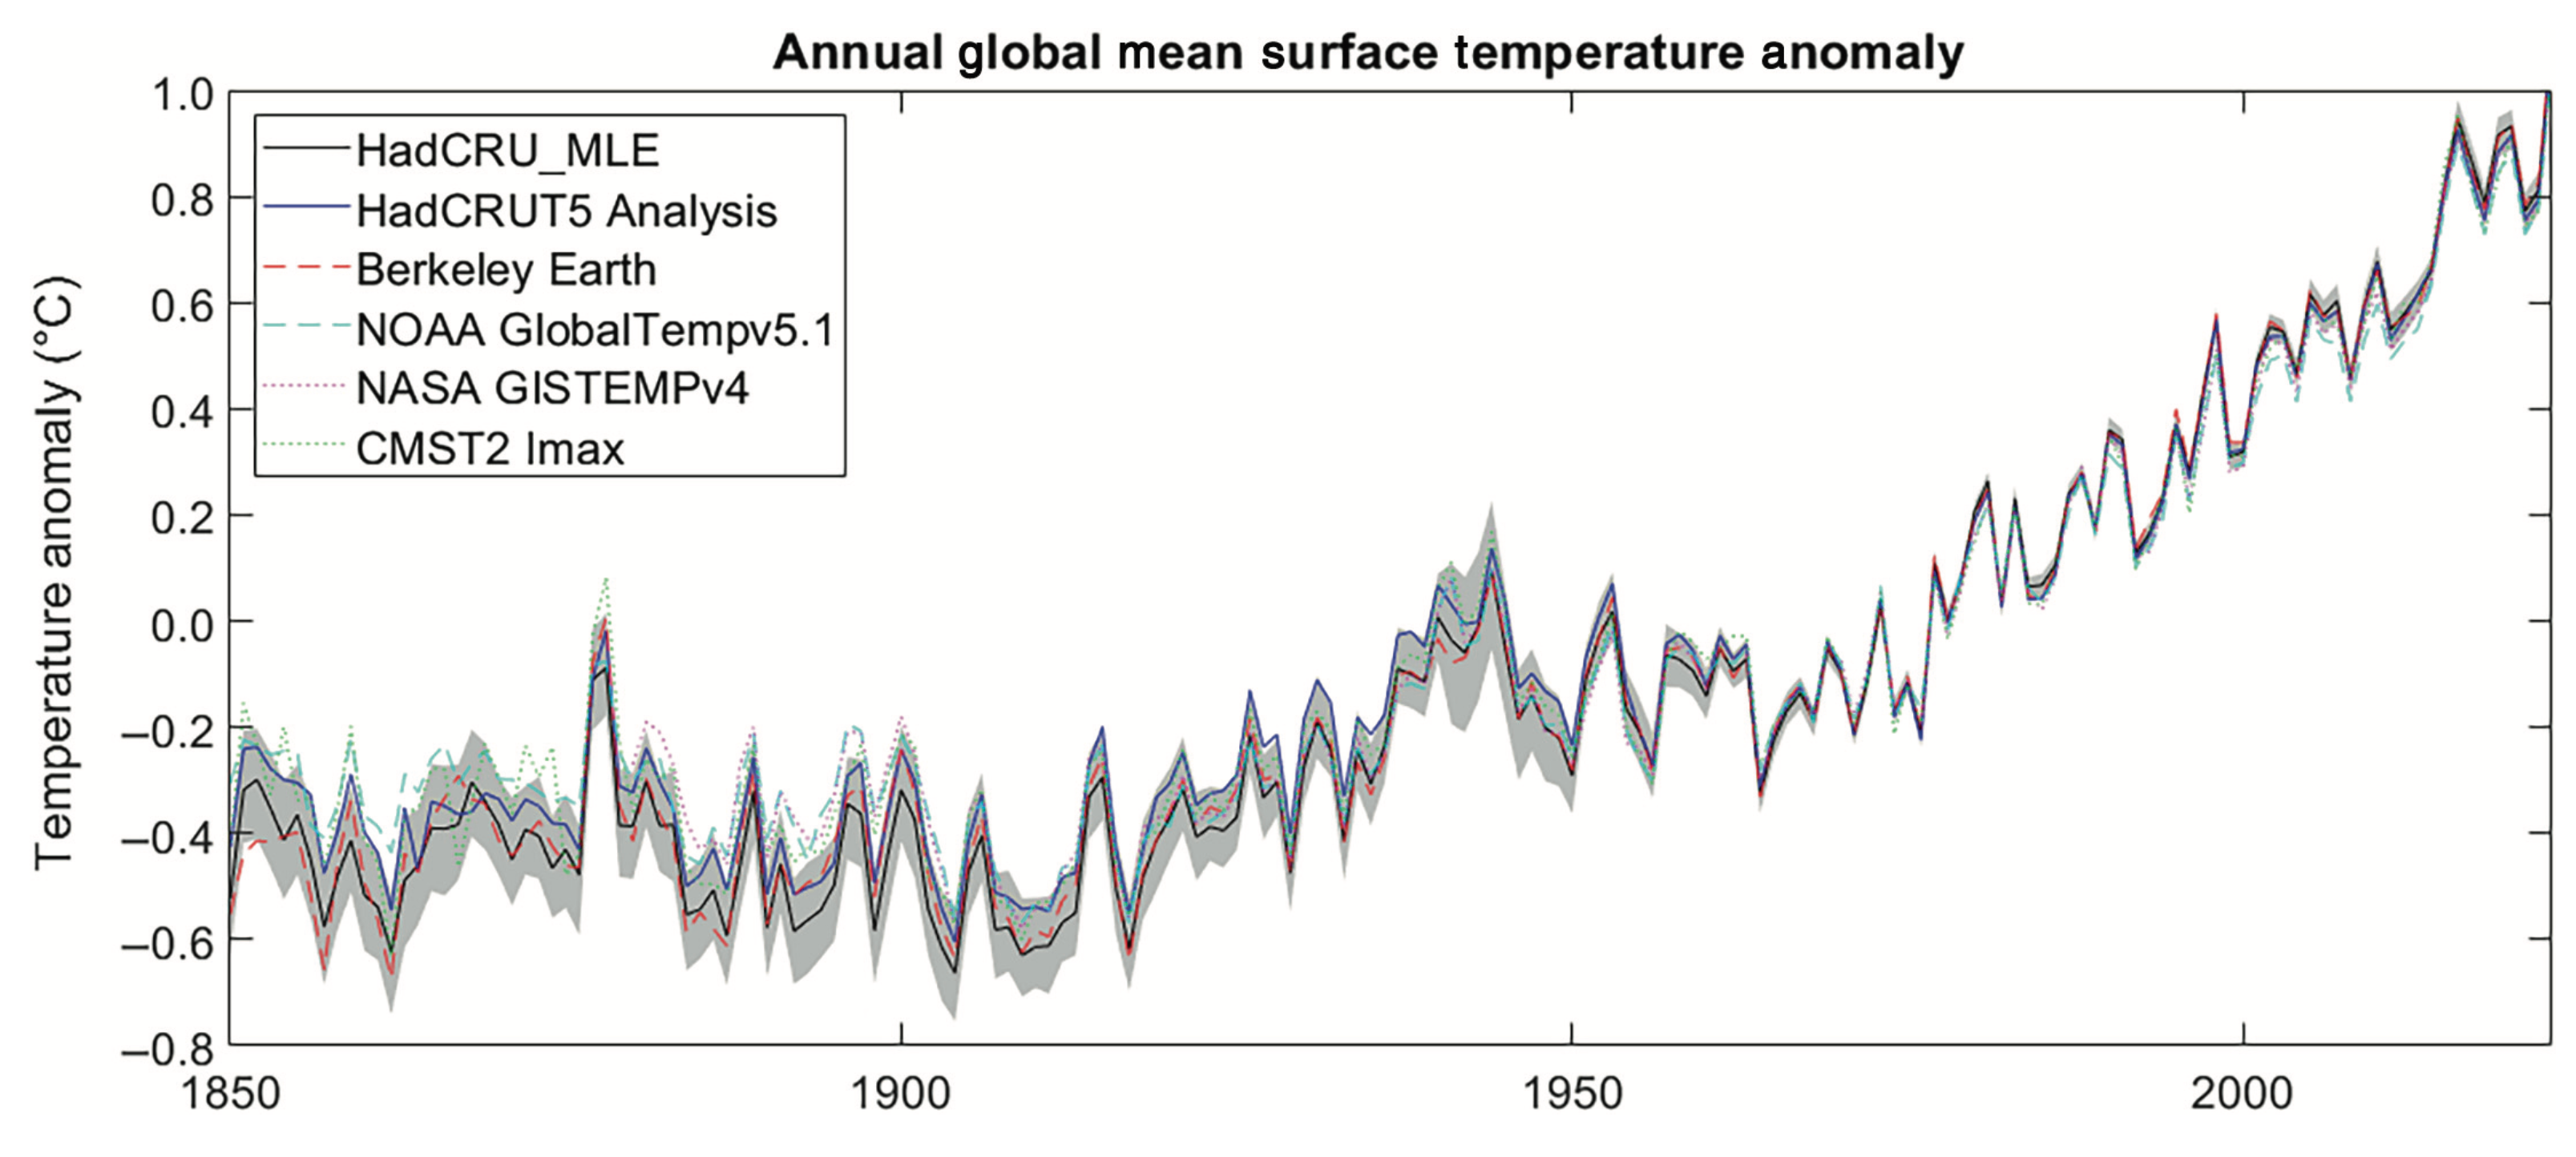
The Maximum Likelihood Estimates of Temperatures using HadCRUT5 Version 1.2 (HadCRU_MLE_v1.2) dataset provides global complete surface temperature estimates since 1850, with monthly 5°x5° resolution. It uses more sophisticated statistical models to fill data gaps in the non-infilled version of HadCRUT5. The statistical models used in HadCRU_MLE_v1.2 better account for the under-sampled, non-uniform warming across the planet. Additional complexity in infilling comes from melting sea ice in polar regions, which requires transitioning from using air temperature above sea ice for ice cover regions to using water temperature for the open ocean. HadCRU_MLE_v1.2 better considers this transition by accounting for differences in the temperature climatology between air and the ocean, increasing the estimate of global mean surface temperature (GMST) warming by 0.079°C. In addition to improved estimates of GMST, HadCRU_MLE_v1.2 is generally an improved dataset relative to HadCRUT5 for studying long-term trends in the polar regions, although caution is required for the southern hemisphere, where estimates of sea-ice concentration are uncertain.
Key Strengths
Improved infilling methods that better account for polar amplification and changes in sea-ice cover.
Leverages the methodology and uncertainty assessment from the longstanding and well-documented HadCRUT5 product.
Uncertainty quantification provided through confidence intervals and uncertainty ensembles
Key Limitations
Sea-ice concentration, especially in the Southern Hemisphere, is highly uncertain
Assumes discontinuous temperature between the open ocean and sea-ice regions
Calvert, B. T. (2024). Improving global temperature datasets to better account for non‐uniform warming. Quarterly Journal of the Royal Meteorological Society, 150(763), 3672-3702.
Expert User Guidance
Methodological Differences from HadCRUT5
Estimating the global mean temperature from historically instrumental measurements that only sample certain parts of the globe is challenging. Existing methods such as HadCRUT5, use Gaussian-process regression (also known as Kriging) to estimate temperature anomalies in unobserved regions. This approach often involves inferring air temperature anomalies over land and ocean covered by sea ice, then sea-surface temperature anomalies over the open ocean. The two independent inferences are combined later according to the fraction of land, sea-ice, and open ocean in individual grid boxes (e.g., Morice et al., 2021).
Due to considerations of computational efficiency and statistical tractability, these Kriging methods make simplifying assumptions such as a uniform mean warming across space. However, we expect the warming to be greater in high latitudes due to climate feedbacks known collectively as Arctic amplification (Holland and Bitz, 2003). This issue is further complicated by the poor and sparse observations of high-latitude regions. As a result, assuming uniform warming and estimating this value from data concentrated in low and mid-latitudes can introduce a low bias in the estimated global warming. HadCRU_MLE_v1.2 uses more sophisticated model structure to explicitly allow enhanced polar warming. This method increases the estimated polar warming by 66% compared to a method assuming uniform warming, which results in an increase in the estimate of global mean surface temperature (GMST) warming by 0.006°C.
An additional complication is associated with the changes in the presence of open ocean versus sea ice. Existing methods use 2m air temperature anomalies when sea ice is present and sea surface temperature anomalies when sea ice is not present. Yet, it is also useful to consider absolute temperatures (not temperature anomalies), and water is generally warmer than the air above it (Serreze and Barry., 2014). Not accounting for this difference in mean absolute temperatures would hence underestimate warming. HadCRU_MLE_v1.2 accounts for this bias and estimates the GMST warming level to increase by another 0.069°C. Among these, ~0.02°C comes from Arctic sea ice melting since the 1980s, and ~0.05°C is from Antarctic sea ice loss from 1940 to 1980. However, note that compared with the Arctic sea-ice loss observed by satellites, the apparent decrease in Antarctic sea ice before the satellite era is inferred from limited climatological sea-ice charts (Titchner et al., 2014). In addition, HadCRU_MLE_v1 assumes discontinuous climatologies between the open ocean and air temperatures above sea ice, whereas, in reality, temperatures are continuous, and the difference is more subtle. Testing on climate model simulations, Calvert (2024) estimates the effect of using continuous climatologies to halve the estimated warming bias. Subtleties in the treatment of sea ice notwithstanding, HadCRU_MLE_v1.2 provides a more complete perspective on treating surface temperature changes associated with sea-ice loss.
In addition to the two major changes discussed above, there are other parts in the analysis required to estimate surface temperature that this product improves upon that do not have an impact on the global mean. Examples include estimating a reliable climatology of a warming temperature series not fully sampled, distinguishing the global fingerprints between forced warming versus internal variability, and inferring the land and ocean temperatures together rather than treating them separately. Calvert (2024) has thought through and addressed these in HadCRU_MLE_v1.2.
What are the typical research applications of this data set?
Similar to HadCRUT5, GISTEMP4, NOAA Global Temperature 6, DCENT, and Berkeley Earth temperature estimate, HadCRU_MLE_v1.2 is suitable for monitoring and quantifying historical and recent trends, detecting and attributing surface temperature changes, validating and constraining climate models.
What are the most common mistakes that users encounter when processing or interpreting these data?
HadCRU_MLE_v1.2 is spatially complete and easy to use for most climate analyses. There is an uncertainty ensemble provided which enables statistically-correct propagation of observational uncertainty into additional analyses.
Were corrections made to account for changes in observing systems or practices, sampling density, satellite drift, or similar issues?
HadCRU_MLE_v1.2 has carefully accounted for sampling uncertainty arising from various steps of gap filling, including estimating climatology with undersampled time series, accounting for non-uniform warming pattern, and better treatment of temperature jumps associated with sea-ice loss, etc.
How does one best compare these data with model output?
One needs to replace simulated water temperatures (tos) with air temperatures for sea-ice-covered regions for an apple-to-apple comparison with HadCRU_MLE_v1.2. Note that the replacement should be done before calculating temperature anomalies.
Are there spurious (non-climatic) features in the temporal record?
Instrumental data biases, such as the World War II warm anomaly, should be the same as the non-infilled version of HadCRUT5, the input data before infilling. Please check this page (https://climatedataguide.ucar.edu/climate-data/dcent) for more details on instrumental temperature biases.
How do I access these data? How frequently is the data updated?
Data can be accessed from https://doi.org/10.26050/WDCC/HadCRU_MLE_v1.2, although a WDCC account is required.
References
Serreze, M. C., & Barry, R. G. (2014). The Arctic climate system. Cambridge University Press.
Calvert, B. T. (2024). Improving global temperature datasets to better account for non‐uniform warming. Quarterly Journal of the Royal Meteorological Society, 150(763), 3672-3702.
Holland, M. M., & Bitz, C. M. (2003). Polar amplification of climate change in coupled models. Climate dynamics, 21(3), 221-232.
Morice, C. P., Kennedy, J. J., Rayner, N. A., Winn, J. P., Hogan, E., Killick, R. E., ... & Simpson, I. R. (2021). An updated assessment of near‐surface temperature change from 1850: The HadCRUT5 data set. Journal of Geophysical Research: Atmospheres, 126(3), e2019JD032361.
Titchner, H. A., & Rayner, N. A. (2014). The Met Office Hadley Centre sea ice and sea surface temperature data set, version 2: 1. Sea ice concentrations. Journal of Geophysical Research: Atmospheres, 119(6), 2864-2889.
Cite this page
Acknowledgement of any material taken from or knowledge gained from this page is appreciated:
Chan, Duo & National Center for Atmospheric Research Staff (Eds). Last modified "The Climate Data Guide: Global surface temperature: Maximum Likelihood Estimates of Temperatures using HadCRUT5 (Version 1.2).” Retrieved from https://climatedataguide.ucar.edu/climate-data/global-surface-temperature-maximum-likelihood-estimates-temperatures-using-hadcrut5 on 2026-02-07.
Citation of datasets is separate and should be done according to the data providers' instructions. If known to us, data citation instructions are given in the Data Access section, above.
Acknowledgement of the Climate Data Guide project is also appreciated:
Schneider, D. P., C. Deser, J. Fasullo, and K. E. Trenberth, 2013: Climate Data Guide Spurs Discovery and Understanding. Eos Trans. AGU, 94, 121–122, https://doi.org/10.1002/2013eo130001

