E-OBS: High-resolution gridded mean/max/min temperature, precipitation and sea level pressure for Europe & Northern Africa
E-OBS is a high spatial resolution daily gridded data that covers the European region and is based on the station data collated by the ECA&D initiative (Klein Tank et al., 2002). These data are supplied by many European National Meteorological Services and other data providers across Europe and the Middle East. The dataset spans the period 1 January 1950 to the present, and is updated frequently.
E-OBS include daily mean, maximum, and minimum temperature values as well as daily total precipitation and mean sea level pressure. E-OBS is widely used for monitoring extremes across Europe and for the validation of numerical models.
Key Strengths
Based on a dense set of surface observations sourced directly from the National Meteorological Services
Updated twice a year, with provisional monthly updates
The E-OBS and the underlying station dataset are the backbone of the Climate Data node for WMO RA VI Regional Climate Center
Key Limitations
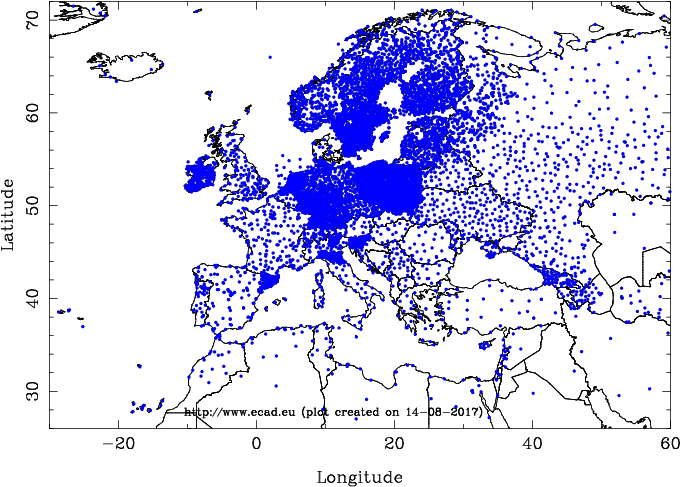
The station network is not homogeneous is space - with areas particularly in Europe's south east and northern Africa poorly represented.
The network is not homogeneous in time, with a steep increase in the number of used stations in the early 1950s. This means that trend analyses should be done with caution.
See the data policy document at: https://www.ecad.eu/documents/ECAD_datapolicy.pdf
Expert Developer Guidance
The following was contributed by Dr. Gerard van der Schier, May, 2019:
E-OBS consists of daily mean, minimum, and maximum, temperature values, daily precipitation totals gridded and sea level pressure at a resolution of approximately 10 km. Initially, this was developed to provide validation for the suite of Europe-wide climate model simulations produced as part of the EU ENSEMBLES project. While E-OBS remains an important data set for model validation, it is also used more generally for monitoring the climate across Europe, particularly with regard to the assessment of the magnitude and frequency of daily extremes. Although E-OBS was originally aimed at the Regional Climate Modelling community for validation and calibration of model results, the usage of E-OBS has expanded to many other disciplines, including biology (e.g. species migration), hydrology (river. The station network, where all station data are sourced directly from the European National Meteorological and Hydrological Services (NMHSs) or other data holding institutes, is dense. For a considerable number of countries the number of stations used is the complete national network and therefore much more dense than the station network that is routinely shared among NMHSs (which is the basis of other gridded datasets).
The density of stations gradually increases through collaborations with NMHSs within European research contracts. The position of E-OBS is unique in Europe because of the relatively high spatial resolution (0.1 degree), the daily resolution of the dataset, the provision of precipitation, temperature and air pressure and the length of the dataset (starting in January 1950 and updated regularly). Finally, the station data on which the E-OBS is based are available through the ECA&D webpages (where the owner of the data has given permission to do so). In these respects it contrasts with other datasets. The updates of the dataset, twice a year for the complete dataset and provisional monthly updates, makes that monitoring of European climate is possible, as is done e.g. through the Copernicus Climate Change Service State-of-the-Climate bulletins.
From version 18.0e onward, a new interpolation method for the E-OBS temperature and precipitation data set has been introduced. A particular focus in this study is the provision of a better estimate of uncertainty of the gridded data through the generation of an ensemble of daily realizations. Hence the 'e' in the version numbering. This method has been documented by Cornes et al. (2018). The interpolation method marks a major departure from the method used in earlier operational versions of E-OBS, as documented by Haylock et al. (2008). The uncertainty is captured by a 100-member ensemble of each daily field, which provides an improved estimation of uncertainty over the estimates used in earlier versions. In terms of both climatological averages and extreme values, the ensemble-mean grids in the new version of E-OBS are broadly comparable to the best guess grids in the earlier version and we stress that station coverage is the most important factor in determining the success of the gridded data. Nonetheless, users will notice differences between the two E-OBS versions, and this results from the different gridding methods used in the two versions of the data set. Furthermore, while the ensemble mean can be taken as grid box averages, the individual ensemble members display a spatial variation that is between a point and a box average value, although this discrepancy varies across the domain in relation to station density. The uncertainty quantified by the ensemble data set is more closely related to station density than uncertainty values in the original data set, although the uncertainty in data-sparse regions, while much larger in these areas than in the original data set, still appears to be an underestimate of the true uncertainty. The uncertainty quantified by the ensemble only relates to interpolation uncertainty.##
Cite this page
Acknowledgement of any material taken from or knowledge gained from this page is appreciated:
van der Schrier, Gerard & National Center for Atmospheric Research Staff (Eds). Last modified "The Climate Data Guide: E-OBS: High-resolution gridded mean/max/min temperature, precipitation and sea level pressure for Europe & Northern Africa.” Retrieved from https://climatedataguide.ucar.edu/climate-data/e-obs-high-resolution-gridded-meanmaxmin-temperature-precipitation-and-sea-level on 2026-02-20.
Citation of datasets is separate and should be done according to the data providers' instructions. If known to us, data citation instructions are given in the Data Access section, above.
Acknowledgement of the Climate Data Guide project is also appreciated:
Schneider, D. P., C. Deser, J. Fasullo, and K. E. Trenberth, 2013: Climate Data Guide Spurs Discovery and Understanding. Eos Trans. AGU, 94, 121–122, https://doi.org/10.1002/2013eo130001
Key Figures
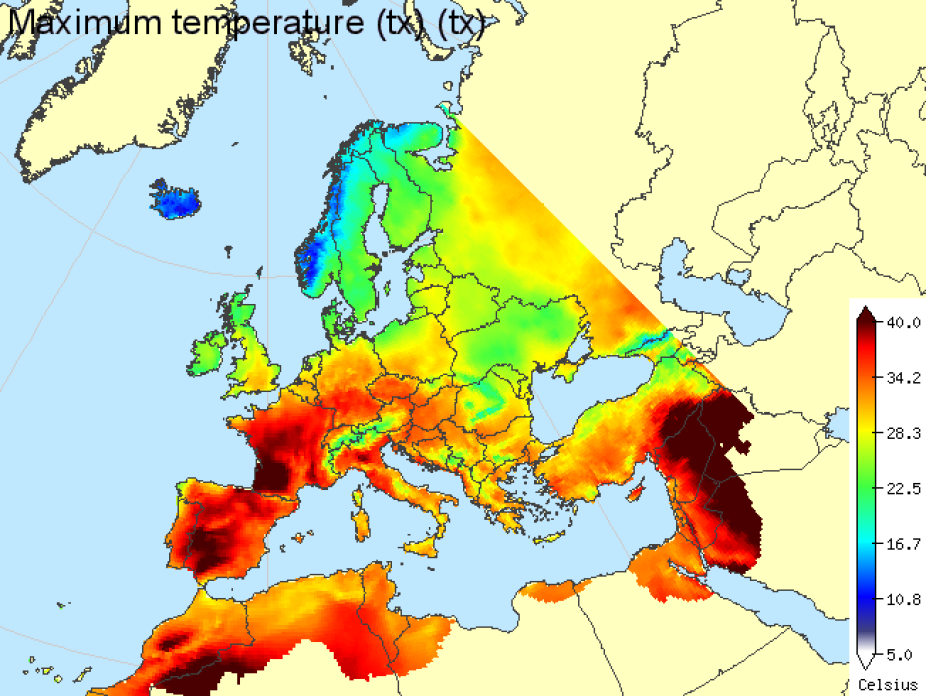
E-OBS-based Daily Maximum Temperature for August 4, 2003 - one of the hottest days in Europe. (contributed by G van Der Schrier)
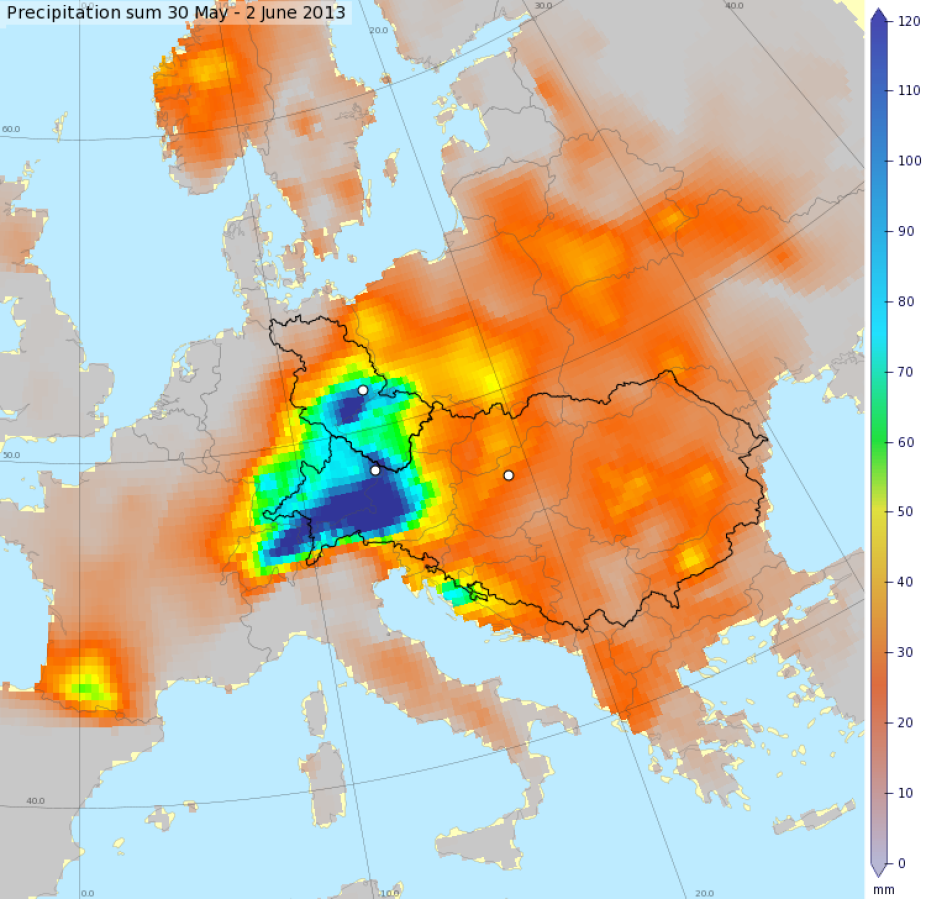
E-OBS-based accumulated precipitation for May 30 - June 2 2013 which led to massive floods in central Europe (contributed by G van Der Schrier)

Station data set of ECA&D used in the production of E-OBS (contributed by G van Der Schrier)
Other Information
- Cornes et al. (2018) An Ensemble Version of the E‐OBS Temperature and Precipitation Datasets.
- Haylock et al. (2008) A European daily high-resolution gridded data set of surface temperature and precipitation for 1950-2006.
- van den Besselaar et al. (2011) A European daily high-resolution observational gridded data set of sea level pressure
- Klein Tank et al. (2002) Daily dataset of 20th-century surface air temperature and precipitation series for the European Climate