CRU TS Gridded precipitation and other meteorological variables since 1901
The CRU TS series of data sets (CRU TS = Climatic Research Unit Time series) contain gridded monthly fields of precipitation, daily maximum and minimum temperatures, cloud cover, and other variables covering Earth's land areas for 1901-2022 (CRU TS4.0 is the recent major release). The data set is gridded to 0.5x0.5 degree resolution, based on analysis of over 4000 individual weather station records, and spatially complete. Many of the input records have been homogenized, but the data set itself is not strictly homogeneous. Long-term trends of air temperature over large areas are very similar to data sets such as CRUTEM4. The precipitation data have been used to assess global precipitation variability and to derive gridded drought indices such as the sc-PDSI and the SPI. The large number of variables enables many additional studies of climate variability and extremes. Nonetheless, when possible, studies of trends should consider whether the trends are physically consistent with other variables from independent data sets. This is particularly important when using CRU TS to assess questions around variability and extremes and the dataset reports climatological values for grid cells without sufficient reporting stations.
Key Strengths
Compiles station data of multiple variables from numerous data sources into a consistent format
Uses the station data to compute variables such as potential evapotranspiration, diurnal temperature range, and number of frost and rain days
Key Limitations
Although many of the input data were homogenized, the data set is not strictly homogenous. Use trends with caution.
Substantially fewer stations used than GPCC
Complete spatial coverage is achieved by reporting a climatological value if a grid cell does not have sufficient reporting stations at a given time point
from BADC:
University of East Anglia Climatic Research Unit (CRU). [Phil Jones, Ian Harris]. CRU TS3.21: Climatic Research Unit (CRU) Time-Series (TS) Version 3.21 of High Resolution Gridded Data of Month-by-month Variation in Climate (Jan. 1901 - Dec. 2012), [Internet]. NCAS British Atmospheric Data Centre, 2013, Date of citation. Available from http: //badc.nerc.ac.uk/view/badc.nerc.ac.uk__ATOM__ACTIVITY_0c08abfc-f2d5-11e2-a948-00163e251233 ; doi: 10.5285/D0E1585D-3417-485F-87AE-4FCECF10A992
registration required; academic use
Cite this page
Acknowledgement of any material taken from or knowledge gained from this page is appreciated:
National Center for Atmospheric Research Staff (Eds). Last modified "The Climate Data Guide: CRU TS Gridded precipitation and other meteorological variables since 1901 .” Retrieved from https://climatedataguide.ucar.edu/climate-data/cru-ts-gridded-precipitation-and-other-meteorological-variables-1901 on 2026-05-23.
Citation of datasets is separate and should be done according to the data providers' instructions. If known to us, data citation instructions are given in the Data Access section, above.
Acknowledgement of the Climate Data Guide project is also appreciated:
Schneider, D. P., C. Deser, J. Fasullo, and K. E. Trenberth, 2013: Climate Data Guide Spurs Discovery and Understanding. Eos Trans. AGU, 94, 121–122, https://doi.org/10.1002/2013eo130001
Key Figures
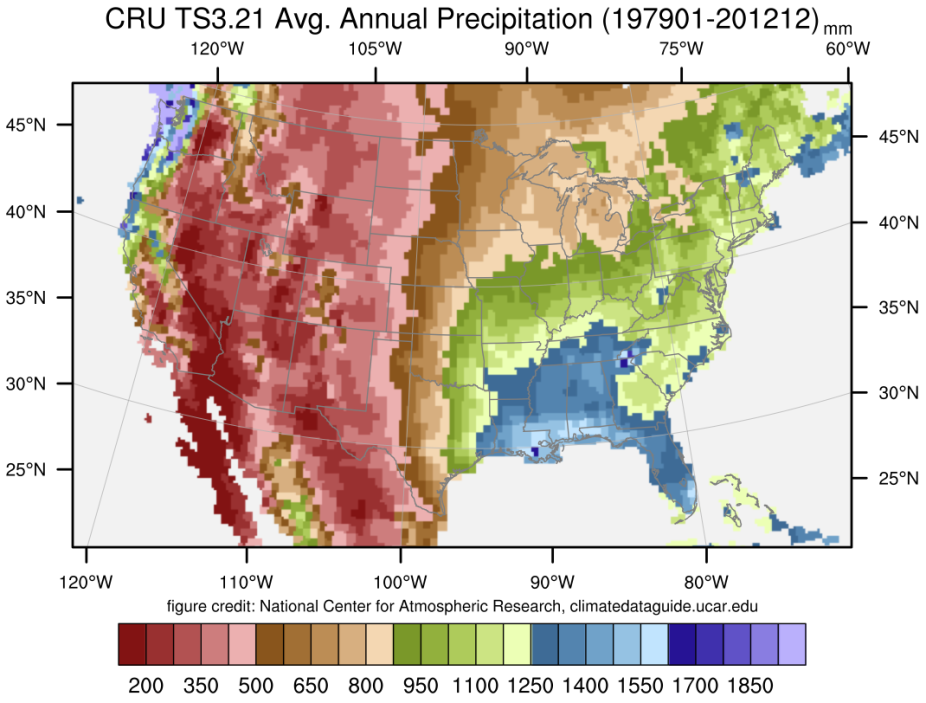
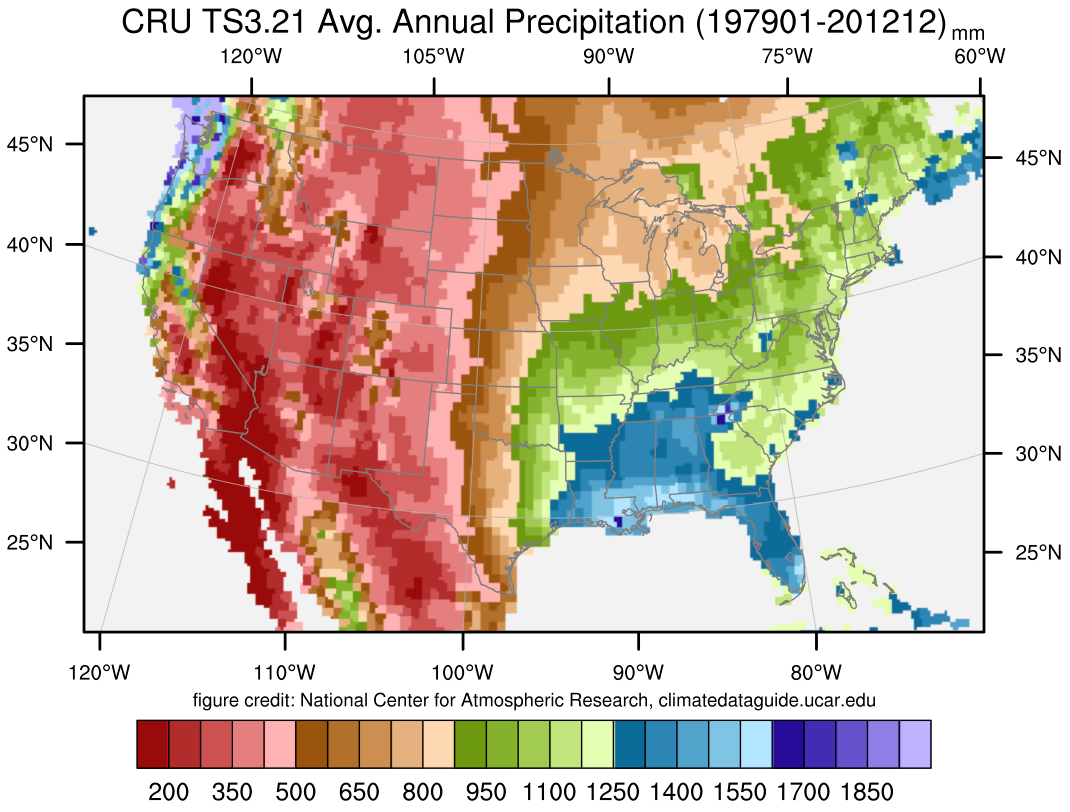
Average annual precipitation amount across the United States according to CRUTS3.21 (credit: NCAR Climate Data Guide, D. Schneider)
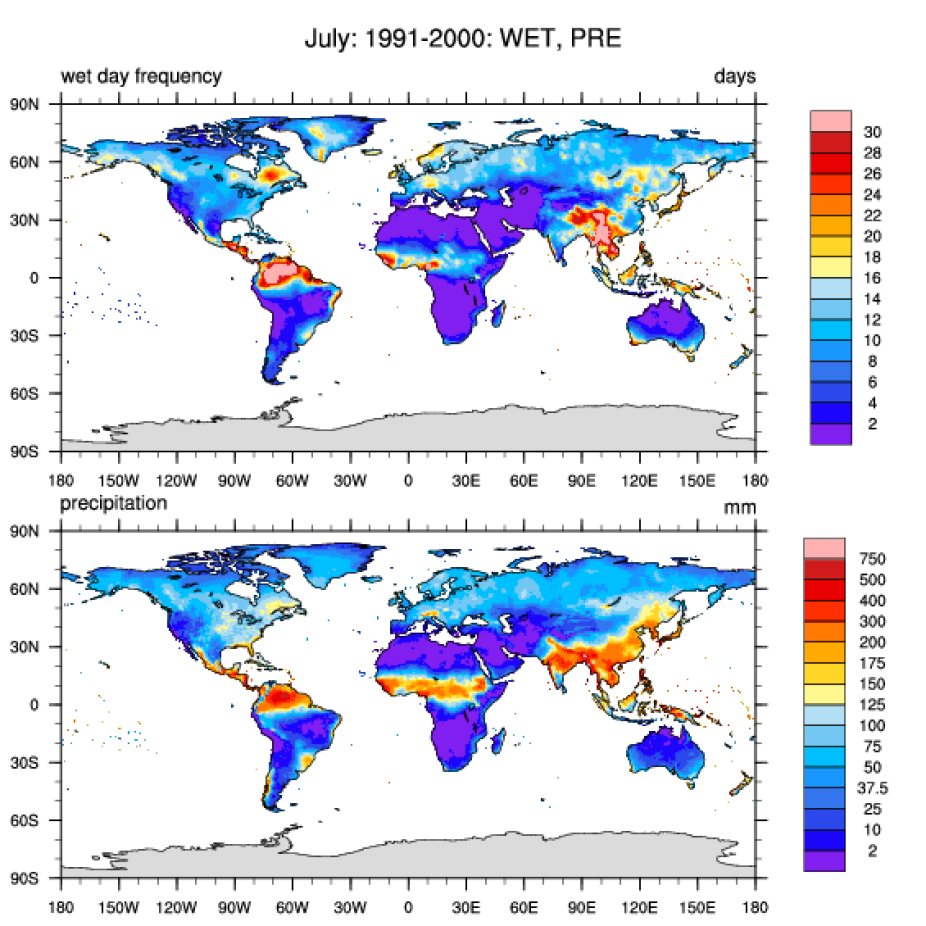
CRU TS3.21: July climatological wet day frequency (WET) and precipitation (PRE) for 1991-2000. (credit: NCAR Climate Data Guide, D. Shea)
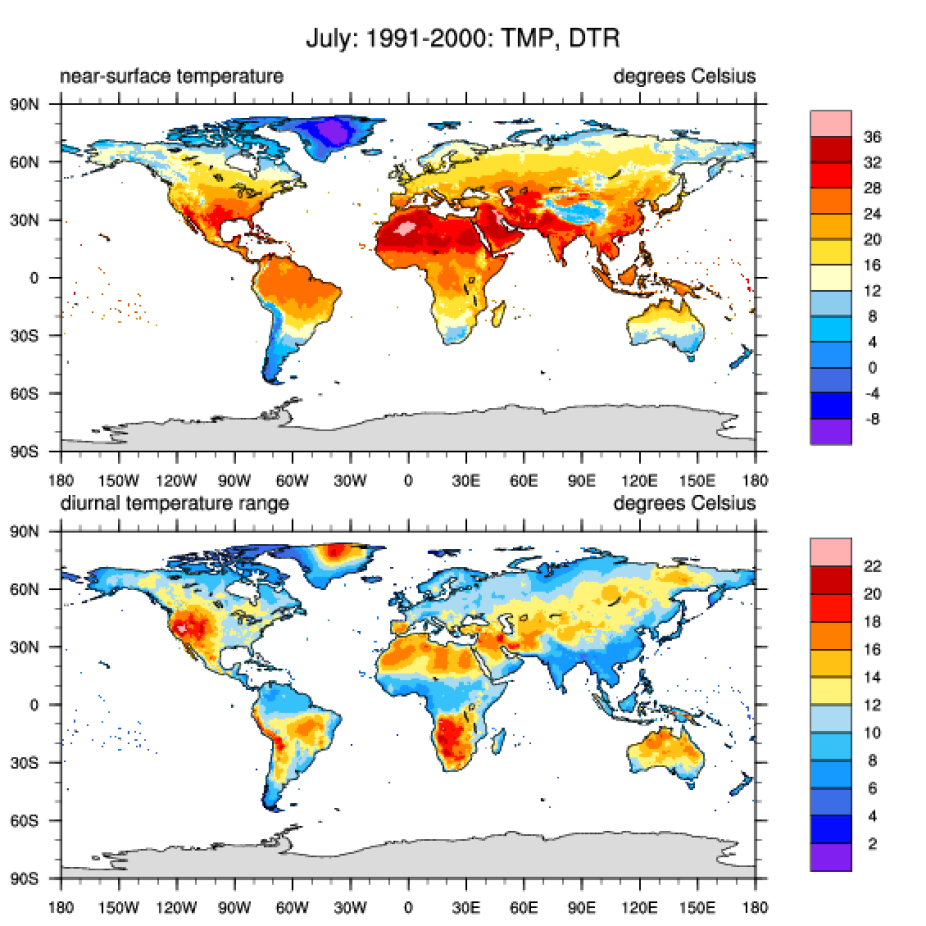
CRU TS3.21: July climatological mean temperature (TMP) and diurnal temperature range (DTR) for 1991-2000. (credit: NCAR Climate Data Guide, D. Shea)
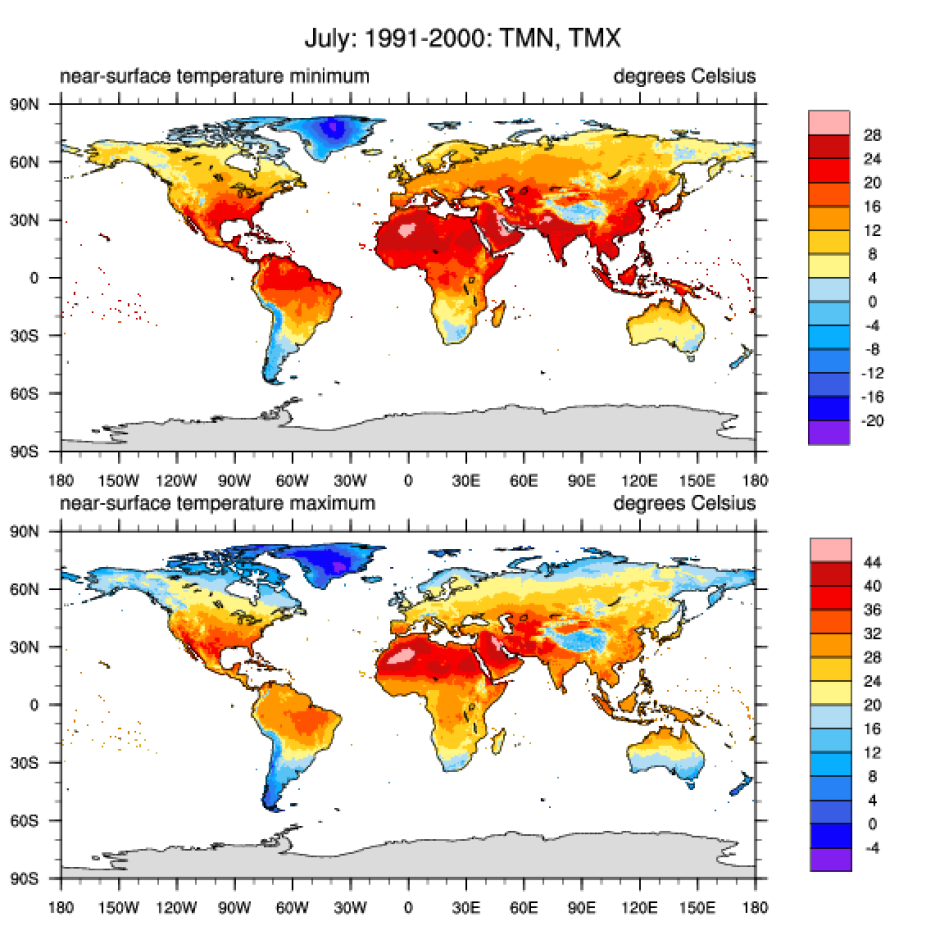
CRU TS3.21: July climatological minimum (TMN) and maximum tempeatures (TMX) for 1991-2000. (credit: NCAR Climate Data Guide, D. Shea)
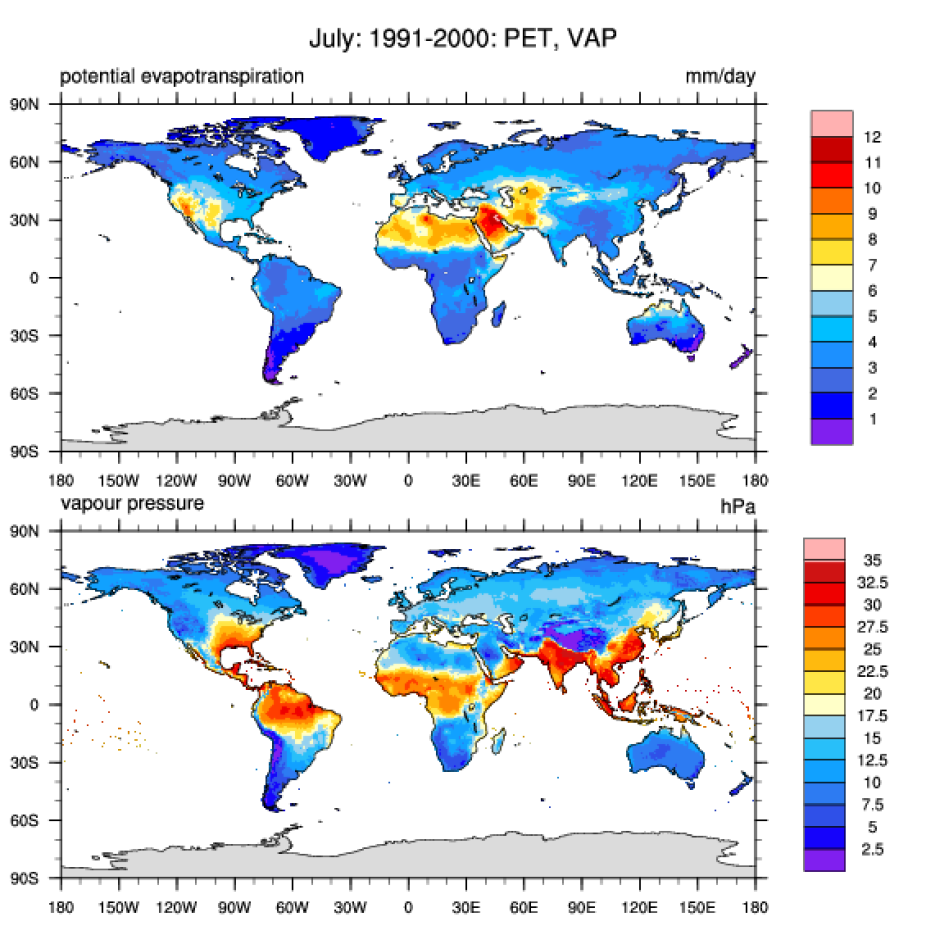
CRU TS3.21: July climatological potential evapotranspiration (PET) and vapor pressure (VAP) for 1991-2000. (credit: NCAR Climate Data Guide, D. Shea)
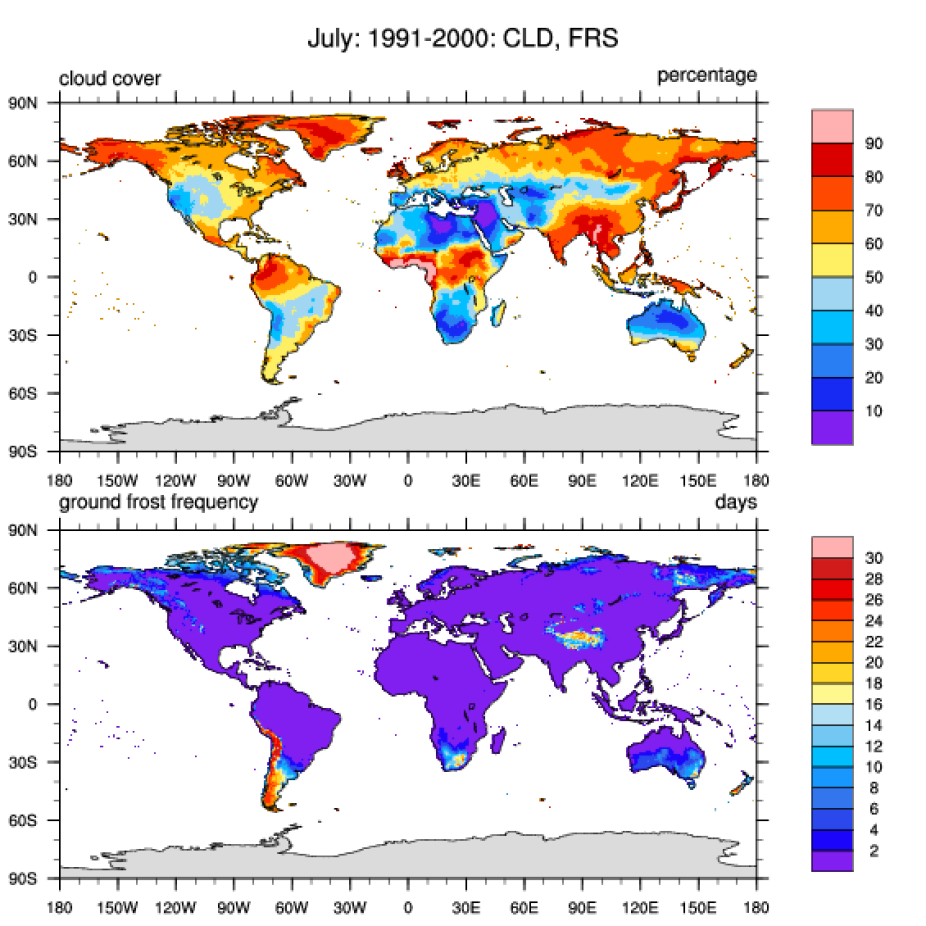
CRU TS3.21: July climatological cloud cover (CLD) and ground frost frequency (FRS) for 1991-2000. (credit: NCAR Climate Data Guide, D. Shea)
Other Information
- Harris, I., Jones, P.D., Osborn, T.J. and Lister, D.H. (2013), Updated high-resolution grids of monthly climatic observations – the CRU TS3.10 Dataset. Int. J. Climatol.. doi: 10.1002/joc.3711
- Trenberth, K. E., A. Dai, G. van der Schrier, P. D. Jones, J. Barichivich, K. R. Briffa, and J. Sheffield^, 2014: Global warming and changes in drought. Nature Climate Change, 4, 17-22