Global surface temperature data: GISTEMP: NASA Goddard Institute for Space Studies (GISS) Surface Temperature Analysis
NASA Goddard's Global Surface Temperature Analysis (GISTEMP) combines land surface air temperatures from GHCN-M version 4 with SSTs of the ERSSTv5 analysis into a comprehensive, global surface temperature data set spanning 1880 to the present at monthly resolution, on a 2x2 degree latitude-longitude grid. As such, it is one of the main data sets used to monitor global and regional temperature variability and trends. Interpolation of the station records is performed to provide broad spatial coverage, however, the methodology is unique from other methods such as HadCRUT5 or Berkeley Earth. The GISTEMP analysis method uses linear inverse distance weighting to infill gridboxes with records from stations up to 1200km away (a version with a 250km limit is also provided). The current version, GISTEMPv4, now includes a 200-member monthly gridded uncertainty ensemble that characterized all known sources of uncertainty from 1880-2020.
Key Strengths
Interpolation provides near global coverage with complete land coverage since 1960
Full uncertainty quantification of monthly, gridded temperature fields through a 200-member ensemble
Removes urban warming with identification of urban areas by remote sensed nighttime radiance
Key Limitations
Provides anomalies only; no climatology or absolute temperatures provided
Same source data as NOAAGlobalTemp
Does not extend prior to 1880
- GISTEMP Team, 2024: GISS Surface Temperature Analysis (GISTEMP), version 4. NASA Goddard Institute for Space Studies. Dataset accessed 20YY-MM-DD at https://data.giss.nasa.gov/gistemp/.
- Lenssen, N., G.A. Schmidt, M. Hendrickson, P. Jacobs, M. Menne, and R. Ruedy, 2024: A GISTEMPv4 observational uncertainty ensemble. J. Geophys. Res. Atmos., 129, no. 17, e2023JD040179, doi:10.1029/2023JD040179.
Expert User Guidance
The following update was contributed by Nathan Lenssen, September 2024:
A GISTEMPv4 uncertainty ensemble has been released, providing uncertainty quantification at monthly resolution and on the GISTEMP 2x2 degree grid (Lenssen et al. 2024). This ensemble provides 200 monthly gridded realizations of historical surface temperature anomalies and can be thought of as 200 equally likely reconstructions of historical temperature. In addition, 200-member ensembles are of key large-scale series such as global and hemispheric means are provided from 1880-2020. There are currently plans to make the ensemble operational and run up to the last full calendar year.
Uncertainty ensembles have been adopted by the global temperature community for two key reasons. First, uncertainty ensembles are easy to incorporate in subsequent analyses. To include uncertainty in historical temperature in an analysis that uses GISTEMP as input data, only one additional step is needed: run the analysis 200 times, once with each member of the GISTEMP uncertainty ensemble. Then, the 200 results of the value of interest can be used to determine median estimates and empirical confidence intervals, properly propogating uncertainty in the input GISTEMP data.
The second reason uncertainty ensembles have been adopted is that the properly characterize the spatial and temporal structure of the uncertainty. Errors and biases in surface temperature measurements and interpolation are not spatially and/or temporally independent. Rather than provide these complicated covariance structures, an ensemble sampling the uncertainty distribution provides a complete and accessible representation of the full uncertainty distribution.
As of writing, the GISTEMPv4 uncertainty ensemble joining the HadCRUT5 and DCENT uncertainty ensembles. Whenever possible, results should be compared between the various products to properly sample the epistemic uncertainty arising from decisons made by researchers in estimating the Earth's historical temperature.
The following was contributed by Nathan Lenssen, April 2020:
The GISS Surface Temperature Analysis (GISTEMP v4) is an estimate of global surface temperature change (Figure 1). The data and resulting graphs and tables are updated on the GISTEMP website around the middle of every month coinciding with updates in the input land station records rom NOAA GHCN-M v4 (Menne et al. 2019), and gridded sea surface temperature anomalies from NOAA ERSSTv5 (Huang et al. 2017), combined as described in the publications Hansen et al. (2010) and Lenssen et al. (2019).
GISTEMP is one of the longest established surface temperature analyses with first estimates made in Hansen et al. (1981) and full documentation of the method in Hansen and Lebedeff (1987). The full history of updates to the GISTEMP methodology and input data as well as the resulting changes in the estimated global mean temperature are provided here. Major changes in GISTEMPv4 from GISTEMPv3 are the updates in source data from GHCNv3 to GHCNv4 and from ERSSTv4 to ERSSTv5.
Regional and global means are calculated by combining station records after adding appropriate offsets to avoid creating artificial discontinuities. Note that GISTEMP does not provide estimates of global and regional climatologies or absolute temperatures as doing so would introduce additional uncertainty into mean anomaly estimates. For more information, see the discussion on The Elusive Absolute Surface Air Temperature (SAT).
In addition to reducing the uncertainty, another advantage of working with surface temperature anomalies is their long spatial correlation scale. The GISTEMP method interpolates station anomalies using a linear inverse distance weighting with a radius of 1,200 km. This radius and linearity of the spatial correlation was determined through a random sample of pairwise sample correlations of station series in Hansen and Lebedeff (1987). This simple spatial correlation agrees with the estimated correlation function from the more sophisticated Gaussian Process-based approach of the Berkeley Earth temperature analysis (Rhode et al. 2013).
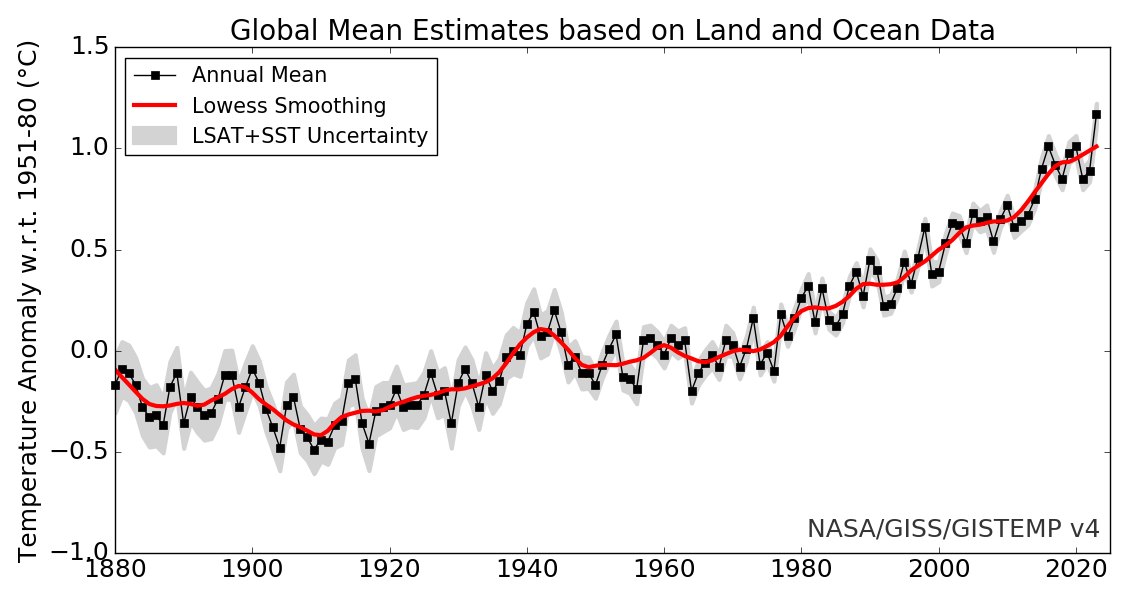
Currently, uncertainty in the annual global mean temperature (Figure 2) is quantified accounting for uncertainties arising from the land and ocean records (Lenssen et al. 2019). The major sources of uncertainty in the LSAT arise from inhomogeneities and gaps in station time series and incomplete spatial coverage of the land and sea ice surface. Uncertainty arising from the homogenization of the station record is provided by the GHCNv4 dataset. The sampling uncertainty arising from limited station coverage is estimated by replicating the GISTEMP method on reanalysis data with simulated historical coverage and comparing with full global coverage. The ERSSTv5 uncertainty ensemble (Huang et al. 2016) is used to quantify uncertainty arising from the SST data and method.
Non-climatic shifts in mean, often referred to as systematic errors, are a major source of uncertainty in station and ship measurement series (Menne et al. 2018, Kennedy et al. 2019). In the land station record, non-climatic shifts in temperature are caused by changes in measurement technique, reporting practices, or station location. Systematic errors in the SST record are primarily due to changes in measurement, reporting, and digitization procedures. The input land station record, GHCNv4 (Menne et al. 2018), and SST product, ERSSTv5 (Huang et al. 2016, Huang et al. 2017), use methods to remove such biases. However, correction of such systematic errors introduces uncertainty that persists in time.
In addition, GISTEMP adjusts the time series of urban stations to better match nearby rural stations and minimize the urban heat effect on regional and global means. Stations are classified as urban or rural by the night-light radiance as measured by satellite. The trends of urban stations are compared with nearby rural stations and corrected if necessary. Urban stations without nearby rural stations are dropped to avoid introducing bias due to urban heating.
Comparison of GISTEMP with climate model output is straightforward as GISTEMP provides monthly anomalies relative to the 1951-1980 base period on a 2x2 degree grid. Model, reanalysis, or observational data in absolute temperature should be regridded to a 2x2 degree grid and converted to anomalies for direct comparison. Note that, as with all major surface temperature analyses, GISTEMP quantifies temperature with sea surface temperature over the ocean and 2 m air temperature over land and sea ice.
There are numerous surface temperature datasets with independent methodologies and varying degrees of shared input data (See “Summary of Global Surface Temperature Data Sets” table). Despite the differences, comparison of estimated global mean temperature between products shows little discrepancy (Figure 3). The 1200km interpolation in GISTEMP, comparable to the Berkeley Earth interpolation, captures recent arctic warming by extending data from nearby stations to provide nearly full coverage of the arctic as shown through comparison with an independent remote sensed product (Susskind et al. 2019). As historical global surface temperature datasets are relatively accessible and easy to work with, best practices suggest using multiple surface temperature datasets in any analysis.##
Cite this page
Acknowledgement of any material taken from or knowledge gained from this page is appreciated:
Lenssen, Nathan & National Center for Atmospheric Research Staff (Eds). Last modified "The Climate Data Guide: Global surface temperature data: GISTEMP: NASA Goddard Institute for Space Studies (GISS) Surface Temperature Analysis.” Retrieved from https://climatedataguide.ucar.edu/climate-data/global-surface-temperature-data-gistemp-nasa-goddard-institute-space-studies-giss on 2025-07-18.
Citation of datasets is separate and should be done according to the data providers' instructions. If known to us, data citation instructions are given in the Data Access section, above.
Acknowledgement of the Climate Data Guide project is also appreciated:
Schneider, D. P., C. Deser, J. Fasullo, and K. E. Trenberth, 2013: Climate Data Guide Spurs Discovery and Understanding. Eos Trans. AGU, 94, 121–122, https://doi.org/10.1002/2013eo130001
Key Figures
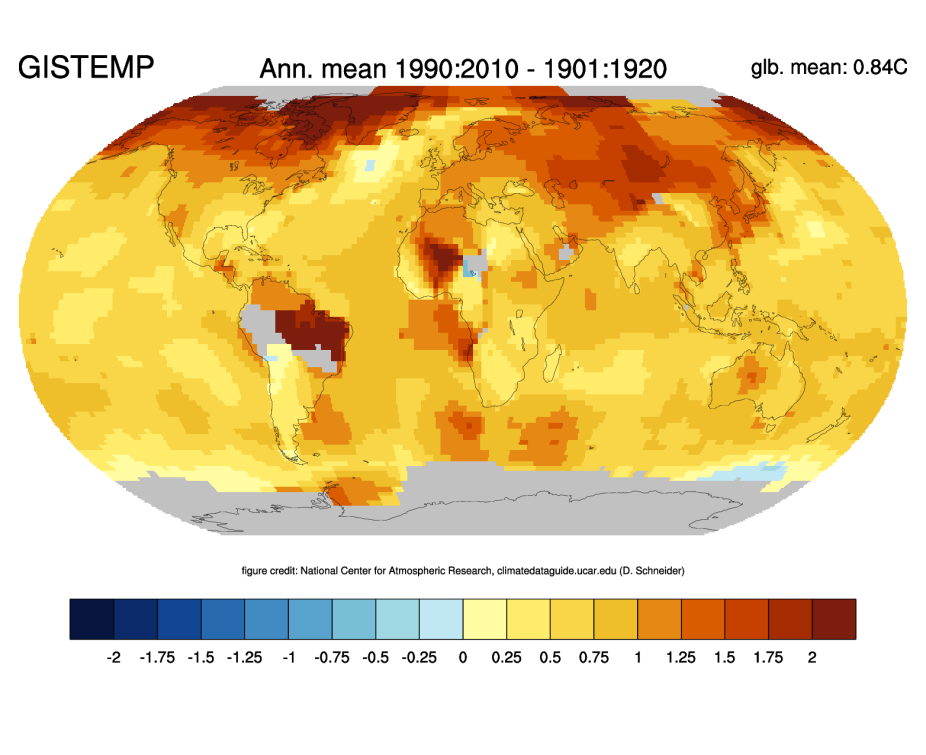
Change of annual mean land temperature between 1901:1920 and 1991:2010 based on the GISTEMP dataset (with ERSSTv3b SSTs). Figure Credit: ClimateDataGuide, NCAR
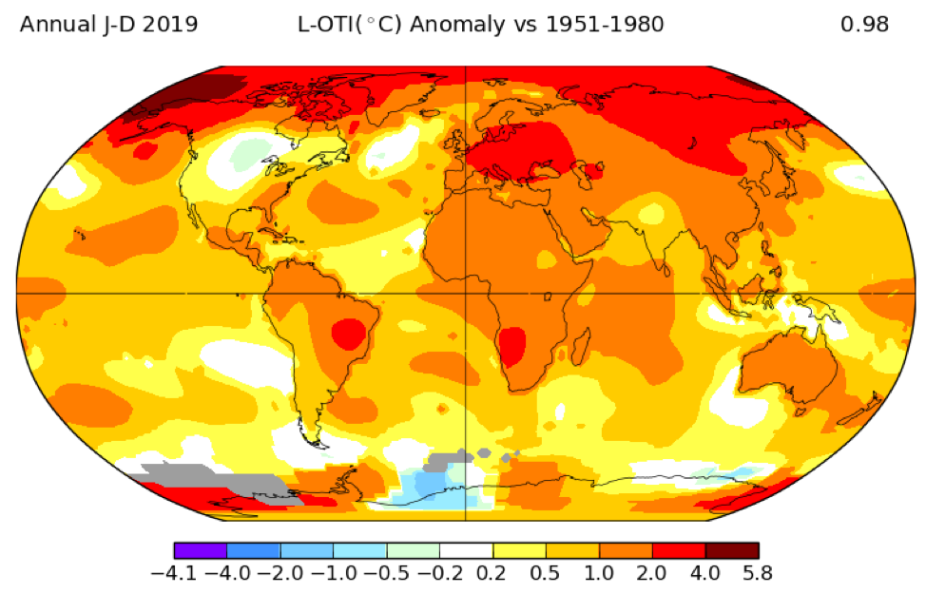
Figure 1: The 2019 annual mean surface temperature anomaly field relative to a 1951-1980 climatology. The 0.98 in the upper-right corner is the estimated total global mean anomaly in degrees C. (Source: GISTEMP webpage)
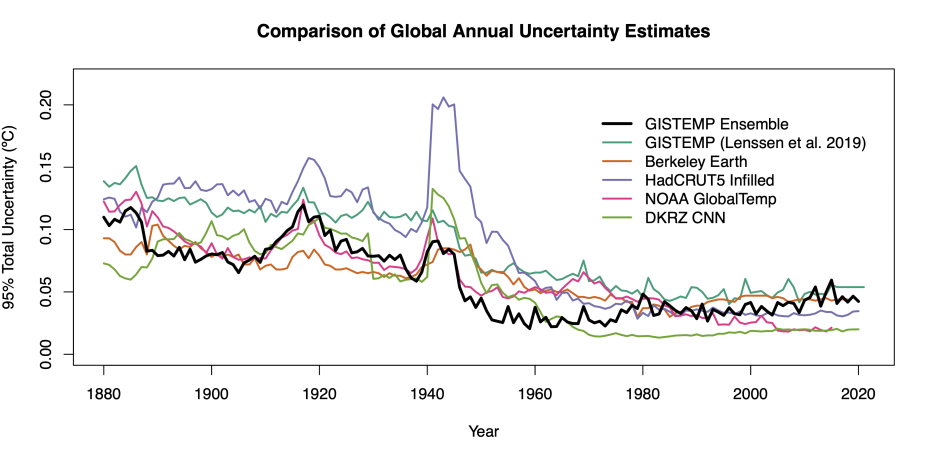
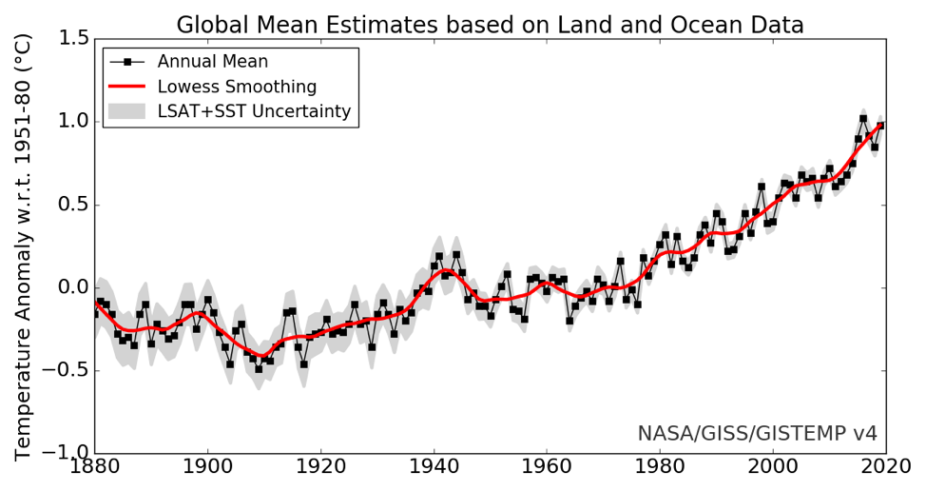
Figure 2: The mean global annual surface temperature from 1880-2019 with 95% confidence interval. The red line is a LOWESS smoothing equivalent to a 5-year moving average. (Source: GISTEMP webpage)
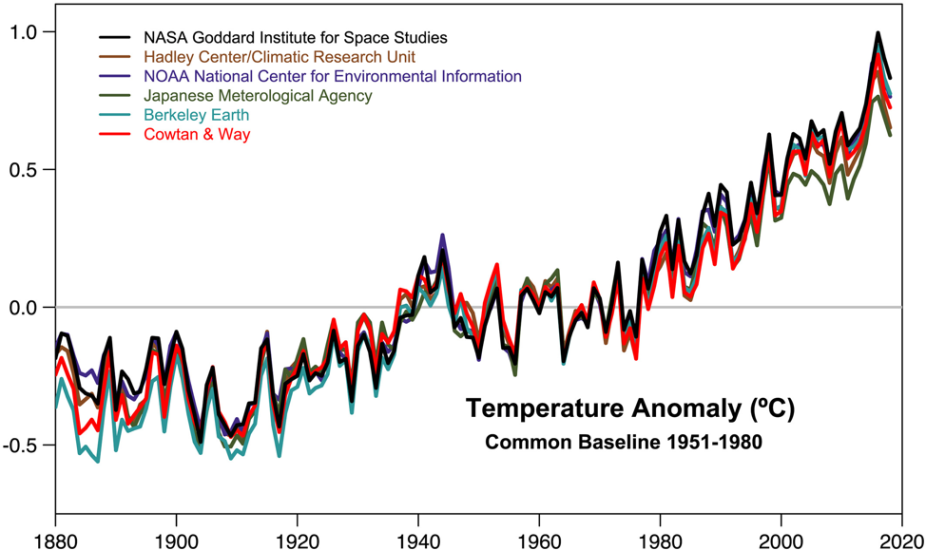
Figure 3: Comparison of the global annual mean temperature anomaly between six of the major surface temperature products using a common climatology period. (Source: Figure 1 of Lenssen et al. 2019)
Other Information
GHCN v4 (~6300 land stations); ERSSTv5 (SSTs); SCAR READER (for Antarctic stations)
2x2 degree