GPCP (Daily): Global Precipitation Climatology Project
NOTE: Due to a hardware failure, GPCP SG V2.2 and 1DD V1.2 have ceased production. The last processed month is October 2015. The follow-on GPCP V2.3 and 1DD V1.3 will soon become available, reprocessed back to January 1979 and October 1996, respectively. These new versions will be produced by at ESSIC in conjunction with NCEI (formerly NCDC).
Key Strengths
Key Limitations
Expert User Guidance
The following was contributed by Angeline Pendergrass (NCAR), July, 2014:
"GPCP daily data
The GPCP 1 Degree Daily precipitation dataset provides daily rainfall accumulation globally on a one-degree grid in latitude and longitude starting in October 1996 and continuing through the present (with some delay for processing). It relies on the GPCP monthly product for the total monthly rainfall, and uses primarily geostationary infrared satellite imagery to determine daily rainfall rates.
GPCP uses the Threshold Matched Precipitation Index (TMPI) to obtain daily precipitation estimates, with the conditional rain rate based on the local monthly precipitation data between 40 N and S. It uses adjusted sounding-based rain rates (from TOVS and AIRS infrared satellite retrievals) elsewhere.
The key strengths of GPCP 1DD are that it is a global, relatively high resolution in both time and space gridded record of precipitation. The key limitation of this dataset (like all merged-satellite precipitation products) is the indirect and complex nature of translating sparse satellite precipitation measurements into high-resolution gridded precipitation estimates. The geostationary infrared data which is a very important input component senses the properties of clouds, rather than directly measuring precipitation itself. Satellites can only indirectly measure quantities related to rain rate at the surface: microwave and infrared satellites measure brightness temperature, which is then converted to rain rate indirectly, while radars measure energy reflected by cloud and rain drops throughout the depth of the column. Then, these indirect measurements (along with direct gauge measurements over land) are used as an input to a complex algorithm that produces estimates of surface rain rate on a regular grid in time and space. Finally, the satellite data used in GPCP misses many light rain events (Behrangi et al 2012, 2014).
Research applications of this dataset include examining the climatological distribution of rainfall, and its frequency and intensity (e.g., Allan et al. 2013, Pendergrass and Hartmann 2014), changes in extreme precipitation (e.g., O’Gorman and Schneider 2009, Rossow et al 2013, Sugiyama et al 2010), and properties of precipitating systems (e.g., Roca et al 2014).
Errors in calculation and interpretation abound when precipitation datasets of different spatial resolutions are compared. Rain rates, and especially the distribution of rain rates at a particular location, depend strongly on spatial resolution of the dataset. See Chen and Knutson (2008) for a thorough analysis of the effect of resolution on precipitation extremes, and Liu and Allan (2012) for a comparison of this dataset with other multi-satellite precipitation estimates, highlighting the role of differing resolution. So, for example, a measure of extreme rain like its 99th percentile is expected to be very different in a time series observed from a surface rain gauge and in a co-located pixel of a gridded precipitation dataset such as GPCP 1dd, even if the data have the same temporal resolution. The spatial gridding results in a smoother dataset.
In order to compare two precipitation datasets on grids with different resolutions, one should typically regrid one or both of the datasets to a common grid using a regridding method that conserves the total amount of rain falling in an area. Often, the default interpolation in an analysis software package is bilinear interpolation (e.g., Matlab), which is not conservative. One conservative regridding method is described in Jones (1999). The NCL language offers two methods to perform conservative regridding: area_conserve_remap or, the more robust, Earth System Modeling Framework (ESMF) regridding. See also the Climate Data Guide's regridding page (https://climatedataguide.ucar.edu/climate-data-tools-and-analysis/regridding-overview).
A list of combined satellite-gauge precipitation datasets was compiled by the International Precipitation Working Group, and can be found here: http://www.isac.cnr.it/~ipwg/data/datasets1.html TRMM 3B42 is another dataset which combines satellite and rain gauge measurements, which higher resolution in time and space, but without global coverage.
No uncertainty estimate is provided with GPCP 1dd data. However, the errors in monthly mean values from the GPCP monthly product are also relevant for this dataset. Huffman et al (2001) contains some early validation of the data from the Oklahoma mesonet, and states that random errors could be calculated for this product as they are for GPCP monthly data. Bolvin et al (2009) contains further validation with high-latitude gauges.
The uniform spatial grid of this dataset lends itself to comparison with climate models (though, see comments about regridding above). In order to make the comparison appropriate, the model precipitation data should be accumulated rather than instantaneous precipitation rates. One could compare climatologies over the same time period, or compare variations in time by examining model integrations forced with prescribed SSTs (AMIP experiments) and historical forcing (see, eg, Pendergrass 2013 for composites over warm and cold ENSO phases in CMIP5 AMIP experiments).
Spurious temporal features in the GPCP monthly dataset will also be found in this dataset. Further anomalies are listed in the documentation, Huffman and Bolvin (2012): Before 2001 the treatment of the gaps in TOVS data were treated differently than after, and in April/May 2005 there is a change from TOVS to AIRS infrared estimates as TOVS left service."##
Cite this page
Acknowledgement of any material taken from or knowledge gained from this page is appreciated:
Pendergrass, Angeline & National Center for Atmospheric Research Staff (Eds). Last modified "The Climate Data Guide: GPCP (Daily): Global Precipitation Climatology Project.” Retrieved from https://climatedataguide.ucar.edu/climate-data/gpcp-daily-global-precipitation-climatology-project on 2026-07-22.
Citation of datasets is separate and should be done according to the data providers' instructions. If known to us, data citation instructions are given in the Data Access section, above.
Acknowledgement of the Climate Data Guide project is also appreciated:
Schneider, D. P., C. Deser, J. Fasullo, and K. E. Trenberth, 2013: Climate Data Guide Spurs Discovery and Understanding. Eos Trans. AGU, 94, 121–122, https://doi.org/10.1002/2013eo130001
Key Figures

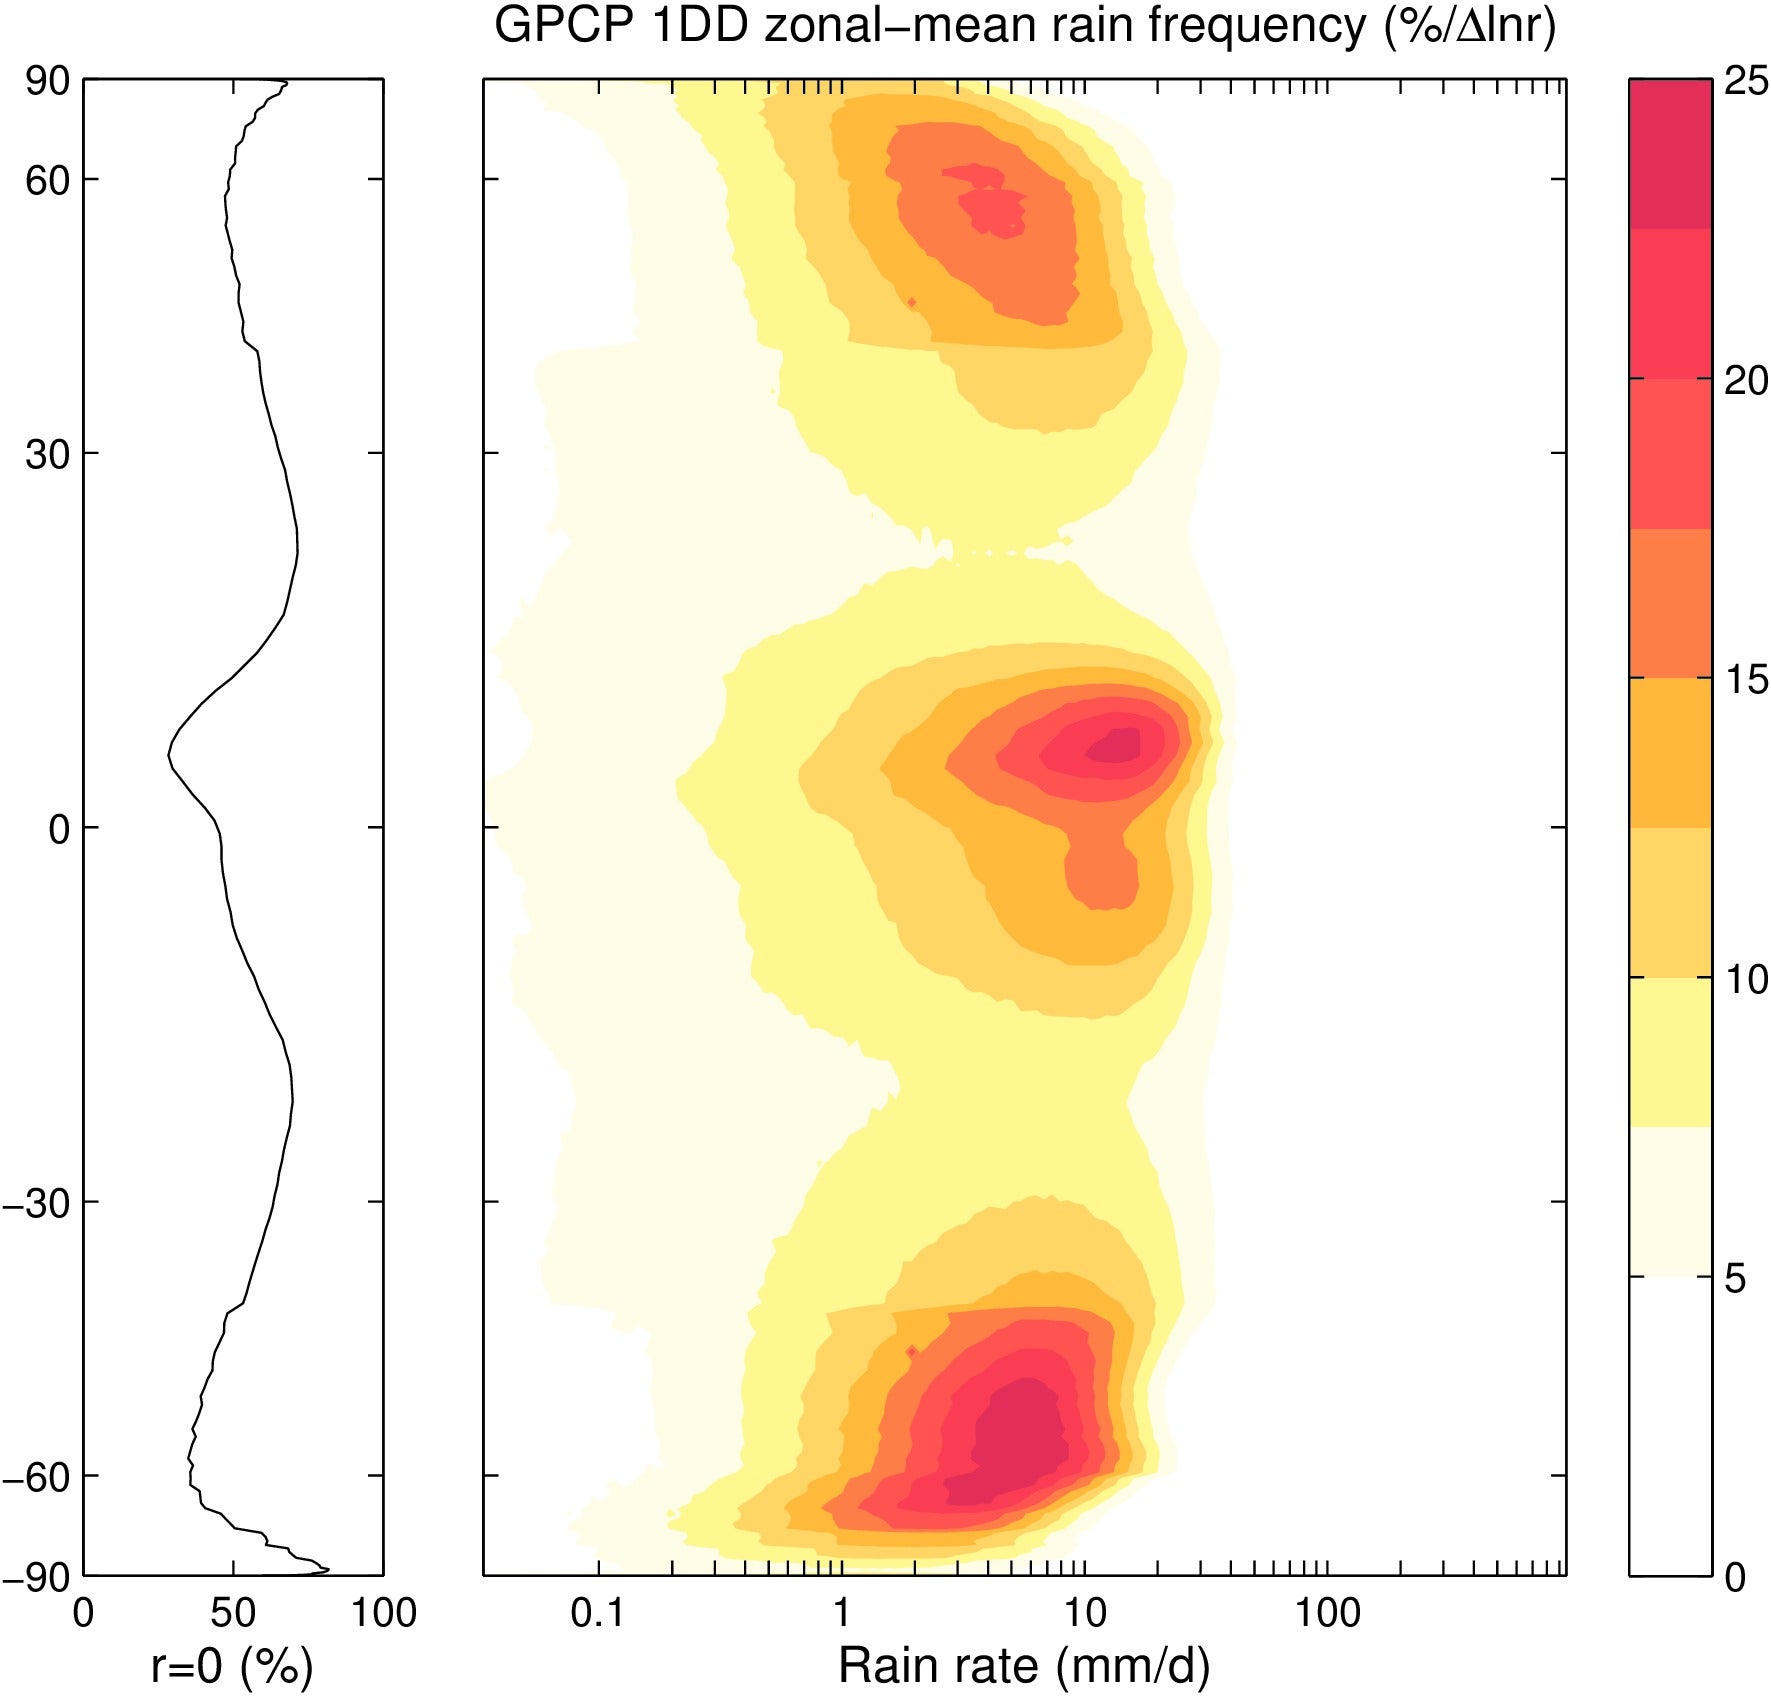
Rain frequency distribution at each latitude in GPCP 1DD data, 1997-2013. Left: dry day frequency (%). Right: Rain frequency with logarithmically-spaced rain rate bins. Units are percent per increment of rain rate, so evenly spaced increments of rain rate can be compared. Abrupt transitions between 40 and 50 N are features in the product which occur due to the transition in data sources across this latitude band. (contributed by A. Pendergrass)
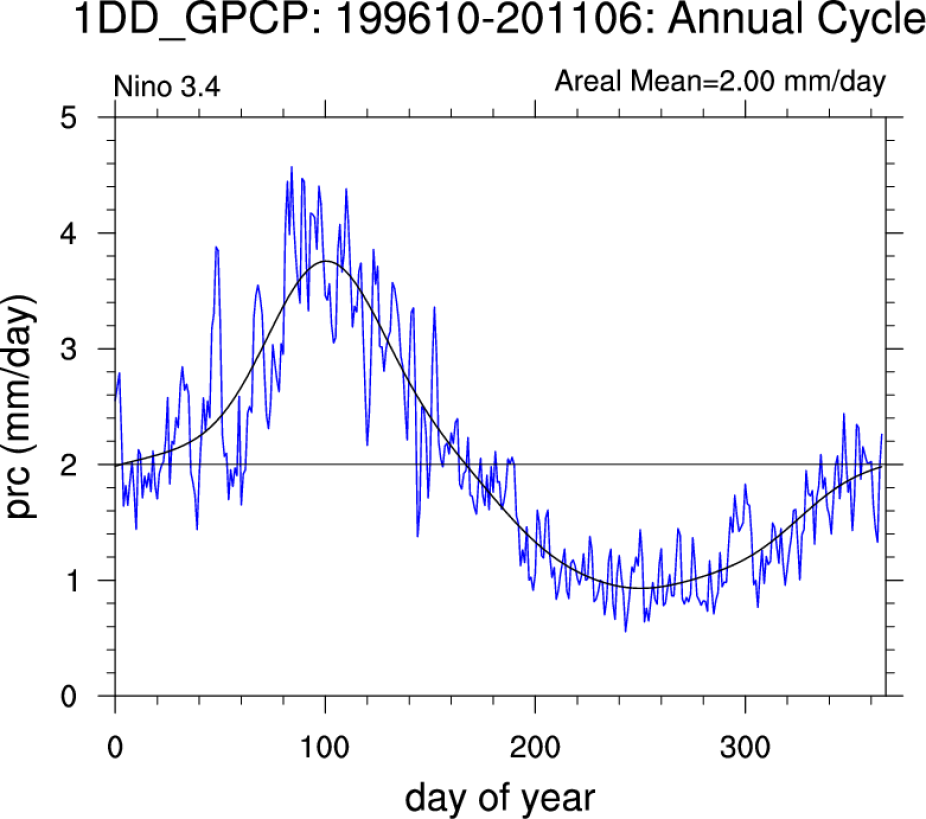
aw and smooth daily mean precipitation for the Nino 3.4 region (10/1996 - 6/2011). (Climate Data Guide; D. Shea)
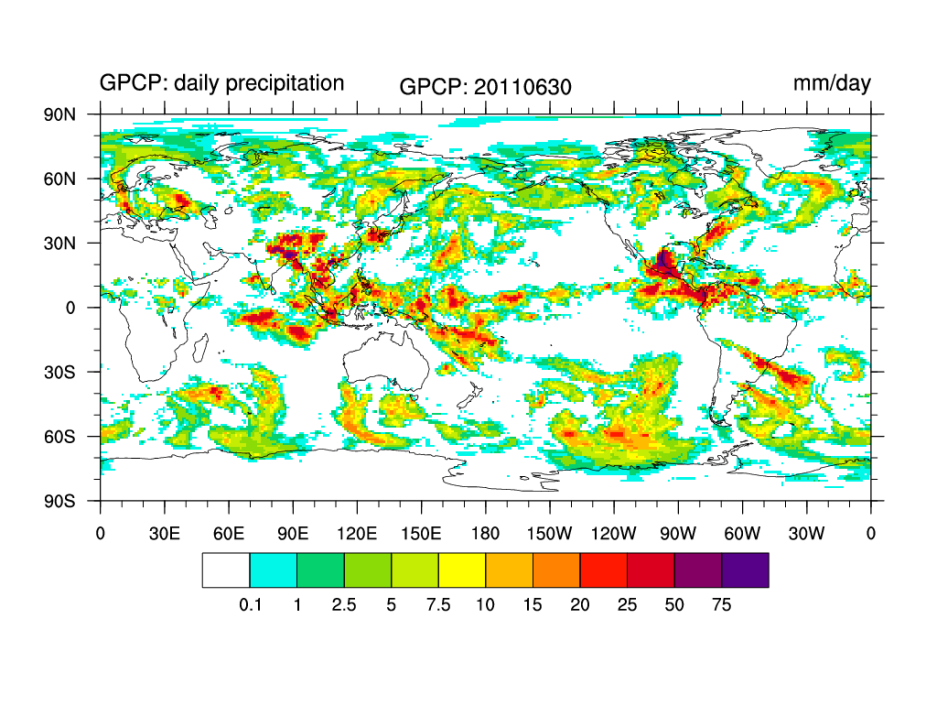
Daily average precipitation for June 30, 2011 at 1x1. (Climate Data Guide; D. Shea)