PERSIANN-CDR: Precipitation Estimation from Remotely Sensed Information using Artificial Neural Networks - Climate Data Record
The Precipitation Estimation from Remotely Sensed Information using Artificial Neural Networks- Climate Data Record (PERSIANN-CDR) provides daily rainfall estimates at a spatial resolution of 0.25 degrees in the latitude band 60S - 60N from 1983 to the near-present. The precipitation estimate is produced using the PERSIANN algorithm on GridSat-B1 infrared satellite data, and the training of the artificial neural network is done using the National Centers for Environmental Prediction (NCEP) stage IV hourly precipitation data. The PERSIANN-CDR is adjusted using the Global Precipitation Climatology Project (GPCP) monthly product version 2.2 (GPCPv2.2), so that the PERSIANN-CDR monthly means degraded to 2.5 degree resolution match GPCPv2.2. PERSIANN CDR is a Climate Data Record, which the National Research Council (NRC) defines as a time series of measurements of sufficient length, consistency, and continuity to determine climate variability and change.
Key Strengths
Consistent, long-term data set with more than 30 years of data, updated quarterly
Uses many different data sources which makes the product more reliable
High resolution (0.25) monthly precipitation consistent with GPCP monthly estimates.
Key Limitations
CDR version has daily temporal resolution, does not resolve the diurnal cycle, may not record some short-lived, intense events
Relies heavily on infrared data - conversion from IR to precipitation rate requires complex algorithm, not quite global (60◦S - 60◦N)
Is not independent of other precipitation estimates such as GPCP-1DD
Scientific paper: Ashouri, H., and Coauthors, 2015: PERSIANN-CDR: Daily precipitation climate data record from multisatellite observations for hydrological and climate studies. Bull. Amer. Meteor. Soc., 96, 69–83, doi:10.1175/BAMS-D-13-00068.1.
Dataset: Soroosh Sorooshian, Kuolin Hsu, Dan Braithwaite, Hamed Ashouri, and NOAA CDR Program (2014): NOAA Climate Data Record (CDR) of Precipitation Estimation from Remotely Sensed Information using Artificial Neural Networks (PERSIANN-CDR), Version 1 Revision 1. [indicate subset used]. NOAA National Centers for Environmental Information. DOI:10.7289/V51V5BWQ [access date].
Expert User Guidance
The following was contributed by Dr. Maria Gehne, October, 2015:
The Precipitation Estimation from Remotely Sensed Information using Artificial Neural Networks- Climate Data Record (PERSIANN-CDR) provides daily rainfall estimates at a spatial resolution of 0.25 degrees in the latitude band 60S - 60N from 1983 to the delayed present. The artificial neural network (ANN) model is trained to associate variations in the GridSat-B1 brightness temperature of cold-cloud pixels and their surroundings with the surface rain rate from the National Centers for Environmental Prediction (NCEP) stage IV hourly precipitation data. For the retrospective estimation of rainfall rates the nonlinear regression parameters of the ANN model remain fixed after training. Bias adjustment of the PERSIANN-CDR precipitation estimates are applied by matching the Global Precipitation Climatology Project (GPCP) monthly product version 2.2 (GPCPv2.2) at 2.5◦ resolution. The high-resolution values of PERSIANN-CDR are corrected in each 2.5 degree grid box for each month and each year, so that the PERSIANN-CDR values averaged spatially over 2.5 degree and temporally to monthly scales match the GPCPv2.2 monthly values. Details of the algorithm can be found in Ashouri et al. (2015). While the direct input data for PERSIANN-CDR are GridSat-B1 infrared data (and training of the ANN model is done on the NCEP stage IV hourly precipitation data), the adjustment to GPCPv2.2 monthly means indirectly includes rain gauge measurements as well.
With more than 30 years in the data record the long-term, consistent, data set is intended for climatological studies of the hydrological component of the climate system. This data set is of high enough spatial resolution for studies of high-impact precipitation events (e.g. hurricane Katrina (Ashouri et al. 2015)), and estimating precipitation distributions over regional and continental areas. The data set also provides users with long time series of precipitation rates at up to daily temporal resolution.
PERSIANN CDR is heavily based on infrared satellite retrievals from multiple satellites. Spurious trends in these data are likely to translate to the precipitation rates estimated by the PERSIANN algorithm. The adjustment to GPCPv2.2 monthly means (which include rain gauge measurements) likely alleviates this problem to some extent, but spurious trends in GPCPv2.2 will also be found in this data set. At the point of writing the PERSIANN CDR has been available to users for only a relatively short period of time. More studies concerned with evaluation and verification of this data set are necessary to further identify potential issues and possible limitations.
Comparable data sets include the GPCP-1DD and TRMM 3B42 products. GPCP-1DD is of comparable quality, though it has slightly coarser spatial resolution (1 degree) and only starts in 1996. For large scale averages GPCP-1DD and PERSIANN CDR show very similar variability (Fig. 6). With the main differences between GPCP-1DD and PERSIANN CDR in the long term monthly means are over the tropical oceans (Figs. 7). Even though the monthly means are adjusted to the monthly GPCPv2.2 product, the daily distributions of the GPCP-1DD product and PERSIANN CDR have very different behavior as can be seen below in Figs. 8 and 9, while daily correlations over continental regions are higher than 0.9. Correlations between the time series of PERSIANN CDR and GPCP-1DD averaged over continental areas are above 0.9 for daily, monthly, and annual averages (Fig. 10).
TRMM 3B42 is of higher temporal resolution (3 hourly), and available from 1998-2014. It will not be extended past the current end date. TRMM 3B42 is a high-resolution precipitation product and thus does not have the same homogeneity goals as the GPCP-1DD or PERSIANN CDR. PERSIANN CDR is better suited than TRMM 3B42 for investigating long-term trends. For a more detailed comparison of PERSIANN- CDR, TRMM 3B42, GPCP-1DD and other precipitation estimates see Gehne et al. (2016).
##
Expert Developer Guidance
The following was contributed by Dr. Hamed Ashouri, October, 2016:
The Precipitation Estimation from Remotely Sensed Information using Artificial Neural Network – Climate Data Record (PERSIANN-CDR) provides long-term (01/01/1983 to delayed present) near-global (60°S-N latitude and 0°-360° longitude bands) precipitation data at daily and 0.25° temporal and spatial resolutions. The PERSIANN-CDR algorithm uses the existing PERSIANN algorithm as its backbone model. PERSIANN algorithm provides global precipitation estimates using combined Infrared (IR) and Passive Microwave (PMW) information from multiple Geostationary Earth orbiting (GEO) and Low Earth Orbit (LEO) satellites. The availability of PMW observations is mostly limited to post 1997 era. In PERSIANN-CDR, in order to eliminate the need for PMW observations, the nonlinear regression parameters of the Neural Network (NN) model are trained, using the National Centers for Environmental Prediction (NCEP) Stage IV radar data, and remained fixed for the retrospective estimation of rainfall rates. The model uses the archive of the Gridded Satellite brightness temperature observations (GridSat-B1) of the International Satellite Cloud Climatology Project (ISCCP) to extract cold-cloud pixels and neighbouring features to estimate surface rainfall rate at 0.25° x 0.25° pixels. The resulted rainfall estimates are later bias corrected using the Global Precipitation Climatology Project (GPCP) 2.5° monthly product which contains the Global Precipitation Climatology Centre (GPCC) gauge information. The PERSIANN-CDR precipitation estimates maintain a monthly total consistent with the GPCP 2.5° monthly product.
PERSIANN-CDR provides time series of precipitation of sufficient length, consistency, and continuity. These characteristics are consistent with the CDR definition described in the National Research Council report (NRC 2004). PERSIANN-CDR is aimed to provide hydroclimate information to the scientific and policy making communities such as energy, water resources, agriculture, human health, coastal, etc. to investigate and understand the underlying long-term trends and variations in global and regional precipitation, particularly in extreme precipitation events, due to long-term trends and natural variability.
Evaluation
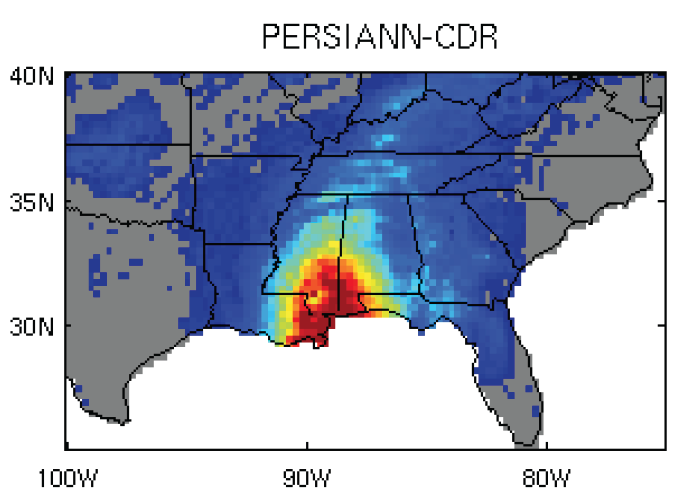
PERSIANN-CDR is evaluated against Stage IV gauge-corrected radar data during Hurricane Katrina, one of the deadliest and costliest extreme events to hit the United States in August 2005 (Figure1). As shown, PERSIANN-CDR shows similar precipitation patterns to the radar data. Moreover, in regions where radars are blocked by mountains or a radar site is down (e.g., the Lake Charles radar site in Southwest Louisiana during Katrina), PERSIANN-CDR captures a wide view of the precipitation and hurricane landfall. Statistical measures show relatively high correlation (0.84) and low bias (~9%) for PERSIANN-CDR during the event.
Miao et al. (2015) used different precipitation extreme indices to evaluate the performance of PERSIANN-CDR in capturing the behavior of extreme precipitation events over China. Gauge-based analysis of daily precipitation over East Asia (EA) is used as the observational dataset. Figure 2 shows the comparisons on the Absolute threshold indices including Annual precipitation from wet days (SDII), Annual count of days when daily precipitation is >= 20mm (R20mm), Annual count of days when daily precipitation is >= 10mm (R10mm), Annual total precipitation when daily precipitation is >= 20mm (R20mmTOT), and Annual total precipitation when daily precipitation is >= 10mm (R10mmTOT). As shown, PERSIANN-CDR exhibits good agreement with the EA gridded gauge data in depicting the spatial distributions of the absolute threshold indices. High correlations are observed in the southern and eastern regions of the country where rain gauge networks are much denser and where most of the heavy rainfall event occurs.
Figure 3 shows the wet-day counts of 0.25o daily precipitation total equal or higher than 10 mm/day over Contiguous United States (CONUS) for the time period from 1983 to 2011. The result form PERSIANN-CDR is compared with the NOAA Climate Prediction Center (CPC) U.S. Unified gridded gauge data. The result shows that large-scale patterns found in PERSIANN-CDR reasonably mirror the observed patterns found in CPC. In addition, the scatter plot and the quantitative measures derived based on the wet-day counts from the two products show that PERSIANN-CDR depicts a high correlation coefficient (0.93) and a relatively very low bias (~ -5%) when compared to the CPC gridded data. PERSIANN-CDR underestimates the wet-day counts over the Sierra Nevada. Once reason could be that rapid rate of changes in precipitation within a relatively short distance in mountainous areas cannot be fully captured in 0.25 x 0.25 degree pixels. Also, the uncertainty in the interpolated CPC data should be considered for some of the discrepancies observed.
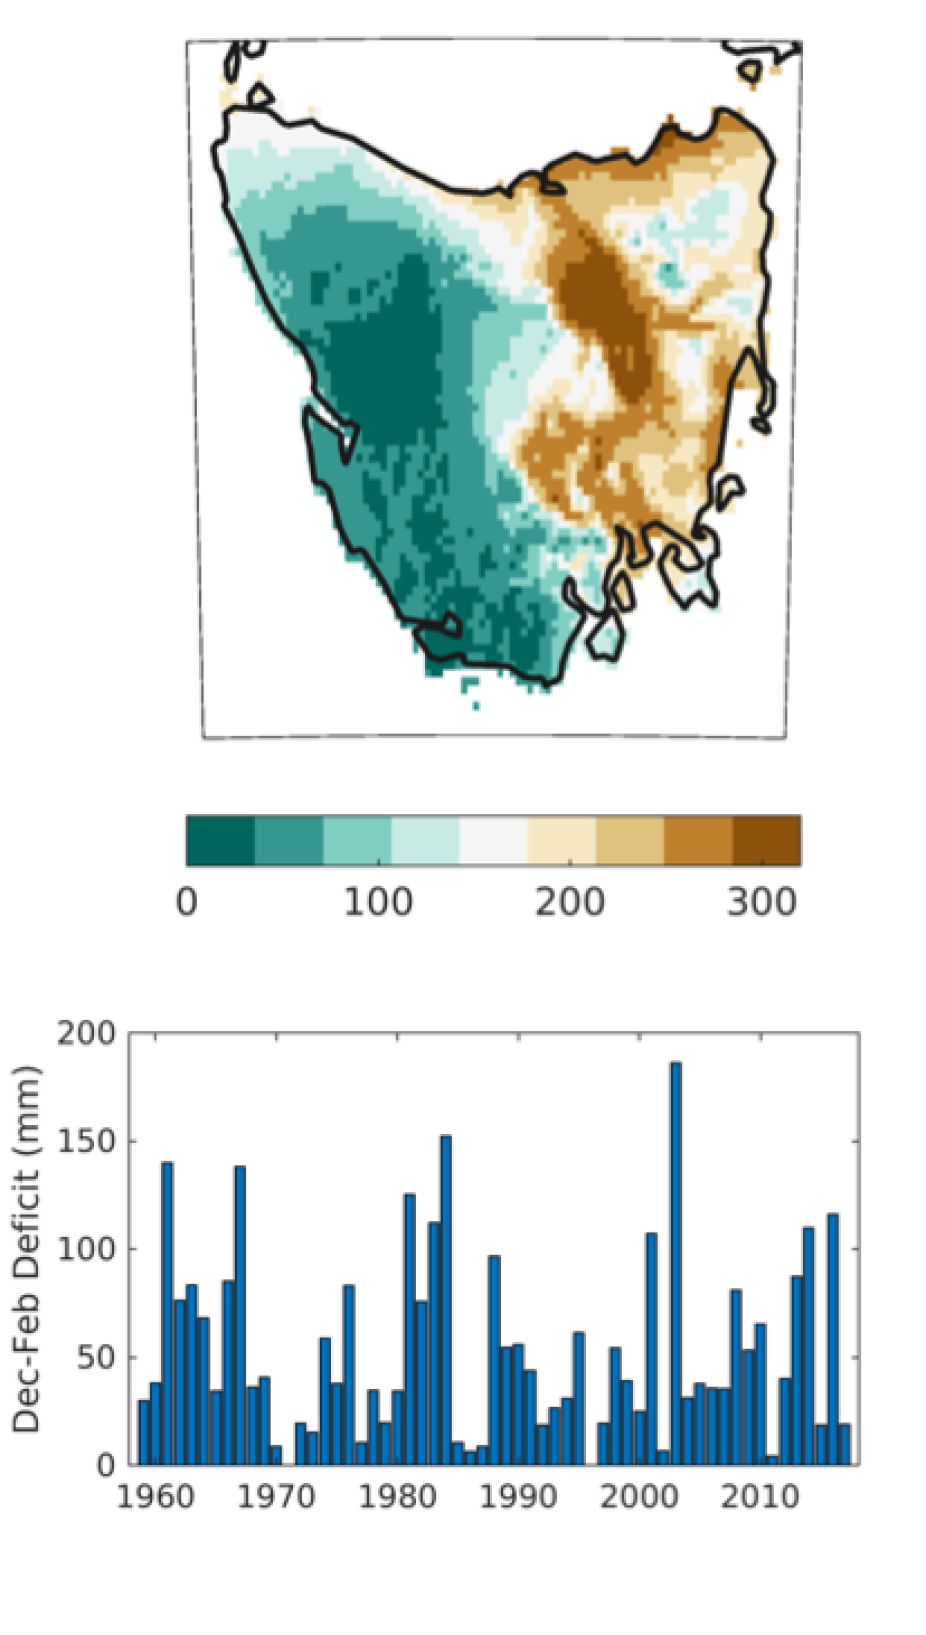
Guo et al. 2016 evaluated the performance of PERSIANN-CDR in assessing meteorological droughts in China from 1983 to 2014. The results show that in dense gauge regions, PERSIANN-CDR depicts similar drought behaviour as ground-based observations in terms of capturing the spatial and temporal patterns.
Application
PERSIANN-CDR has been used in different studies and applications (e.g., Guo et al. 2015; Solmon et al. 2015; Ceccherini et al. 2015; Yong 2015; Yang et al. 2016; Katiraie-Boroujerdy et al. 2016). Hagos et al. (2016) used PERSIANN-CDR as the ‘‘observation’’ precipitation to investigate the changes in the frequency of landfalling atmospheric river and extreme precipitation in the simulation of the Community Earth System Model (CESM). Luchetti et al. (2016) used PERSIANN-CDR in a NOAA–NASA collaborative project for updating the ENSO-based rainfall climatology for regions in Hawaii and U.S.-affiliated Pacific islands, concluding that results of the study ‘‘solidified the ability of the high resolution PERSIANN-CDR to be more than adequate for use in long-term precipitation climatology studies.’’
With respect to hydrological application, Casse and Gosset (2015) used PERSIANN-CDR to study hydrological changes and flood increases in the Niger River and the city of Niamey (Niger) over the period of 1983–2013. The results showed that PERSIANN-CDR produces annual rainfall amounts comparable with those from gauge-adjusted satellite rainfall estimates and gauge data. The paper also concludes that ‘‘the PERSIANN-CDR based hydrological simulation presents a realistic inter-annual variability, and detects flooded years, but not the exact flooded period day by day”.
Ashouri et al. (2016) demonstrated the performance of PERSIANN-CDR in simulating streamflow over Distributed Hydrologic Model Intercomparison Project - Phase 2 (DMIP2) test basins. Precipitation evaluation (Figure 4) shows that TMPA and PERSIANN-CDR have close performances with slightly higher correlation coefficient for TMPA (~0.8 vs. 0.75 for PERSIANN-CDR), similar Root Mean Square Deviation (~6 mm/day) for both products and higher standard deviation for TMPA (~10 mm/day) than PERSIANN-CDR (~8 mm/day).
The National Weather Service (NWS) Office of Hydrologic Development (OHD) Hydrology Laboratory-Research Distributed Hydrologic Model (HL-RDHM) was forced with PERSIANN, PERSIANN-CDR, TMPA, and Stage IV data to simulate streamflow for 2003-2011. The United States Geological Survey (USGS) Streamflow observations are used as the reference streamflow data. Simulation comparison with Stage IV radar data for one of the basins (SAVOY) is presented in Figure 5. The simulated hydrographs from PERSIANN-CDR and TMPA forcing show close agreement. Statistical measures show that Stage IV in general outperforms other products with higher correlation coefficient (~0.75-0.8 m3/s), and lower RMSE and standard deviation in all three basins. TMPA and PERSIANN-CDR both perform well, with a higher correlation coefficient for TMPA at SAVOY and SLOA4 and a higher correlation coefficient for PERSIANN-CDR at ELM spring basin. The findings suggest strong potentials for using PERSIANN-CDR for long-term streamflow simulations especially at remote regions where gauge observations are scarce.
Accessing PERSIANN-CDR Data
PERSIANN-CDR is an open-access data product and available to the public free of charge. It is currently an operational climate data record at the National Oceanic and Atmospheric Administration (NOAA) National Centers for Environmental Information (NCEI) Climate Data Record Program (CDRP) web servers (https://www.ncdc.noaa.gov/cdr/atmospheric/precipitation-persiann-cdr).
PERSIANN-CDR version v01r01 data are freely available in Network Common Data Form (NetCDF) format with self-describing information inside the data files. The data can be downloaded via the following ftp server. ftp://data.ncdc.noaa.gov/cdr/persiann/files/. In the filenames (PERSIANN-CDR_v01r01_YYYYMMDD_cYYYYMMDD.nc), the first “YYYYMMDD” refers to the date of the precipitation data and the second one that starts with letter “c” refers to the creation date of the file.
A new user-friendly system named CHRS DataPortal, which allows users to visualize, subset, compare and download PERSIANN-CDR, as well as other satellite precipitation products developed by CHRS, has been made available at http://chrsdata.eng.uci.edu.
CHRS RainSphere – an integrated system for global satellite precipitation data and information using PERSIANN-CDR
A new user-friendly climate data exploration tool called CHRS (Center for Hydrometeorology and Remote Sensing) RainSphere (http://rainsphere.eng.uci.edu) has been developed at UC Irvine for use in a range of scientific studies and applications as well as to aid in the education of the general public and promote independent inquisition and discovery of climate studies (Nguyen et al. 2016). Over 33 years of retrospective global precipitation estimates made possible via PERSIANN-CDR are available for visualization on the CHRS RainSphere interface. Users are able to easily customize their investigations of historical precipitation estimates through automatically generated analysis products including time series, spatial plots, and basic trend analysis. Easy-to-use browsing capabilities allows the global data to swiftly be subset into a regions of interest by country, political division (e.g. province/state), continental basin, major basin, tributary basin, watershed or a highly localized, searchable location. The tool automatically generates summarizing reports with information about the selected area and also allows users to download any data and/or statistics extracted after browsing. CHRS RainSphere allows the data to speak for itself in a way that is easily understandable by the public in order to increase the number of informed participants in the conversation of climate and climate variability. A YouTube video tutorial on CHRS RainSphere is available at https://www.youtube.com/watch?v=eI2-f88iGlY&feature=youtu.be
##
Cite this page
Acknowledgement of any material taken from or knowledge gained from this page is appreciated:
Ashouri, Hamed &, Gehne, Maria & National Center for Atmospheric Research Staff (Eds). Last modified "The Climate Data Guide: PERSIANN-CDR: Precipitation Estimation from Remotely Sensed Information using Artificial Neural Networks - Climate Data Record.” Retrieved from https://climatedataguide.ucar.edu/climate-data/persiann-cdr-precipitation-estimation-remotely-sensed-information-using-artificial on 2026-02-25.
Citation of datasets is separate and should be done according to the data providers' instructions. If known to us, data citation instructions are given in the Data Access section, above.
Acknowledgement of the Climate Data Guide project is also appreciated:
Schneider, D. P., C. Deser, J. Fasullo, and K. E. Trenberth, 2013: Climate Data Guide Spurs Discovery and Understanding. Eos Trans. AGU, 94, 121–122, https://doi.org/10.1002/2013eo130001
Key Figures
MERRA-2 infographic. (contributed by R Cullather)
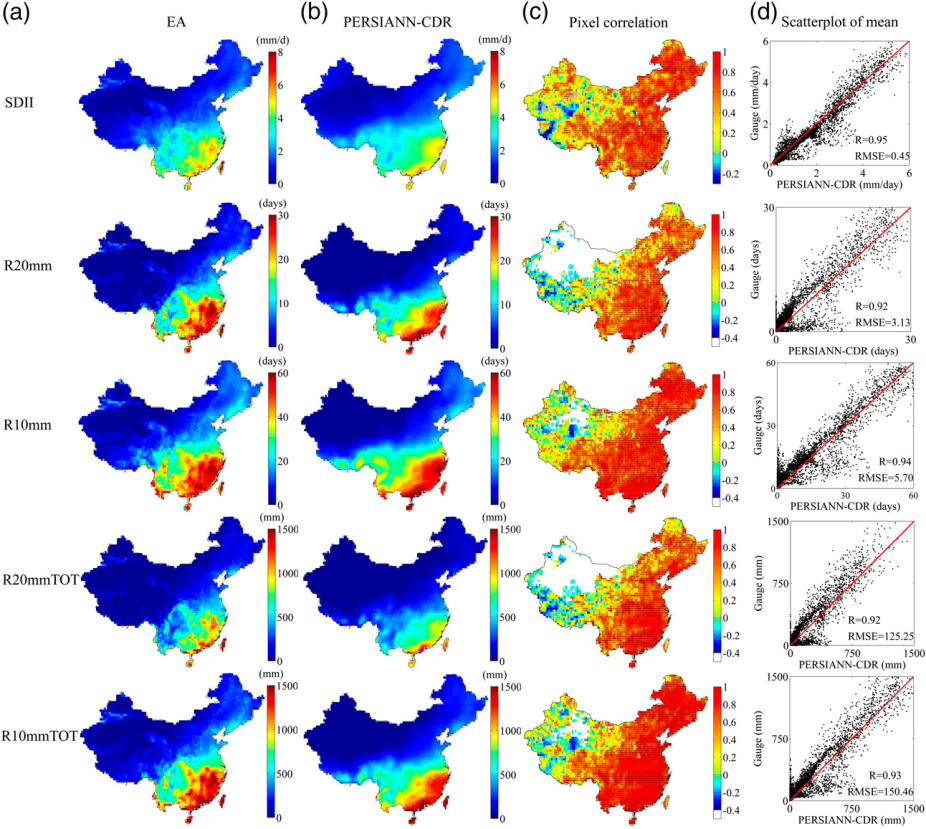
Figure 2. The absolute threshold indices of extreme daily precipitation from (a) the EA dataset and (b) PERSIANN-CDR. (c) The spatial correlation distribution of the indices from the EA dataset and (d) the scatterplots of the indices from PERSIANN-CDR dataset. The stippled areas in (c) show correlation coefficients significant at the 95% level (contributed by H. Ashouri)
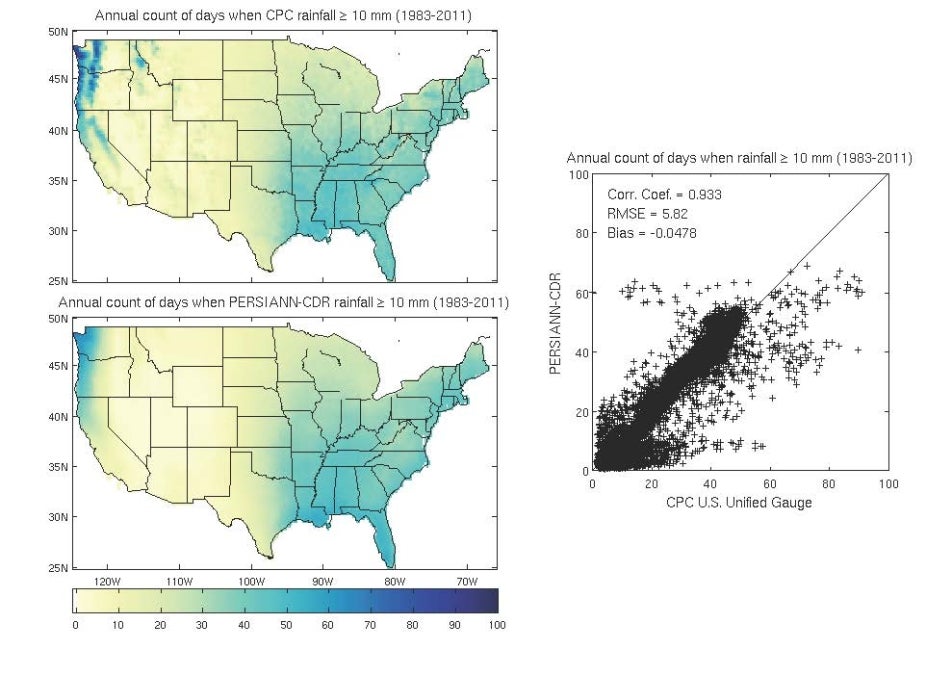
Figure 3. Average annual number (count) of rainy days (rain rate >= 10 mm/day) over the U.S. for 1983-2011 from CPC gridded gauge data (top) and PERSIANN-CDR (bottom) daily precipitation data products. The scatter plots and the calculated statistics are shown on the right. (contributed by H. Ashouri)
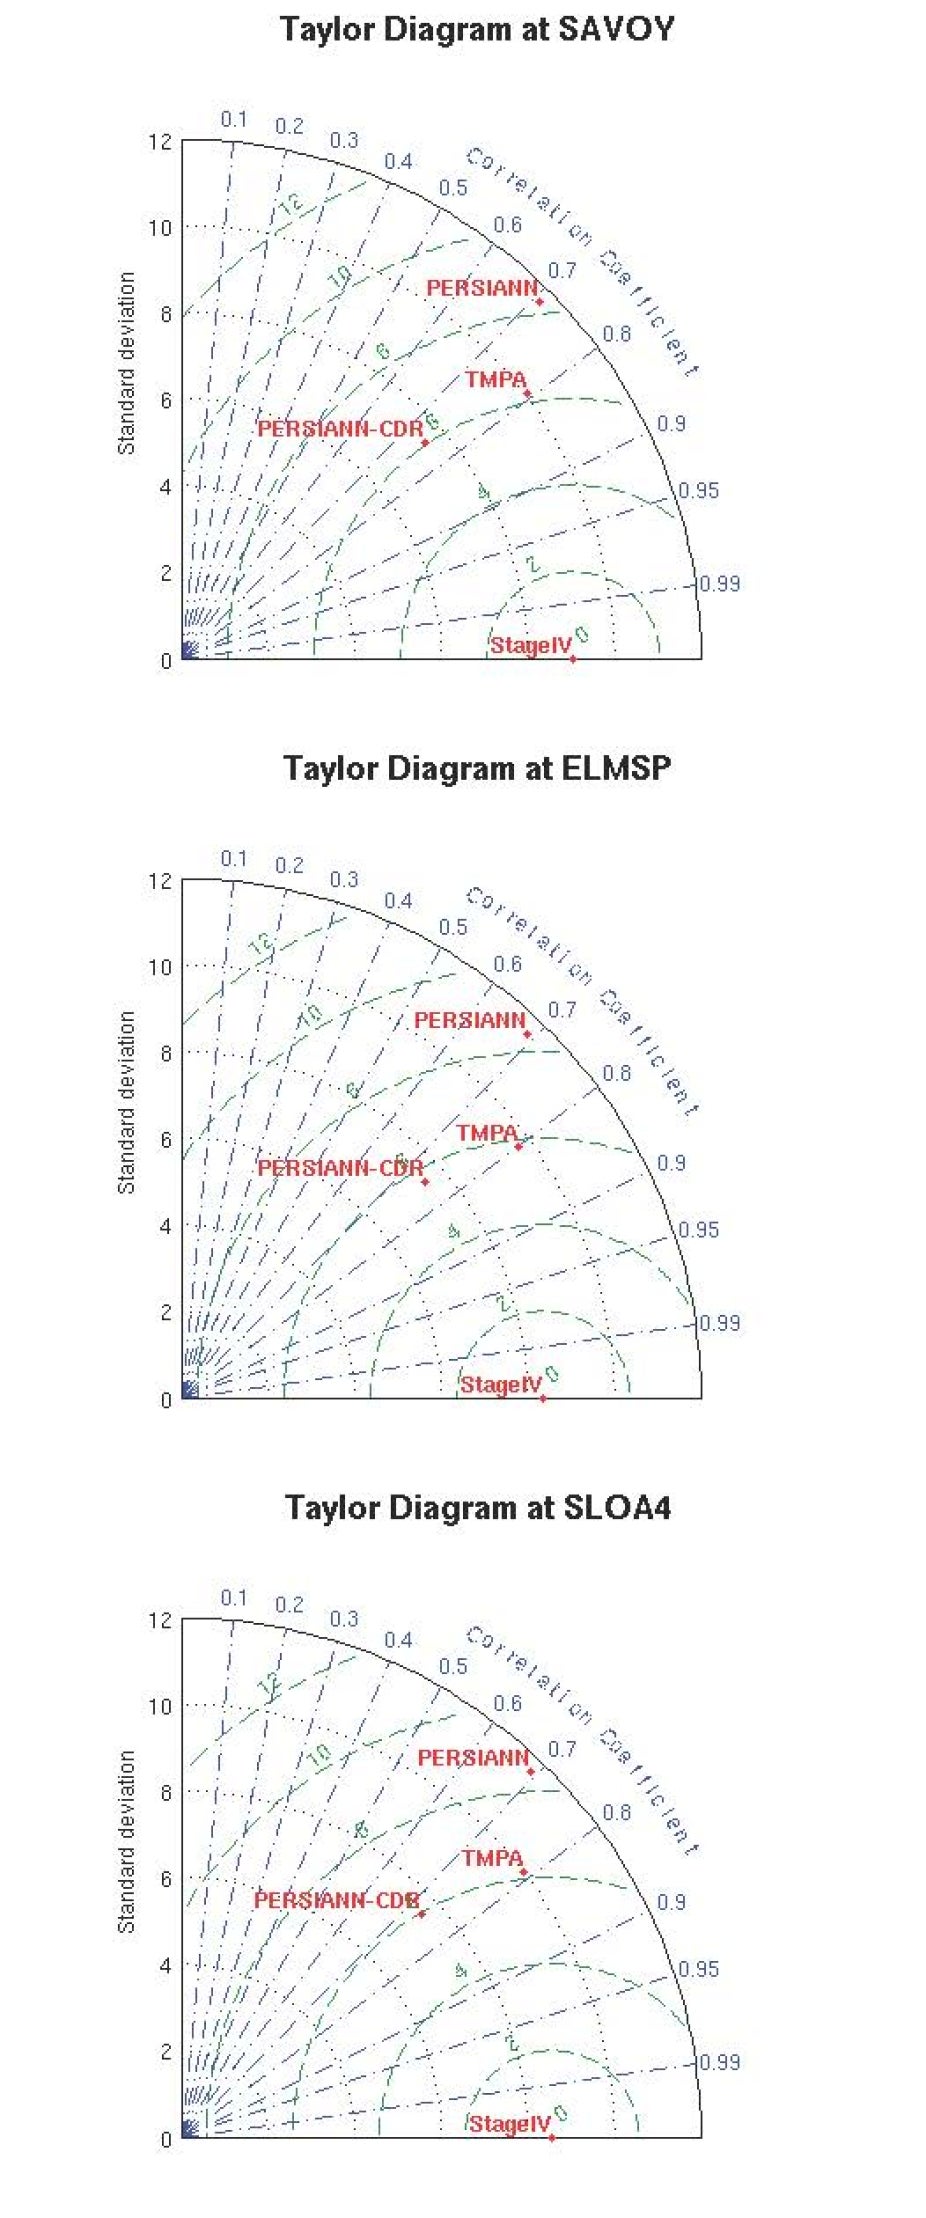
Figure 4. Precipitation comparison plots for 2003 – 2010 for the three Distributed Hydrologic Model Intercomparison Project - Phase 2 (DMIP2) test basins; SAVOY (top), ELMSP (middle), and SLOA4 (bottom). (contributed by H. Ashouri)
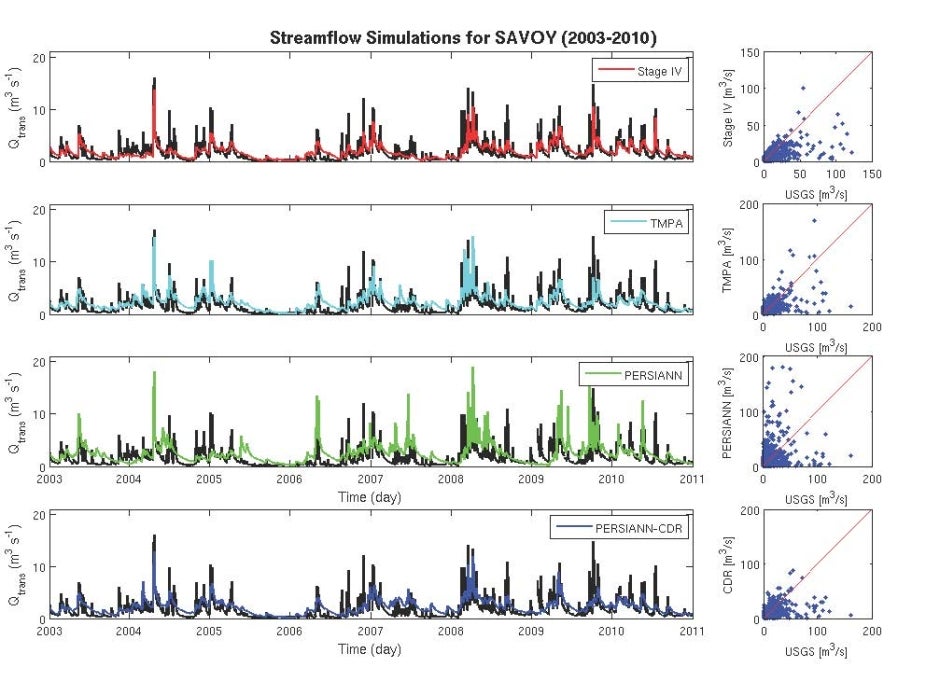
Figure 5. Simulated and observed streamflow hydrographs and respective scatterplots at the outlet of SAVOY basin using Stage IV, TMPA, PERSIANN, and PERSIANN-CDR (bottom) precipitation products. The solid black line shows the USGS observations. (contributed by H. Ashouri)

Figure 6: Time series of rain rates averaged over North America land area between 15- 49N for a) annual means, b) monthly means, and c) weekly means. (contributed by M Gehne)

Figure 7: Monthly long term means of precipitation for February. a) mean for GPCP. b)-f) the difference between GPCP mean and the respective data set mean for the period is indicated in shading, contours show the mean monthly precipitation for the respective data set. Contour levels go from 0 to 0.4 by 0.1mm/h. (Contributed by M Gehne)

Figure 8. Distribution of precipitation rate over land area for North America (15N-49N, 195E - 310E). Panels a)-d) show the climatological distribution for all seasons for 2006 - 2012. Precipitation rates are binned with logarithmic bin sizes to account for more frequent rain events at low rain rates. The x axis is plotted on a log-scale to compare the bulk of the distribution, not the tails. The black line shows the size of the bin at each precipitation rate. Distributions are computed for each month and grid point separately and then averaged over area and season (contributed by M Gehne)
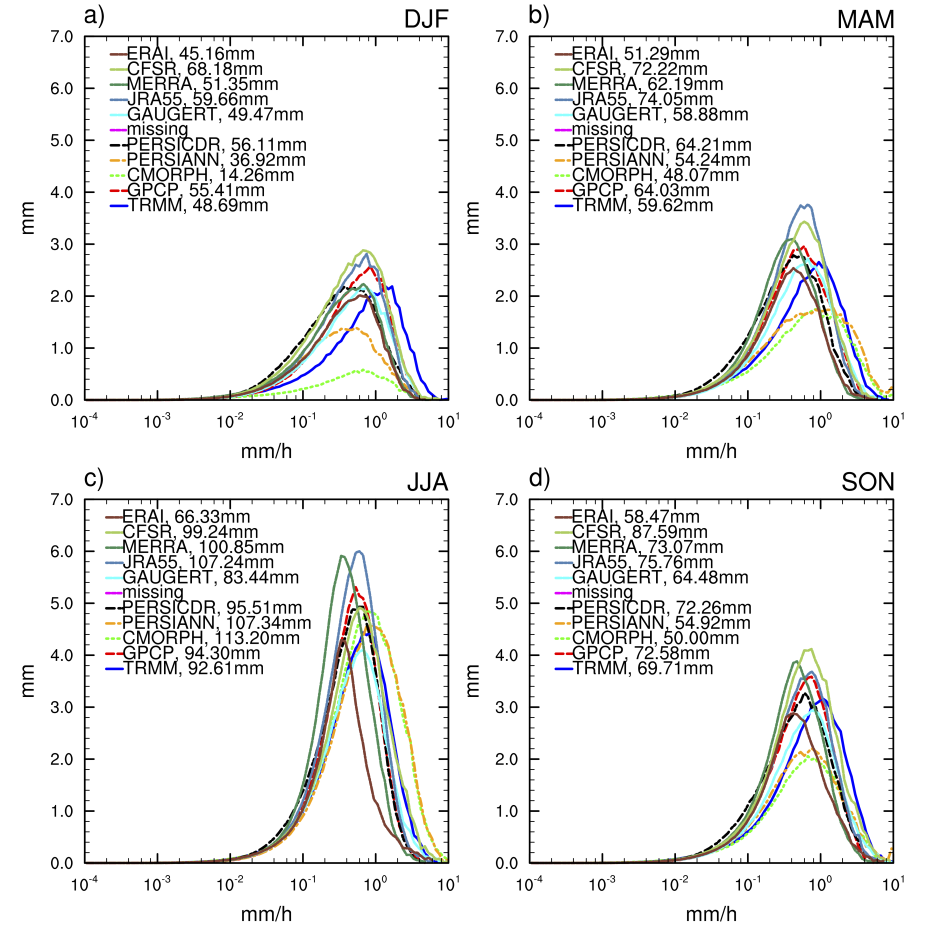
Figure 9: Distribution of precipitation amount by precipitation rate over land area for North America (15N-49N, 195E - 310E). Panels a)-d) show the precipitation amount dis- tribution for all seasons for 2006 - 2012. The average is computed over the years 2006 - 2012. Insets show average monthly totals during each season for the different estimates. (Contributed by M Gehne)
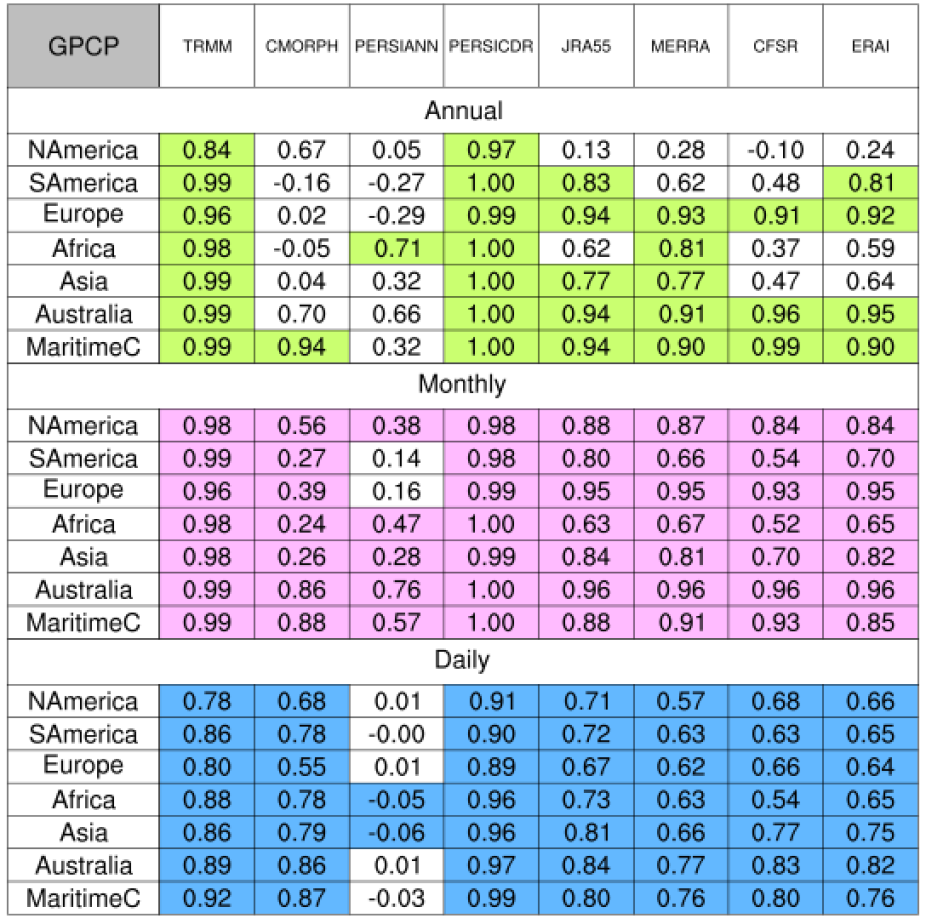
Figure 10: Correlation between land area averaged time series for GPCP-1DD and other precipitation estimates from 2003-2010. (contributed by M Gehne)