PRISM High-Resolution Spatial Climate Data for the United States: Max/min temp, dewpoint, precipitation
PRISM is a set of monthly, yearly, and single-event gridded data products of mean temperature and precipitation, max/min temperatures, and dewpoints, primarily for the United States. In-situ point measurements are ingested into the PRISM (Parameter elevation Regression on Independent Slopes Model) statistical mapping system. The PRISM products use a weighted regression scheme to account for complex climate regimes associated with orography, rain shadows, temperature inversions, slope aspect, coastal proximity, and other factors. Climatologies (normals) are available at 30-arcsec (800 meters) and monthly data are available at 2.5 arcmin (4 km) resolution. PRISM is the USDA's official climatological data.
Users requiring data with somewhat less precise spatial climatology, but more suitable for climate monitoring, may wish to check out NOAA's nCLIMGRID and nCLIMDIV datasets, which are based upon GHCN-Daily. Users looking for alternative, high-resolution datasets may wish to consider Daymet (see link in "Related pages" sidebar).
Key Strengths
Climatological data at very high spatial resolution, generated with a repeatable statistical procedure guided by expert knowledge
Performs well in regions of complex terrain, for example capturing temperature-height profiles associated with valley-floor inversions and transitions to the free atmosphere
AN81 precipitation grids incorporate radar-aided analyses east of the Rockies, essential for accurate representation of convective precipitation
Key Limitations
Data are not homogenized, so should not be used for century-long trend analysis.
Monthly temperature grids may not match the average of the dailies in that month; all stations are used in the monthlies, but only “PRISM Day” (morning) observers and hourly stations are used in the dailies to maintain day-to-day consistency of the data
The high-resolution (800m) timeseries data require a fee and are no longer distributed in netCDF. The 30-year, 800m monthly climatologies ("normals") are still available from the PRISM website to download for free.
Expert Developer Guidance
The following was contributed by Christopher Daly in February, 2019:
Spatial weather and climate data, usually in the form of continuous grids of pixels, are often key inputs to decision support systems and tools that require environmental data. These grids typically describe conditions over a monthly or daily time step, and offer estimates where weather stations do not exist. In the United States, high-resolution spatial weather and climate data sets are developed on an ongoing basis by Oregon State University’s PRISM Climate Group. The PRISM Climate Group is part of the Northwest Alliance for Computational Science and Engineering (NACSE), within the College of Engineering.
PRISM (Parameter-elevation Regressions on Independent Slopes Model) was first developed by Dr. Christopher Daly in 1991 (Daly et al. 1994). The original algorithm was written to mimic the decisions an expert climatologist makes while developing a map showing long-term averages of temperature and precipitation. (aka an “expert system”). In the years since its inception, PRISM has undergone nearly constant development, and has been operationalized to produce monthly and daily time series grids of an expanding list of meteorological variables, including precipitation, temperature (min, max, mean), dew point, and vapor pressure deficit (min, max). PRISM simulates how weather and climate vary spatially with physiographic features on the earth’s surface, such as terrain and coastlines, and uses topographic indices to identify areas that are subject to temperature inversions and rain shadows.
PRISM Datasets
PRISM produces three types of datasets: 30-year normals (averages), and time series designed for short-term and long-term use. Grids and graphics are available from http://prism.oregonstate.edu. Bulk grid downloads can be made either using FTP or via web services. The PRISM Data Explorer (http://prism.oregonstate.edu/explorer) is an efficient tool for extracting normal and time series data for specific locations.
Normals. PRISM normals are baseline datasets describing average monthly and annual conditions over the most recent three full decades (Daly et al. 1994, 2002, 2008, 2015; PRISM Climate Group 2016). The most recent normals for the conterminous US represent the period 1981-2010 (Norm81 dataset), and are available through the PRISM online portal normals page (http://prism.oregonstate/edu/normals/). The grids are provided at 30-arc-second (~800 m) and 2.5-arc-minute (~4 km) grid resolutions. Normals for Alaska, Pacific Islands, Virgin Islands, Jamaica, Puerto Rico and other regions, some for different averaging periods, are available from the projects page (http://prism.oregonstate.edu/projects/).
AN Dataset. The PRISM all-networks (AN) dataset is provided on both a daily (AN81d) and monthly (AN81m) time step, with the daily data spanning 1 January 1981-present and the monthly data spanning January 1895-present (PRISM Climate Group 2016). It incorporates all available station data and National Weather Service Advanced Hydrometeorological Prediction System (AHPS) NEXRAD analyses (beginning in 2002) east of the Rockies, and is our best rendition of conditions occurring on a specific day or month.
A “PRISM day” is defined as 1200 UTC-1200 UTC (e.g., 7 AM-7AM EST), which is the same as the AHPS day definition. Once-per day observation times must fall within +/- 4 hours of the PRISM day to be included in the AN81d tmax and tmin datasets. Stations without reported observation times are currently assumed to adhere to the PRISM day criterion. The dataset uses a day-ending naming convention, e.g., a day ending at 1200 UTC on 1 January is labeled 1 January.
The daily and monthly data available through the PRISM online portals are derived exclusively from the AN dataset. These freely available grids are rendered at 2.5-arc-minute resolution. The native 30-arc-second version is not online, but can be obtained directly from the PRISM Climate Group for a fee.
LT Dataset. The long-term (LT) time series dataset is provided at a monthly time step, and spans January 1895-present (PRISM Climate Group 2016). It uses only station networks that have data for at least 20 years, and does not use NEXRAD precipitation guidance. The LT dataset is relatively stable in time and useful for analyzing decadal-scale climate variations. However, it should not be used for century-long trend analyses, because statistical data homogenization routines have not been applied. This dataset is not available online, but can be obtained directly from the PRISM Climate Group for a fee. Grid resolution is 30 arc-seconds.
PRISM Application for Daily and Monthly Time Series
For each grid cell to be modeled, PRISM assimilates observations from 15-25 nearby station locations surrounding that grid cell. PRISM bases the influence of each of these stations on its distance from the grid cell, its physiographic and climatic similarity to the grid cell, and, where applicable, how similar its radar-derived precipitation value is to that of the grid cell.
For temperature and dew point, the physiographic weighting functions evaluate how similar the station’s elevation, proximity to a coastline (marine influence), topographic orientation (aspect), topographic position (e.g., in a sheltered valley bottom or on exposed terrain), and atmospheric layer (boundary layer or free atmosphere) are to the grid cell (Daly et al. 1994, 2002, 2008). The closer the station matches the physiographic characteristics of the grid cell, the higher the weight it receives. A station is also more highly weighted the closer its long-term temperature value (for that time of year) is to that of the grid cell, indicating that it is in a similar climatic regime. The long-term climatic values are based on PRISM gridded monthly normals (30-year averages). See Daly et al. (2008) for methods used to develop normals datasets.
For precipitation, the same physiographic weighting functions are used, with the exception that a station’s effective terrain height is evaluated instead of topographic position. The effective terrain height determines if a station is on a significant terrain barrier that can amplify precipitation, or if it is on relatively flat terrain where elevation variations have little effect on precipitation patterns (Daly at al. 2002). Again, the closer the station matches the physiographic characteristics of the grid cell, the higher the weight it receives. A station is also more highly weighted the closer its long-term precipitation value (for that month of the year) is to that of the grid cell, indicating that it is in a similar climatic regime. When radar coverage is available, the station is more highly weighted the closer the daily radar-based precipitation at its location is to that of the grid cell.=
Once initial weights of the surrounding stations have been determined, PRISM develops a statistical regression that relates the stations’ monthly normals to their observed daily temperature or precipitation values (Daly et al. 2017). PRISM may dynamically alter the station weights if it determines that some physiographic weighting variables are more important than others. Once the final relationship is established, it is used to make an estimate of the grid cell’s daily temperature or precipitation based on the grid cell’s 1981-2010 monthly average. When radar is used, a separate relationship is developed between the stations’ radar-derived daily precipitation values at their locations and their observed daily values. This relationship is used to make an estimate of the grid cell’s daily precipitation based on the grid cell’s radar-derived daily precipitation value. Finally, grid cell precipitation values estimated from the climate and radar statistical relationships are blended in a “besting” process to form a final estimate that is based on which relationship is the strongest (PRISM Climate Group 2016).
Operational Steps
Data Collection. Each day, the PRISM Climate Group collects data from roughly 20,000 stations for precipitation, 10,000 for temperature, and 4,000 for dew point and vapor pressure deficit. These include all of NOAA’s major networks; those operated by the US Forest Service, Bureau of Reclamation, and US Department of Agriculture (USDA); the large CoCoRaHS precipitation network; state and regional mesonets operating in Arizona, California, Colorado, Delaware, Florida, Kansas, Minnesota, Nevada, New Jersey, North Carolina, North Dakota, Oklahoma and Washington; and Environment Canada stations. New networks are being evaluated and added on an ongoing basis. East of the Rockies, PRISM supplements its rainfall observations with Stage II and Stage IV Advanced Hydrometeorological Prediction System (AHPS) radar/rain gauge analyses, which provide a more precise and accurate picture of fine-scale rainfall patterns than would be possible with station data alone (PRISM Climate Group 2016).
Quality Control. PRISM’s quality control (QC) system includes network-level screening for appropriate measuring equipment; single-station QC, which performs range and data completeness checks; radar QC, designed to screen for zeros and “spikes” in the record that cannot be corroborated with the AHPS NEXRAD analysis; and spatial QC, which uses the PRISM modeling system to identify observations that are spatially inconsistent. Once a month, manual QC is performed, where analysts visually review the daily and monthly maps and flag additional outliers.
PRISM Mapping. PRISM is run to create precipitation grids using two competing methods. The first uses Climatologically-Aided Interpolation (CAI) (Daly et al. 2012, 2015, 2017), in which, on a grid cell by grid cell basis, grids of long-term climatological precipitation averages are statistically regressed against the daily station data. The second uses the same approach as the first, but uses AHPS radar grids instead of the long-term average grids as the predictors. Once the two methods have been run, a “besting” process is performed on each pixel to determine which method (CAI or radar) produces the strongest relationship between the predictor grid and the station data. It chooses one or the other, or a blend of the two (PRISM Climate Group 2016). The resulting precipitation grid for the day is a composite of this pixel-by-pixel besting process. In general, the radar-based method often produces a superior product east of the Rocky Mountains during summer, when small-scale convective storms dominate precipitation patterns. CAI dominates in the West, where large-scale terrain features produce repeatable patterns that are captured by the climatologies, and sometimes during winter in the east, where precipitation tends to occur as large-scale storms.
Repeated Mapping, Data Collection, and QC. The first rendition of a day’s precipitation grid is run approximately one day after the day has ended. A second version of that day is run four days later, as more station data become available. Additional versions of the day’s precipitation grid are produced with PRISM around the middle of each of the following six months, as more data that have been QC’ed by the data providers becomes available. Manual QC by PRISM analysts also takes place during these monthly updates. A total of eight renditions of the day’s map are made, at which time the map is considered “stable” (PRISM Climate Group 2018).
Uncertainty
Mean absolute errors in the PRISM annual precipitation normals have been published regionally (Daly et al. 2008). They range from 5% in the eastern US to 10% in the West. Temperature errors range from 0.5°C in the east to 1.0°C in the West. Increased terrain complexity and sparser data availability contribute to higher uncertainty in the West. These normals guide the development of other climate datasets by providing the expected spatial patterns of climatic variables under average conditions for the CAI analysis. PRISM daily (1981-present) and monthly (1895-present) time series datasets are developed using this technique, which means that uncertainties in the normals propagate into these products.
It is difficult to estimate the uncertainty of the time series datasets with any degree of certainty, given the wide temporal variations in data density and complexity of the climatic fields (especially precipitation). However, studies have been conducted to estimate the uncertainty in PRISM gridded datasets in situations where high-quality ground-truth data are available. Daly et al. (2017) compared monthly PRISM precipitation grids (AN81m dataset) to a high-density rain gauge network operating in the 1950s at the Coweeta Hydrologic Laboratory, located in the southern Appalachians of western North Carolina. The PRISM grids matched closely (within 5%) with the Coweeta dataset. Interestingly, the PRISM regression prediction interval, which is used to estimate interpolation error, overestimated the actual ground truth error. Strachan and Daly (2017) compared PRISM daily temperature grids (AN81d dataset) to observations of daily temperature maximum (TMAX) and minimum (TMIN) on 16 sites located on steep, open woodland slopes ranging from 1967 to 3111 m in elevation in the Walker Basin, California-Nevada. Individual site mean absolute errors varied from 1.1 to 3.7°C with better performance observed during summertime as opposed to winter. There was a consistent cool bias in TMIN for all seasons across all sites, with cool bias in TMAX varying with season. This study highlighted the role that differences in the site characteristics of the PRISM source data in the area (in this case SNOTEL stations located in flat areas surrounded by forest), and those of the comparison stations (primarily steep, open slopes) can play in producing local temperature biases.
Strengths
- High resolution grids (30 arc-seconds and 2.5 arc-minutes)
- Sophisticated, physiographically-based interpolation methodology
- Long-term normals peer-reviewed by practitioners and local experts
- Well-developed quality control of station data, including expert evaluation
- AN81 precipitation grids incorporate radar-aided analyses east of the Rockies, essential for accurate representation of convective precipitation
Limitations
- Data are not homogenized, so should not be used for century-long trend analysis.
- Monthly temperature grids may not match the average of the dailies in that month; all stations are used in the monthlies, but only “PRISM Day” (morning) observers and hourly stations are used in the dailies to maintain day-to-day consistency of the data
##
Cite this page
Acknowledgement of any material taken from or knowledge gained from this page is appreciated:
Daly, Christopher & National Center for Atmospheric Research Staff (Eds). Last modified "The Climate Data Guide: PRISM High-Resolution Spatial Climate Data for the United States: Max/min temp, dewpoint, precipitation.” Retrieved from https://climatedataguide.ucar.edu/climate-data/prism-high-resolution-spatial-climate-data-united-states-maxmin-temp-dewpoint on 2026-07-09.
Citation of datasets is separate and should be done according to the data providers' instructions. If known to us, data citation instructions are given in the Data Access section, above.
Acknowledgement of the Climate Data Guide project is also appreciated:
Schneider, D. P., C. Deser, J. Fasullo, and K. E. Trenberth, 2013: Climate Data Guide Spurs Discovery and Understanding. Eos Trans. AGU, 94, 121–122, https://doi.org/10.1002/2013eo130001
Key Figures
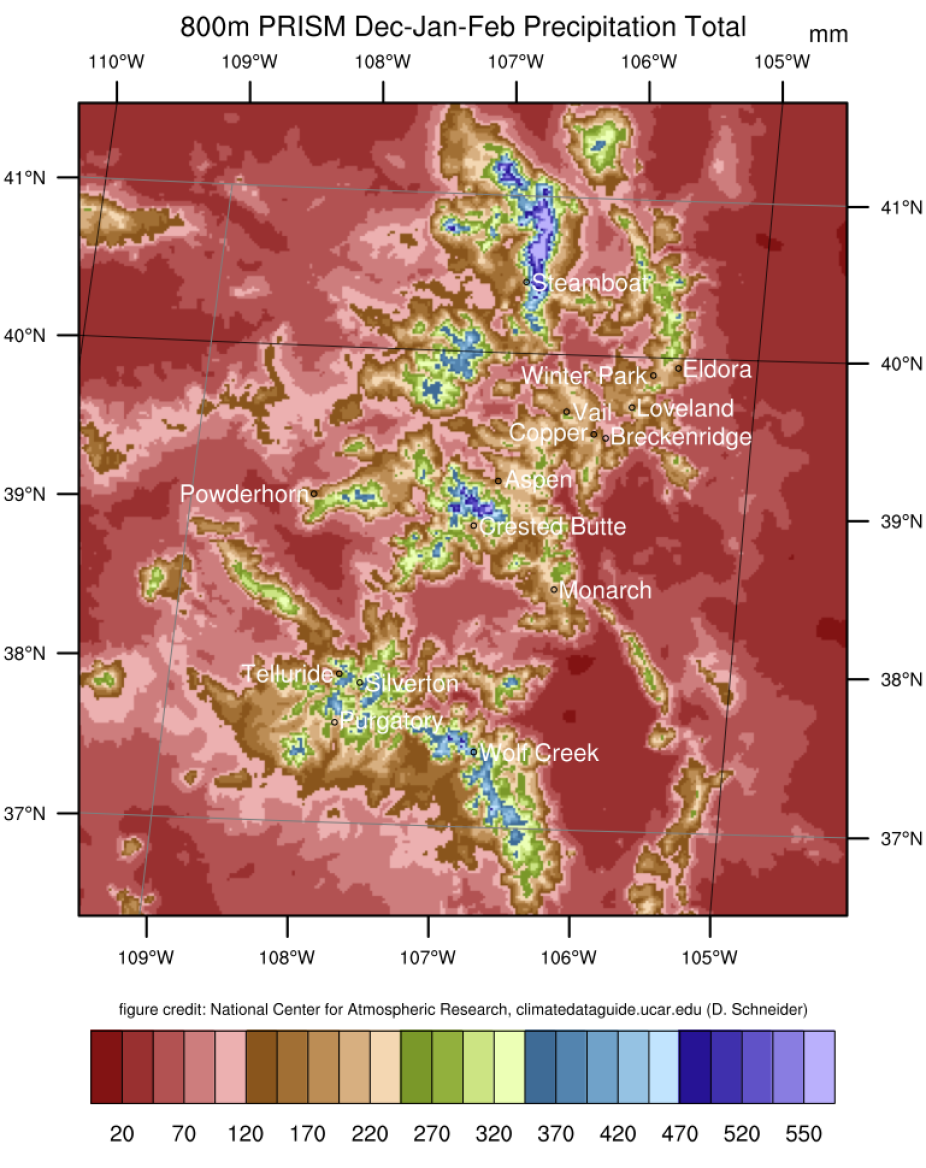
Average winter (Dec-Jan-Feb) precipitation in western Colorado based on the 800-m PRISM dataset. Units are mm water equivalent. Locations of popular ski areas are indicated. (credit: NCAR Climate Data Guide, D. Schneider)
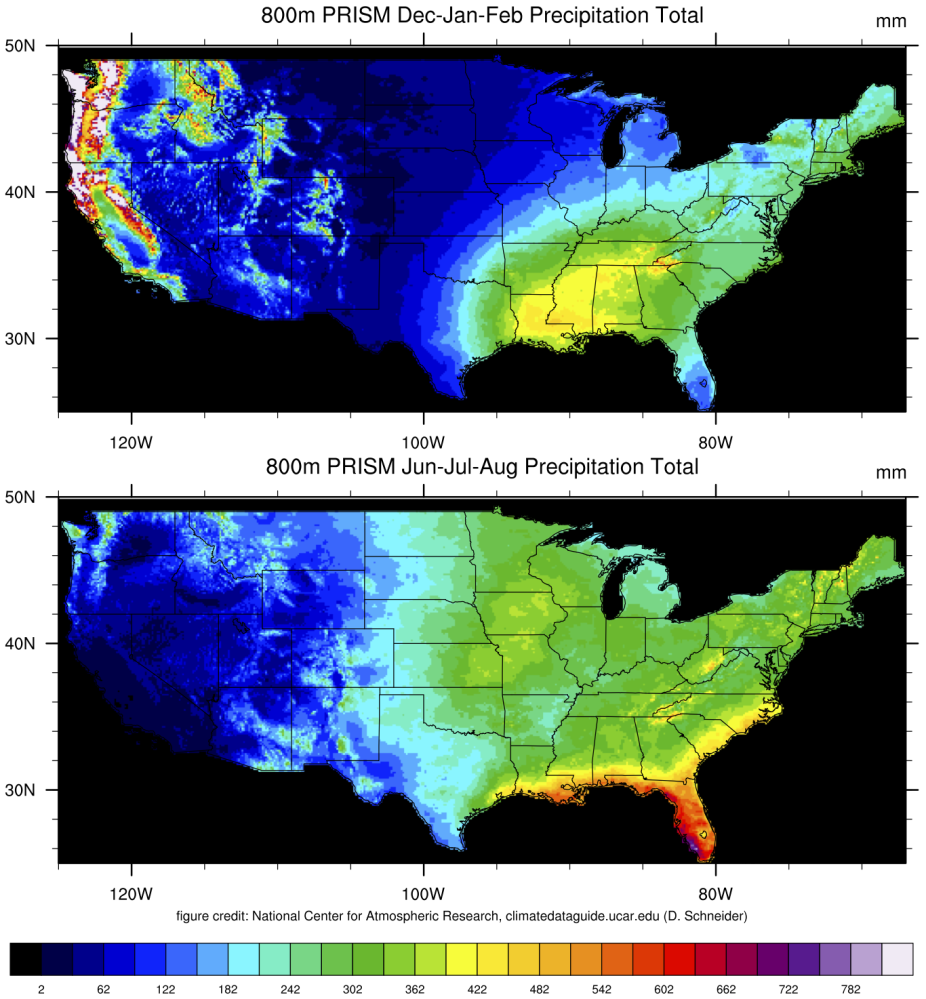
PRISM 30-year normal precipitation amount in DJF and JJA (credit: NCAR ClimateDataGuide, D Schneider)
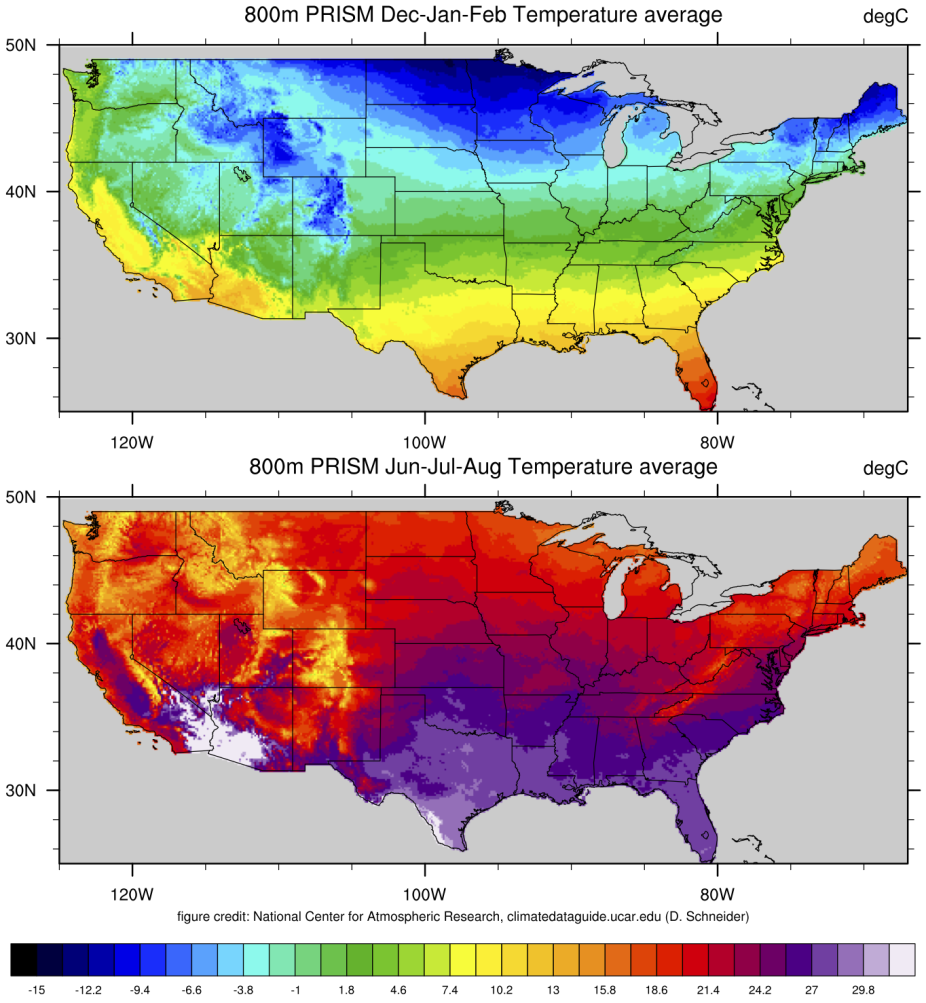
PRISM 30-year normal average temperature in DJF and JJA (credit: NCAR ClimateDataGuide, D Schneider)
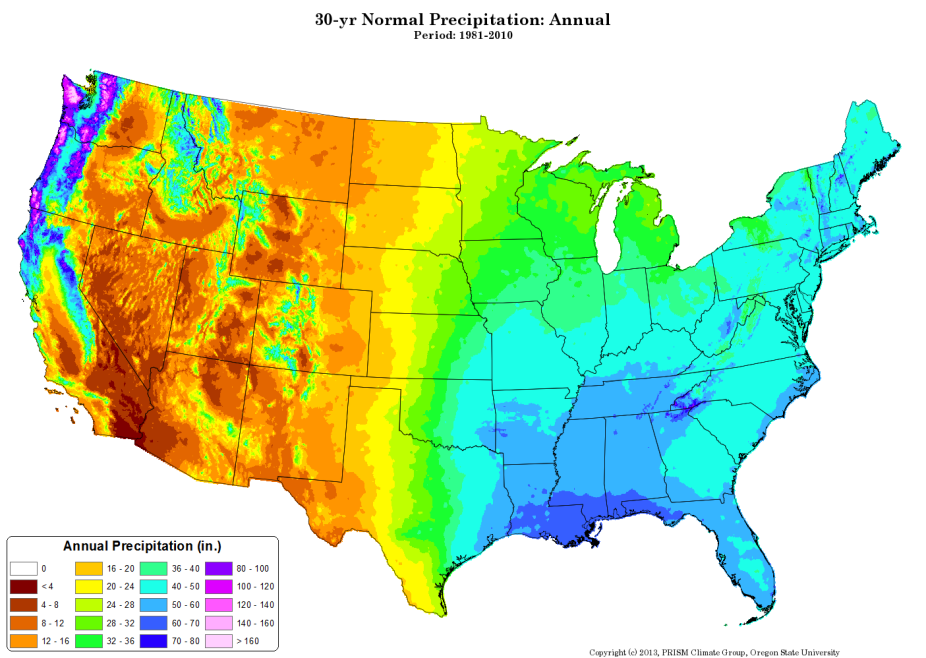
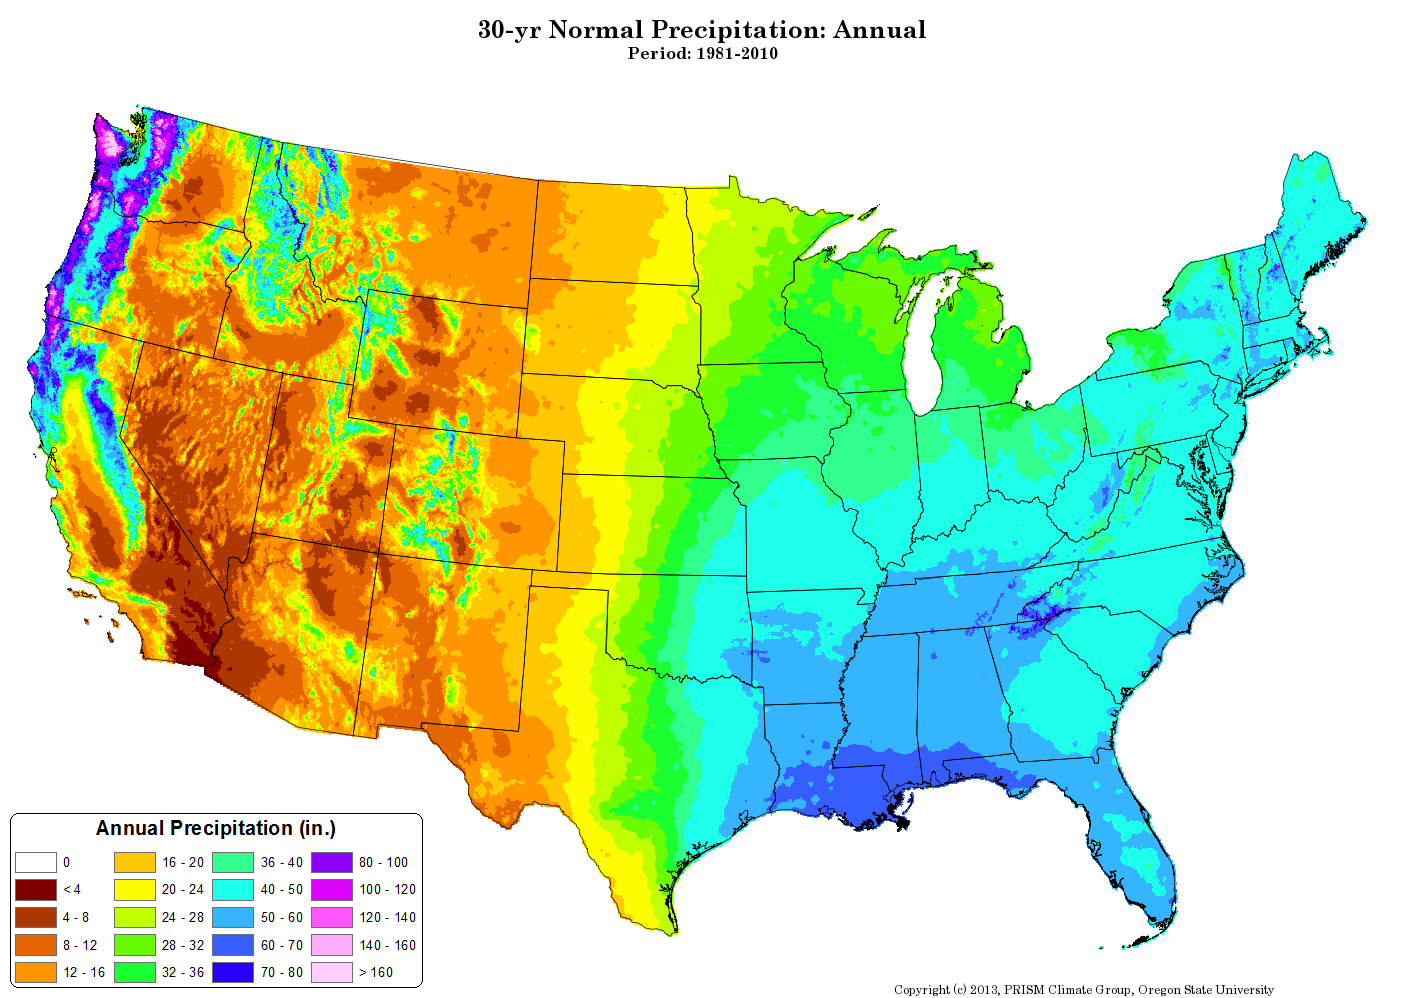
PRISM 30-year normal precipitation climatology. Credit: http://www.prism.oregonstate.edu/normals/; retrieved 12 Feb 2014.
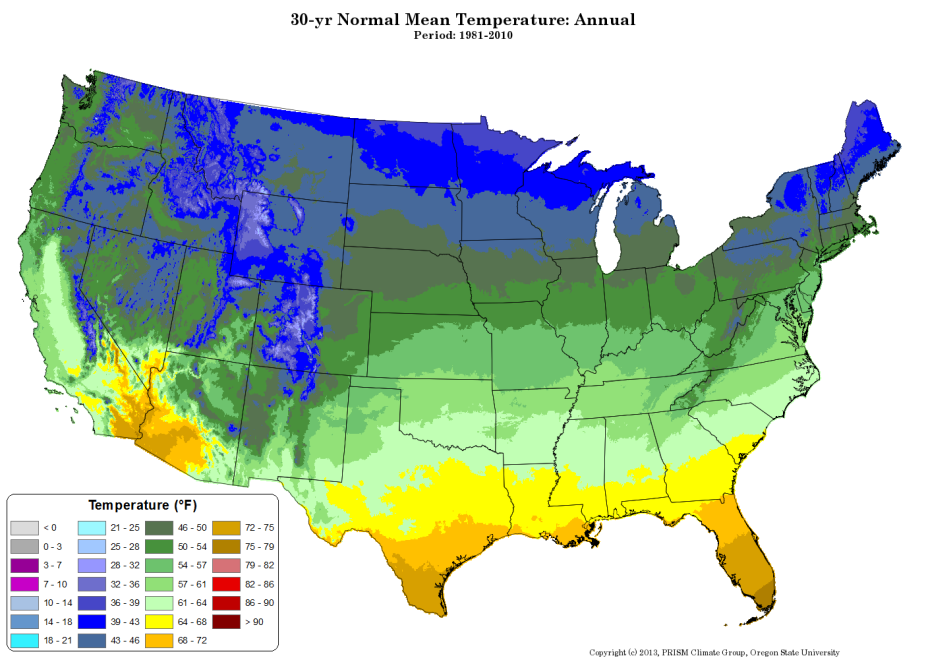
PRISM 30-year normal temperature climatology. Credit: http://www.prism.oregonstate.edu/normals/; retrieved 12 Feb 2014.
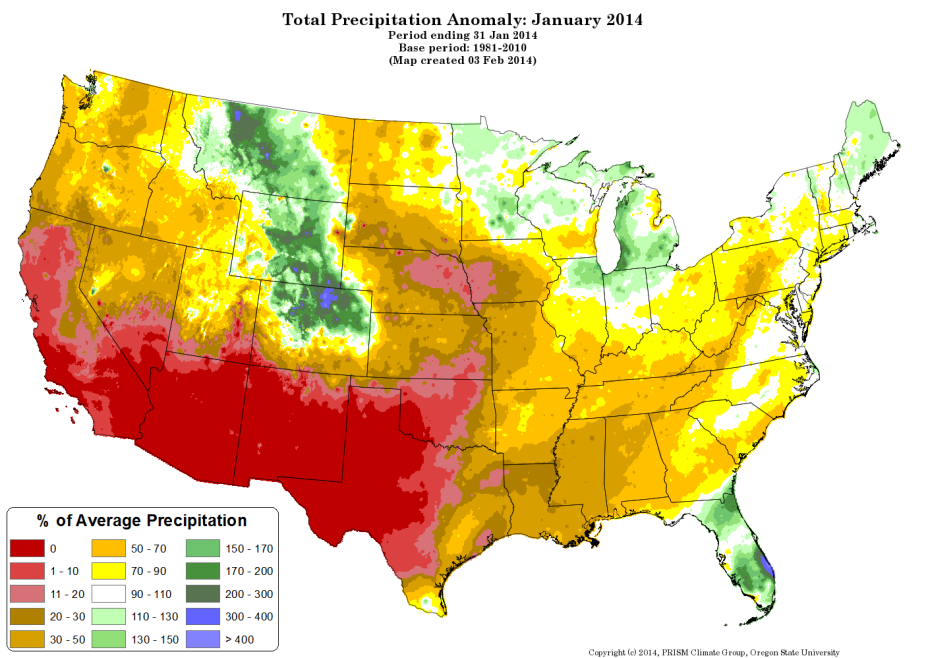
PRISM precipitation anomaly in January 2014. Credit: http://www.prism.oregonstate.edu/comparisons/; retrieved 12 Feb 2014.
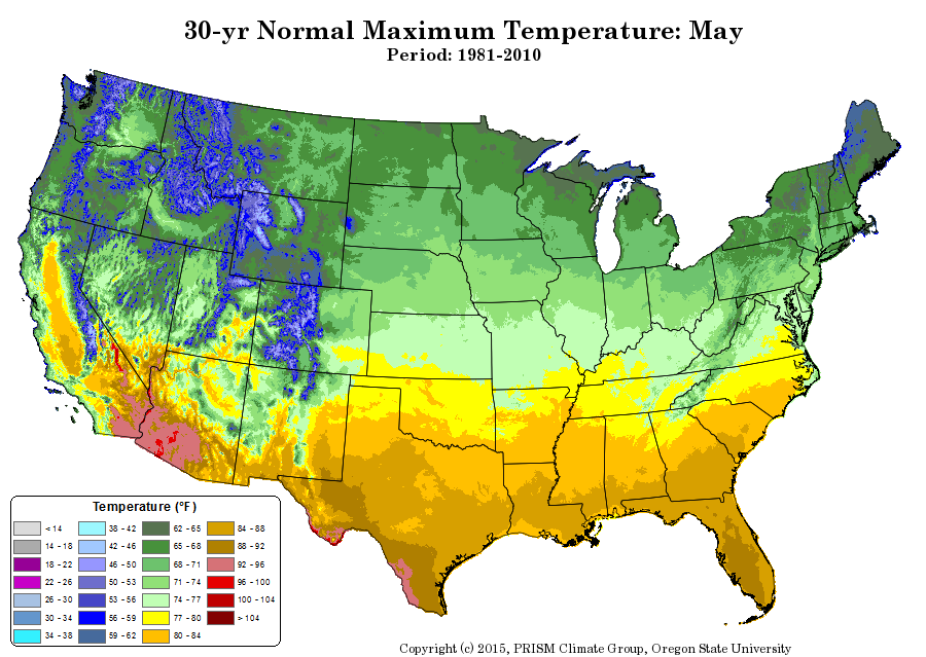
PRISM 30-yr normal maximum temperature for May (contributed by C Daly)
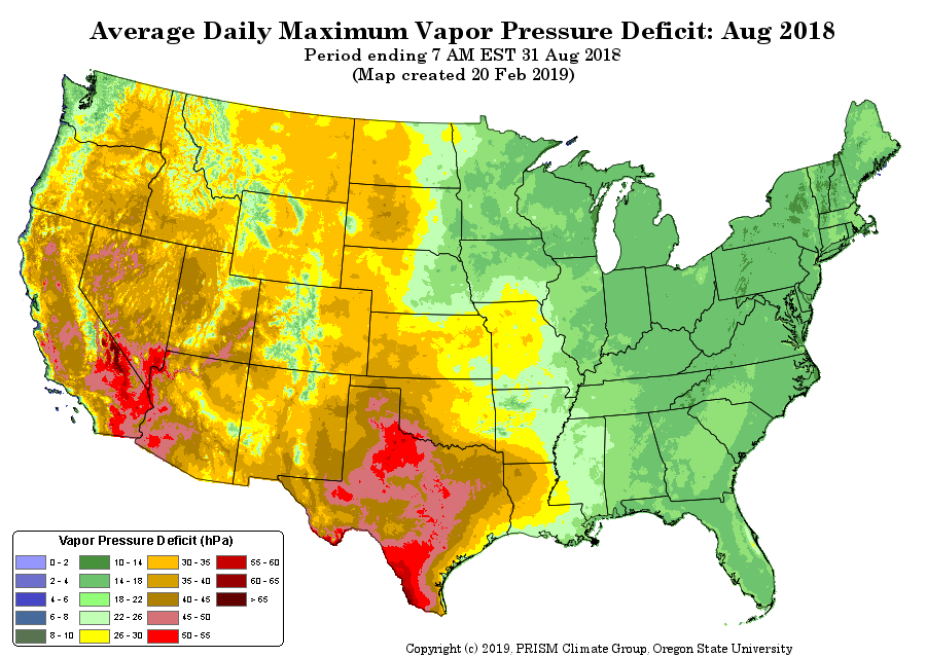
PRISM average daily maximum vapor pressure deficit (contributed by C Daly)
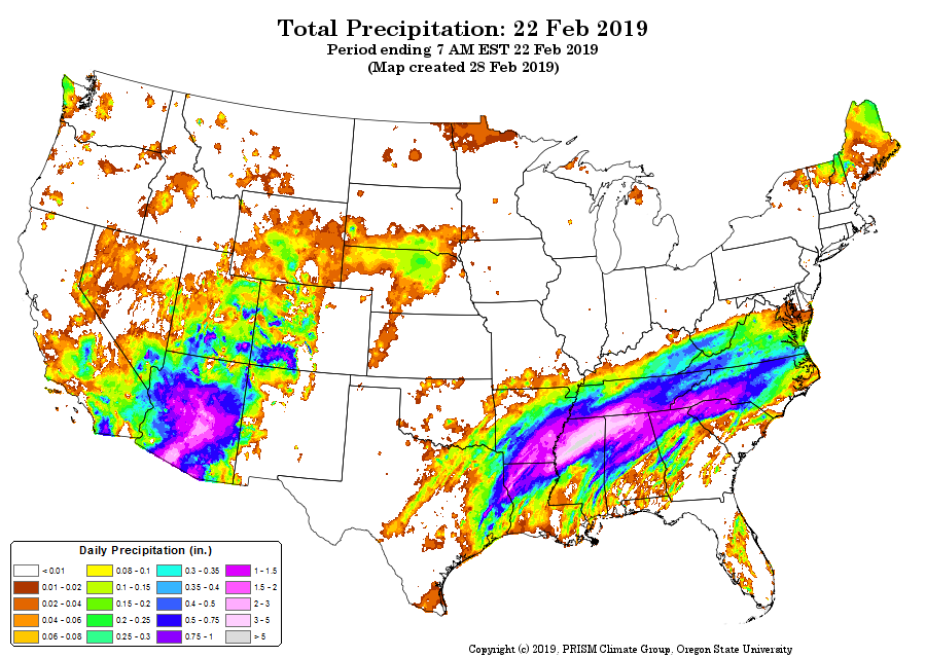
Total precipitation for 22 February 2019 (contributed by C Daly)
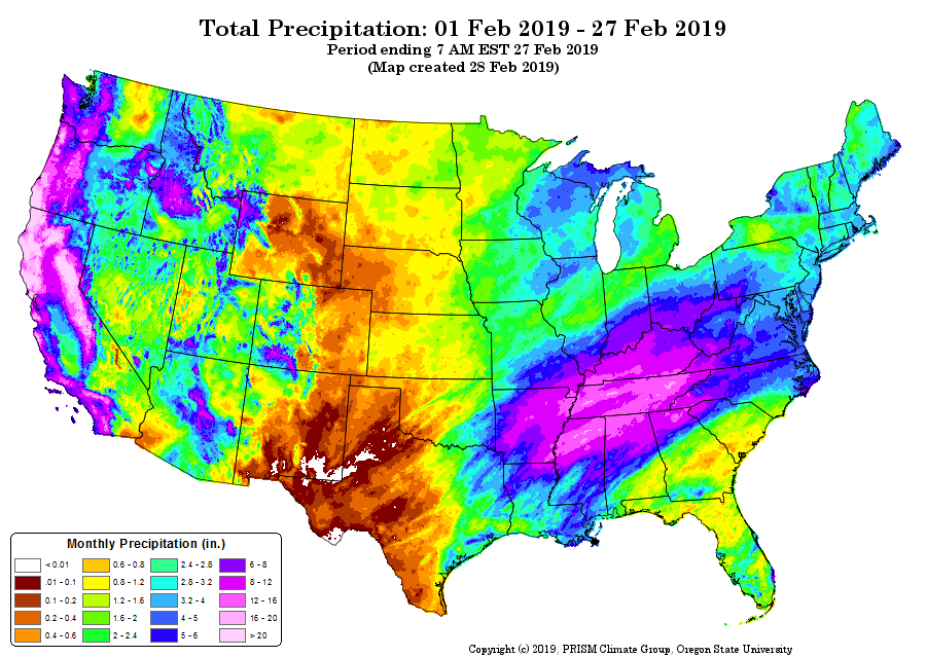
Month-to-date precipitation for 01-27 February 2019 (contributed by C Daly)
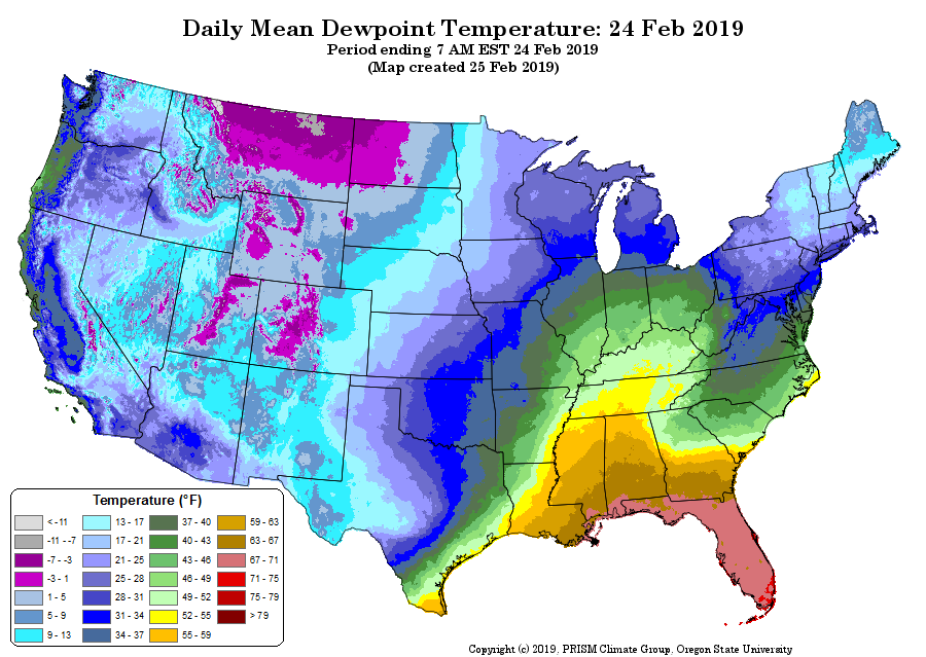
Daily mean dewpoint temperature for 24 February 2019 (contributed by C Daly)
Other Information
- Daly, C. et al, 2002: A knowledge-based approach to the statistical mapping of climate. Climate Res., 22, 99–113.
- Daly, C. et. al, 2008: Physiographically sensitive mapping of climatological temperature and precipitation across the conterminous United States. Int. J. Climatol., 28: 2031–2064.
- Daly, C., R.P. Neilson, and D.L. Phillips, 1994: A Statistical-Topographic Model for Mapping Climatological Precipitation over Mountanious Terrain. J. Appl. Meteor., 33, 140-158
- Daly, C., Slater, M., Roberti, J.A., Laseter, S., and L. Swift. 2017. High-resolution precipitation mapping in a mountainous watershed: Ground truth for evaluating uncertainty in a national precipitation dataset. International Journal of Climatology. doi:
- Daly, C., J.I. Smith, and K.V. Olson. 2015. Mapping atmospheric moisture climatologies across the conterminous United States. PloS ONE 10(10):e0141140. doi:10.1371/journal.pone.0141140.
- Daly, C., M.P. Widrlechner, M.D. Halbleib, J.I. Smith, and W.P. Gibson. 2012. Development of a new USDA plant hardiness zone map for the United States. Journal of Applied Meteorology and Climatology, 242-264.
- PRISM Climate Group. 2016. Descriptions of PRISM Spatial Climate Datasets for the Conterminous United States. Web-accessible document available at http://prism.oregonstate.edu/documents/PRISM_datasets.pdf
- Strachan, S., and C. Daly. 2017. Testing the daily PRISM air temperature model on semiarid mountain slopes. Journal of Geophysical Research Atmospheres, 122, 5697-5715. doi:10.1002/2016JD025920.