Climate data guide content with tag North America
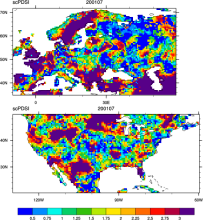 CRU sc-PDSI (self-calibrating PDSI) over Europe & North America
Years of record
- to
Maps of the monthly self-calibrating Palmer drought severity index (SCPDSI) have been calculated for the period 1901–2002 for the contiguous United States (20°–50°N and 130°–60°W) and Europe (35°–70°N, 10°W–60°E) with a spatial resolution of 0.5° × 0.5°
-
Formats
- ascii
-
Timestep
- Monthly
-
Domain
- Europe, North America
-
Collections
- N/A
Experts contributing reviews
- N/A
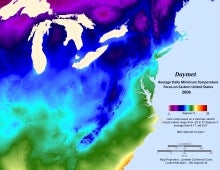 Daymet: Daily Surface Weather and Climatological Summaries
Years of record
- to
Daymet provides long-term, continuous, gridded estimates of daily weather and climatology variables by interpolating and extrapolating ground-based observations through statistical modeling techniques. The Daymet data products provide driver data for biogeochemical terrestrial modeling and have myriad applications in many Earth science, natural resource, biodiversity,…
Main variables and Earth System components
Atmosphere Maximum Air Temperature Minimum Air Temperature Precipitation Radiation Water Vapor Cryosphere Snow Water Equivalent-
Timestep
- Climatology, Daily
-
Domain
- North America
-
Collections
- N/A
Experts contributing reviews
- Thornton, Peter E
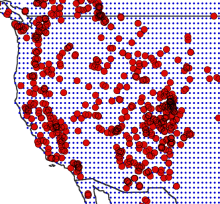 Drought atlases from tree rings
Years of record
- to
Tree-ring drought atlases provide a paleoclimate analog to modern drought indices, most commonly the Palmer Drought Severity Index (PDSI). Produced on a regular lat-lon grid for regions such as North America, Europe, and Australia, these centuries-long datasets are convenient for comparisons with climate model experiments and historical data on human populations…
-
Timestep
- Annual
-
Domain
- North America
-
Collections
- N/A
Experts contributing reviews
- Cook, Edward
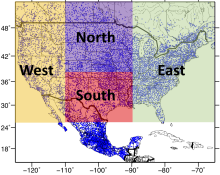 Livneh gridded precipitation and other meteorological variables for continental US, Mexico and southern Canada
Years of record
- to
The Livneh et al. (2015) hydrometeorological dataset consists of gridded daily and monthly precipitation, maximum and minimum air temperature, and wind speed for the continental US, southern Canada, and Mexico for the period 1950-2013. Gridded at 1/16° horizontal resolution (~ 6km), the data have been used as training data for GCM downscaling, as validation for…
Main variables and Earth System components
Atmosphere Maximum Air Temperature Minimum Air Temperature Precipitation Wind-
Formats
- netCDF
-
Timestep
- Daily, Monthly
-
Domain
- North America
-
Collections
- N/A
Experts contributing reviews
- Livneh, Ben
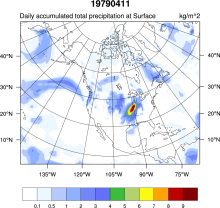 NCEP NARR
Years of record
- to
A high resolution (32km x 29 pressure levels) data set focused upon the North American Region. Relative to the NCEP-DOE (R2) it has a much improved land-hydrology, diurnal cycle and land-atmosphere interaction. As such, it can be considered a second generation reanalysis. A unique feature is the direct assimilation of observed precipitation.
Main variables and Earth System components
Atmosphere Air Temperature Geopotential Height Precipitable water Land-
Formats
- GRIB
-
Timestep
- Climatology, Sub-daily, Monthly
-
Domain
- North America
-
Collections
- N/A
Experts contributing reviews
- N/A
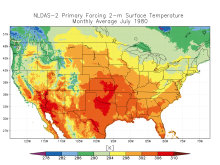 NLDAS: North American Land Data Assimilation System
Years of record
- to
The North American Land Data Assimilation System (NLDAS) integrates a large quantity of observation-based and model reanalysis data to produce long-term hourly atmospheric forcing data, and then uses this meteorological data to drive offline (not coupled to the atmosphere) land-surface and/or hydrological models. The spatial resolution of NLDAS is at 1/8th-degree…
Main variables and Earth System components
Atmosphere Air Temperature CAPE Evaporation Precipitation Radiation Specific Humidity Surface Pressure Wind-
Timestep
- Climatology, Sub-daily, Monthly
-
Domain
- North America
-
Collections
- N/A
Experts contributing reviews
- Xia, Youlong, Mocko, David
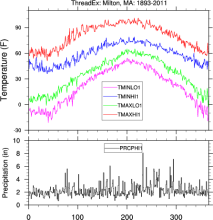 NOAA ThreadEx Long-term Station Extremes for America
Years of record
- to
ThreadEx is a data set of extreme daily temperature and precipitation values for 270 locations in the United States. For each day of the year at each station, ThreadEx provides the top 3 record high and low daily maximum temperatures, the top 3 record high and low daily minimum temperatures, the top 3 daily precipitation totals, along with the years the records were set…
Main variables and Earth System components
Atmosphere Air Temperature Maximum Air Temperature Minimum Air Temperature Precipitation-
Formats
- ascii
-
Timestep
- Daily
-
Domain
- North America
-
Collections
- N/A
Experts contributing reviews
- N/A
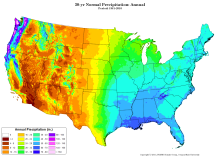 PRISM High-Resolution Spatial Climate Data for the United States: Max/min temp, dewpoint, precipitation
Years of record
- to
PRISM is a set of monthly, yearly, and single-event gridded data products of mean temperature and precipitation, max/min temperatures, and dewpoints, primarily for the United States. In-situ point measurements are ingested into the PRISM (Parameter elevation Regression on Independent Slopes Model) statistical mapping system. The PRISM products use a weighted regression…
Main variables and Earth System components
Atmosphere Dew Point Temperature Maximum Air Temperature Minimum Air Temperature Precipitation-
Formats
- ARC/INFO ASCII GRID, netCDF
-
Timestep
- Climatology, Daily, Monthly
-
Domain
- North America
-
Collections
- N/A
Experts contributing reviews
- Daly, Christopher
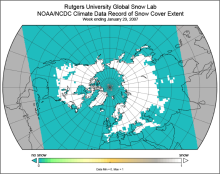 Snow Cover Extent (Northern Hemisphere) Climate Data Record, by Rutgers
Years of record
- to
The Snow Cover Extent Climate Data Record extends from the late 1960s to present. Historical analyses based on visual inspection have been digitized and combined with modern multi-spectral remote sensing to produce a seamless record on a hemispheric scale. The data are available at weekly and monthly resolutions in a variety of formats. The spatial resolution varies with…
-
Timestep
- Monthly, Weekly
-
Domain
- North America
-
Collections
- Climate Data Record, Diagnostic Data Sets, NCAR-DOE-CESM, landdiagnostics
Experts contributing reviews
- Estilow, Thomas W., Robinson, David
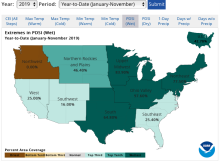 U.S. Climate Extremes Index (CEI)
Years of record
- to
The U.S. Climate Extremes Index (CEI) was first presented in 1995 as a framework for quantifying observed changes in climate within the contiguous United States. At present, the CEI evaluates the percent area of extremes in the distribution of much above/below average (top/bottom 10% of occurrence) temperatures, precipitation, drought, and tropical cyclone wind…
Main variables and Earth System components
Atmosphere Air Temperature Maximum Air Temperature Minimum Air Temperature Precipitation Wind Land Drought-
Formats
- ascii
-
Timestep
- Monthly, Seasonal, Annual
-
Domain
- North America
-
Collections
- N/A
Experts contributing reviews
- Gleason, Karin