CHELSA high-resolution land surface temperature and precipitation
The Climatologies at high resolution for the Earth's land surface (CHELSA) dataset contains high spatial resolution monthly climatologies of mean, maximum and minimum temperatures and mean precipitation, representing the period 1979-2013. CHELSA is essentially a statistical downscaling of the ERA-Interim reanalysis, with the temperature downscaling based on mean lapse rates and elevation, and the precipitation algorithm using geographic predictors including wind fields, exposure, and boundary layer height. The data are intended for applications in ecology, agriculture and meteorology that depend on high resolution data. Although the main dataset is derived from a reanalysis, the CHELSA algorithms could be used to downscale climate model simulations of past and future climate. Originally published as a climatology, CHELSA data are now available for each month from January 1979 to December, 2013.
Key Strengths
high-resolution climatologies of temperature and precipitation for the Earth's land surface
well-suited for species distribution modeling and other ecological applications
CHELSA algorithms could be applied to climate model output
Key Limitations
low-level temperature inversions are not sufficiently represented in the data
no coverage over oceans
uncertainty information not provided
Karger, D.N., Conrad, O., Böhner, J., Kawohl, T., Kreft, H., Soria-Auza, R.W., Zimmermann, N.E., Linder, H.P., Kessler, M. (2017) Data from: Climatologies at high resolution for the earth’s land surface areas. Dryad Digital Repository. https://doi.org/10.5061/dryad.kd1d4
and
Karger, D.N., Conrad, O., Böhner, J., Kawohl, T., Kreft, H., Soria-Auza, R.W., Zimmermann, N.E., Linder, H.P. & Kessler, M. (2017) Climatologies at high resolution for the earth’s land surface areas. Scientific Data 4, 170122.
CC BY 4.0
Expert Developer Guidance
The following was contributed by Dirk Karger (Swiss Federal Research Institute, October, 2017):
Key Limitations:
- Low-level temperature inversions are not sufficiently represented in the data.
- orographic precipitation might be slightly overestimated in flat terrain.
- Bias correction of precipitation over the oceans is not reliable for now. Therefore only land surface areas can be represented.
Key Strengths:
- Better representation of orographic rainfall patterns in complex terrain at 30 arc sec. resolution. E.g. dry mountain valleys and wet mountain slopes.
- The combined approach of mechanistical + statistical downscaling of GCMs allows to apply the algorithm to future and past climatic scenarios.
- Better suited for species distribution modelling and ecological applicaiton than previous high resolution products.
Chelsa is especially built for applications in ecological, agricultural, and meterological studies which rely on very high spatial resolution data. The first validation results in show that including orographic precipitation effects can improve existing climatologies and reanalysis to a degree that the derived analysis (such as species distribution models, SDMs) show increasing accuracies. While CHELSA is an improvement over existing very high-resolution climatologies, it still exhibits errors which have been quantified in several ways (see Karger et al. 2017, Sci. Dat.). The validation of the main correction step in the precipitation algorithm that includes the orographic wind effects and boundary layer shows that the precipitation at the stations is better captured after the correction than before the downscaling to 30 arc sec resolution. The improvement varies by region and month with the majority of months showing an improvement, but also reducitions (increased noise) can occur. Most importantly, the better prediction with regard to SDMs in which precipitation and temperature data are used already indicates that CHELSA might be a substantial improvement over existing products which are currently being employed for such purposes.
All CHELSA products are in a geographic coordinate system referenced to the WGS 84 horizontal datum, with the horizontal coordinates expressed in decimal degrees. The CHELSA layer extents (minimum and maximum latitude and longitude) are a result of the coordinate system inherited from the 1-arc-second GMTED2010 data which itself inherited the grid extent from the 1-arc-second SRTM data.
Note that because of the pixel center referencing of the input GMTED2010 data the full extent of each CHELSA grid as defined by the outside edges of the pixels differs from an integer value of latitude or longitude by 0.000138888888 degree (or 1/2 arc-second). Users of products based on the legacy GTOPO30 product should note that the coordinate referencing of CHELSA (and GMTED2010) and GTOPO30 are not the same. In GTOPO30, the integer lines of latitude and longitude fall directly on the edges of a 30-arc-second pixel. Thus, when overlaying CHELSA with products based on GTOPO30 a slight shift of 1/2 arc-second will be observed between the edges of corresponding 30-arc-second pixels.
Areas just west of the dateline in Siberia are missing due to a bug in the code.
The dataset is in GEOtiff format.
Grid extent:
Resolution (decimal degrees): 0.0083333333
West extent (minimum X-coordinate, longitude): −180.0001388888
South extent (minimum Y-coordinate, latitude): −90.0001388888
East extent (maximum X-coordinate, longitude): 179.9998611111
North extent (maximum Y-coordinate, latitude): 83.9998611111
Rows: 20,800
Columns: 43,200
##
Cite this page
Acknowledgement of any material taken from or knowledge gained from this page is appreciated:
Karger, Dirk & National Center for Atmospheric Research Staff (Eds). Last modified "The Climate Data Guide: CHELSA high-resolution land surface temperature and precipitation.” Retrieved from https://climatedataguide.ucar.edu/climate-data/chelsa-high-resolution-land-surface-temperature-and-precipitation on 2026-06-22.
Citation of datasets is separate and should be done according to the data providers' instructions. If known to us, data citation instructions are given in the Data Access section, above.
Acknowledgement of the Climate Data Guide project is also appreciated:
Schneider, D. P., C. Deser, J. Fasullo, and K. E. Trenberth, 2013: Climate Data Guide Spurs Discovery and Understanding. Eos Trans. AGU, 94, 121–122, https://doi.org/10.1002/2013eo130001
Key Figures
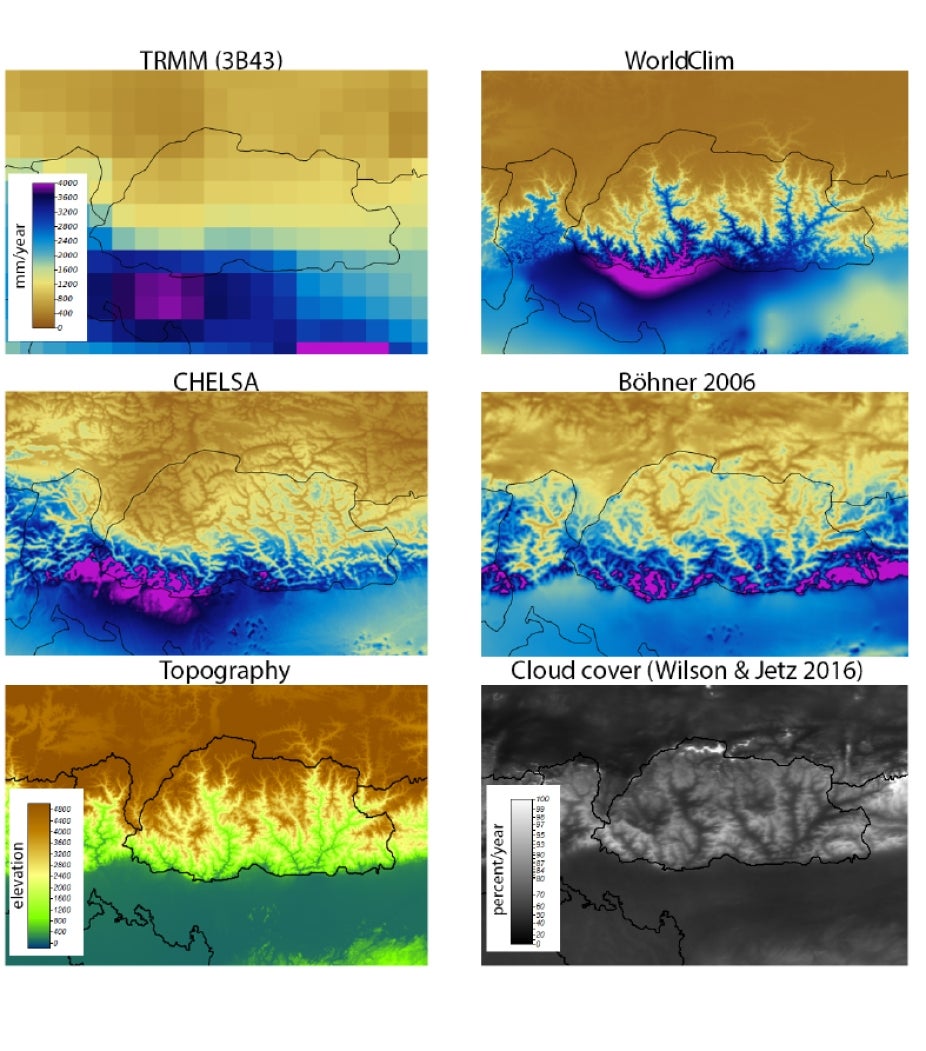
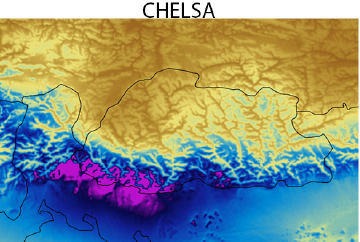
Comparison of precipitation patterns in the complex terrain of Bhutan (country boundaries in black) between TRMM/TMPA (3B43)53, WorldClim, CHELSA, a statistical downscaling, the topography from GMTED201029, and MODIS cloud cover. Figure from Karger et al. 2017, Sci. Dat. (contributed by D Karger)
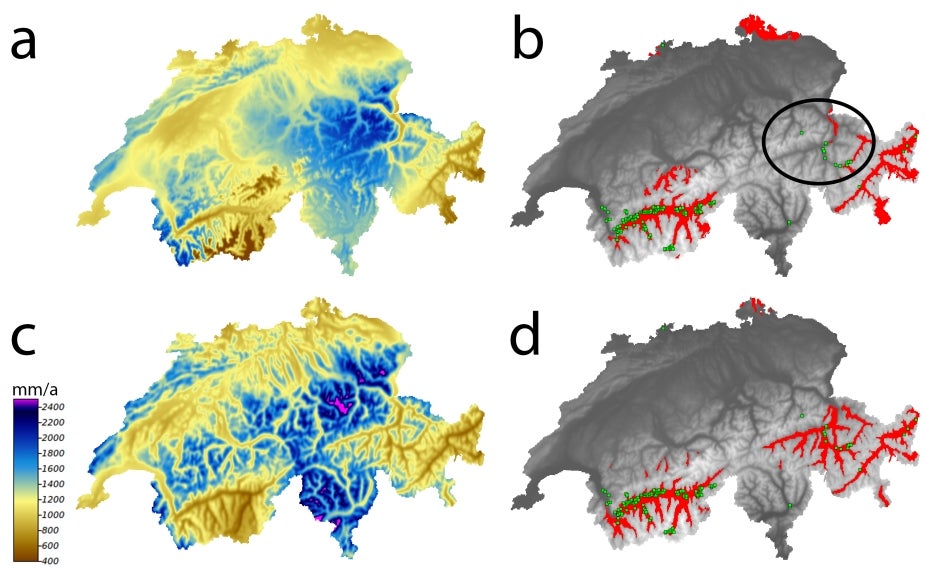
Comparison of species distribution models based and climate data from WorldClim and CHELSA of Astragalus monspessulanus for Switzerland. Figure from Karger et al. 2017, Sci. Dat. (contributed by D Karger)