Daymet: Daily Surface Weather and Climatological Summaries

Daymet provides long-term, continuous, gridded estimates of daily weather and climatology variables by interpolating and extrapolating ground-based observations through statistical modeling techniques. The Daymet data products provide driver data for biogeochemical terrestrial modeling and have myriad applications in many Earth science, natural resource, biodiversity, and agricultural research areas.
Daymet weather variables include daily minimum and maximum temperature, precipitation, vapor pressure, shortwave radiation, snow water equivalent, and day length produced on a 1 km x 1 km gridded surface over continental North America and Hawaii from 1980 and over Puerto Rico from 1950 through the end of the most recent full calendar year.
Daymet is sometimes compared with NLDAS and PRISM (see links in "Related pages" sidebar); NOAA's nCLIMGRID datasets may also be of interest to users looking for long timeseries of gridded meteorological variables at high-resolution.
Key Strengths
High spatial resolution, wide selection of variables, regular updates over 1980-present are a unique set of attributes
Three-dimensional spatial regressions with objective weighting functions to estimate vertical and horizontal gradients in temperature and precipitation.
Detailed and rigorous reporting of estimation error for temperature and precipitation based on cross-validation analysis, as a standard component of the published datasets.
Key Limitations
Empirical relationships for humidity estimation in arid environments produce biases related to climate zone (hot or cold arid zones, differences in seasonal precipitation maxima).
Network density can’t resolve patchy daily precipitation patterns at high latitudes.
While it includes the variables needed to drive biogeochemical/terrestrial models, it does not include all of the variables needed to drive full land surface models (see NLDAS). See Expert Guidance section for more strengths and limitations.
- Daymet homepage
- Daymet: Daily Surface Weather Data on a 1-km Grid for North America, Version 4 R1
- Daymet: Annual Climate Summaries on a 1-km Grid for North America, Version 4 R1
- Daymet: Monthly Climate Summaries on a 1-km Grid for North America, Version 4 R1
- Daymet: Station-Level Inputs and Cross-Validation for North America, Version 4 R1
- Daymet Version 4 Monthly Latency: Daily Surface Weather Data
Expert Developer Guidance
The following was contributed by Peter Thornton, July, 2023:
Daymet provides long-term, continuous, gridded estimates of daily weather and climatology variables by interpolating and extrapolating ground-based observations through statistical modeling techniques. The Daymet data products provide driver data for biogeochemical terrestrial modeling and have myriad applications in many Earth science, natural resource, biodiversity, and agricultural research areas. Daymet weather variables include daily minimum and maximum temperature, precipitation, vapor pressure, shortwave radiation, snow water equivalent, and day length produced on a 1 km x 1 km gridded surface over continental North America and Hawaii from 1980 and over Puerto Rico from 1950 through the end of the most recent full calendar year.
The Daymet approach to estimating daily surface weather parameters at locations lacking instrumentation is based on a combination of interpolation and extrapolation, using inputs from multiple instrumented sites and weights for each site that reflect the spatial and temporal relationships of the estimation location to the instrumental observations. The approximate number of instrumental observations to use for each estimation is defined as a parameter for each of the primary Daymet variables. As part of a series of algorithm modifications intended to improve robustness in regions of very low station density, the Daymet V4 algorithm drops the iterative station density calculation and instead defines a search radius for each estimation location which is sized to capture exactly the average number of input stations, based on pre-calculated arrays of station distances. Given the pre-processed input station observations and the pre-calculated station lists and interpolation weights for each location in the estimation grid, two separate workflows are used to produce the primary Daymet output variables: one for the daily temperature variables (Tmax and Tmin) and another for the daily precipitation variable (Prcp).
In addition to daily maximum and minimum temperature and daily total precipitation, the Daymet data record includes estimates of other important surface weather quantities that are not routinely observed, or are available as observations from only a small fraction of the temperature and precipitation observing stations. These secondary output variables are daily total shortwave radiation (Srad), daily average water vapor pressure (VP), duration of the daylight period (daylength), and a simple estimate of accumulated snowpack, measured as snowpack water equivalent (SWE). The daylength estimate is based on geographic location and time of year. Estimates for the other secondary variables (Srad, VP, and SWE) are derived from the primary temperature and precipitation variables on the basis of theory and empirical relationships, as further described in Thornton et al. 2021.
What are the main strengths and limitations of Daymet?
Strengths
- Three-dimensional spatial regressions with objective weighting functions to estimate vertical and horizontal gradients in temperature and precipitation.
- Data-driven analysis of spatial gradients in the interpolation and extrapolation process.
- Objective joint estimation of daily precipitation occurrence and intensity.
- Detailed and rigorous reporting of estimation error for temperature and precipitation based on cross-validation analysis, as a standard component of the published datasets.
- Identification and correction of network data biases, including biases related to sensor replacement, and biases related to different time of day for 24-hour reporting among networks and stations.
- Established methods for estimating radiation and humidity from daily temperature and precipitation.
- Robust and flexible data access methods to suit many different use cases.
- Annual updates provided with archive-quality station level inputs
- Standardized and compliant data formats
- Standard and specialized data access methods
Limitations
- Empirical relationships for humidity estimation in arid environments produce biases related to climate zone (hot or cold arid zones, differences in seasonal precipitation maxima). Currently under investigation.
- Network density can’t resolve patchy daily precipitation patterns at high latitudes.
- Daily precipitation product not making use of potentially valuable information from radar networks.
- Network data availability varies over time, especially for stations in Mexico.
- Sparse station networks in sparsely populated or unavailable networks.
What are the input observational data networks? Does Daymet emphasize spatial relationships more than temporal homogeneity?
Input observational data network is provided by the NCEI Global Historical Climate Network daily (GHCNd) data.
Menne, M.J., I. Durre, R.S. Vose, B.E. Gleason, and T.G. Houston, 2012: An overview of the Global Historical Climatology Network-Daily Database. Journal of Atmospheric and Oceanic Technology, 29, 897-910, doi.10.1175/JTECH-D-11-00103.1.
Durre I., M. J. B.E. Gleason, T. G. Houston, and R. S. Vose, 2010: Comprehensive automated quality assurance of daily surface observations. Journal of Applied Meteorology and Climatology., 49, 1615-1633, doi.10.1175/2010JAMC2375.1.
Durre, I., M.J. Menne, and R.S. Vose, 2008: Strategies for evaluating quality assurance procedures. Journal of Applied Meteorology and Climatology, 47, 1785–1791, doi: 10.1175/2007JAMC1706.1
Spatial relationships and temporal homogeneity: The Daymet methods are designed to assess both spatial and temporal variability in temperature and precipitation patterns based on network observations. Changes in instrumentation at individual stations and differences in protocols among station networks can introduce error in these assessments. As described in Thornton et al. (2021), Daymet uses cross-validation and network analysis to identify the most significant temporal and spatial data inhomogeneities, and uses available station metadata and independent data sources to correct for these inhomogeneities where possible.
Are there some regions or terrain types over which Daymet performs particularly well?
As with any similar methodology that relies heavily on observations made in a sparse station network, there is a direct relationship between spatial network density and quality of Daymet estimated surface weather fields at uninstrumented locations. The cross-validation results provided with each Daymet data release make these relationships explicit and quantitative, so users can make their own assessments of where and when the Daymet data are of a suitable quality for their specific application. Cross-validation errors are lowest over the densely-instrumented regions in the eastern US, for example. The existence of numerous high-quality stations in the central US Rocky Mountain region gives relatively low cross-validation errors, when compared to remote and sparsely-instrumented mountain regions in Canada and Alaska. The joint estimation of vertical and horizontal gradients central to Daymet interpolation and extrapolation methods provides resolution of local horizontal gradients in temperature associated with urban areas and with large bodies of water.
Does it satisfy use cases that other datasets, like high-resolution reanalysis, or other gridded observational climatologies, do not?
Daymet’s spatial resolution, selection of variables, regular updates, and multiple modes of easy data access, as well as the delivery of rigorous cross-validation information with each data release, are a unique set of characteristics. The number and diversity of studies using Daymet speak to the actual usefulness of the dataset, given multiple alternative reanalysis and gridded climatology datasets to choose from.##
Cite this page
Acknowledgement of any material taken from or knowledge gained from this page is appreciated:
Thornton, Peter E & National Center for Atmospheric Research Staff (Eds). Last modified "The Climate Data Guide: Daymet: Daily Surface Weather and Climatological Summaries.” Retrieved from https://climatedataguide.ucar.edu/climate-data/daymet-daily-surface-weather-and-climatological-summaries on 2026-02-20.
Citation of datasets is separate and should be done according to the data providers' instructions. If known to us, data citation instructions are given in the Data Access section, above.
Acknowledgement of the Climate Data Guide project is also appreciated:
Schneider, D. P., C. Deser, J. Fasullo, and K. E. Trenberth, 2013: Climate Data Guide Spurs Discovery and Understanding. Eos Trans. AGU, 94, 121–122, https://doi.org/10.1002/2013eo130001
Key Figures
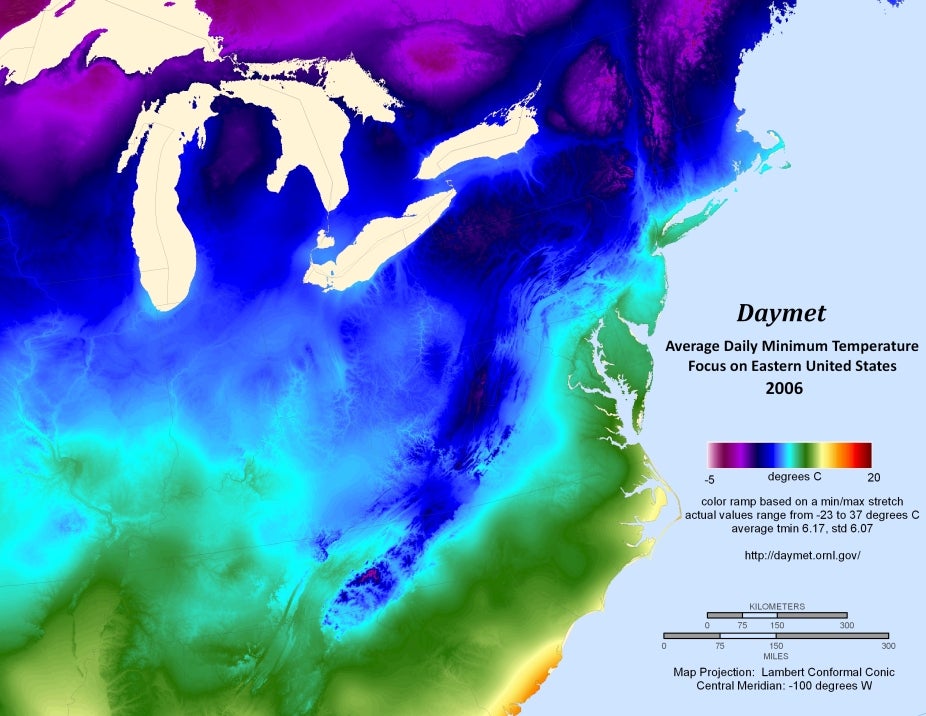
Daymet Version 4 annual climatology of average daily minimum temperature for 2006 with a focus on the Eastern United States. (credit: Michele Thornton)
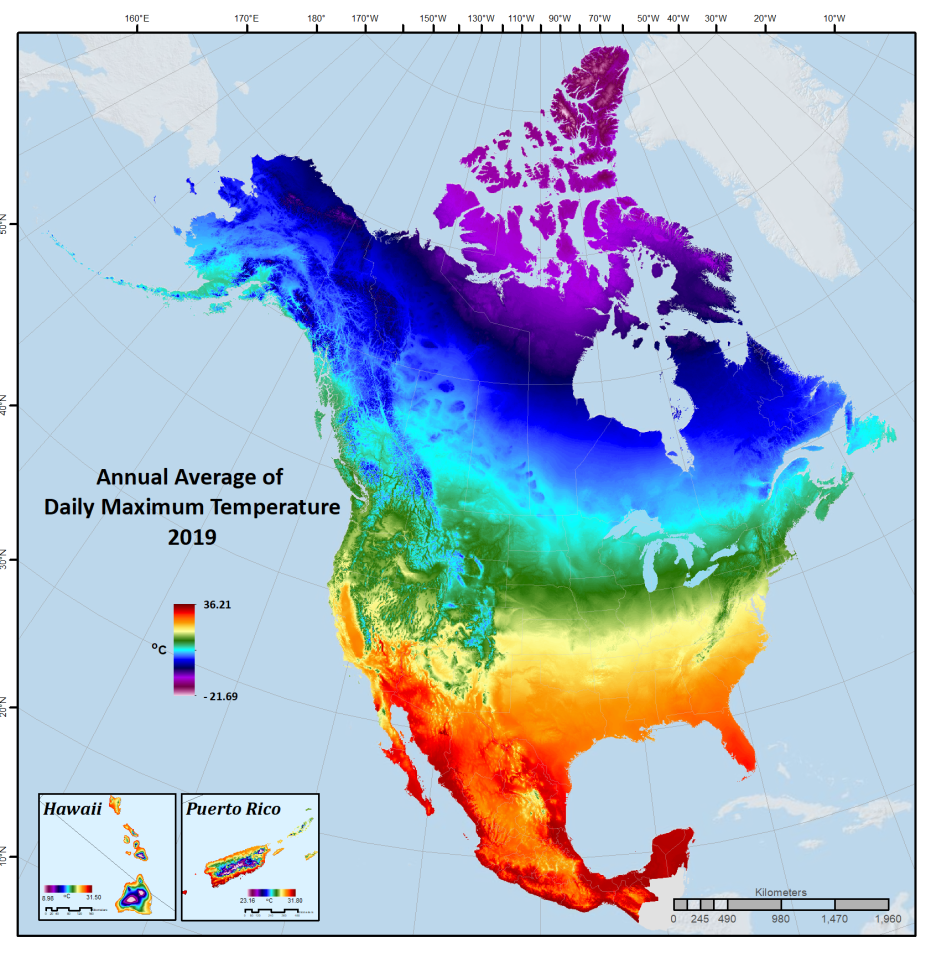
Annual climatology derived from Daymet Version 4 data. Image shows the annual average of Daily Maximum Temperature for 2019 over the Daymet spatial domain including North America, Hawaii and Puerto Rico. Contributed by Michele Thornton.
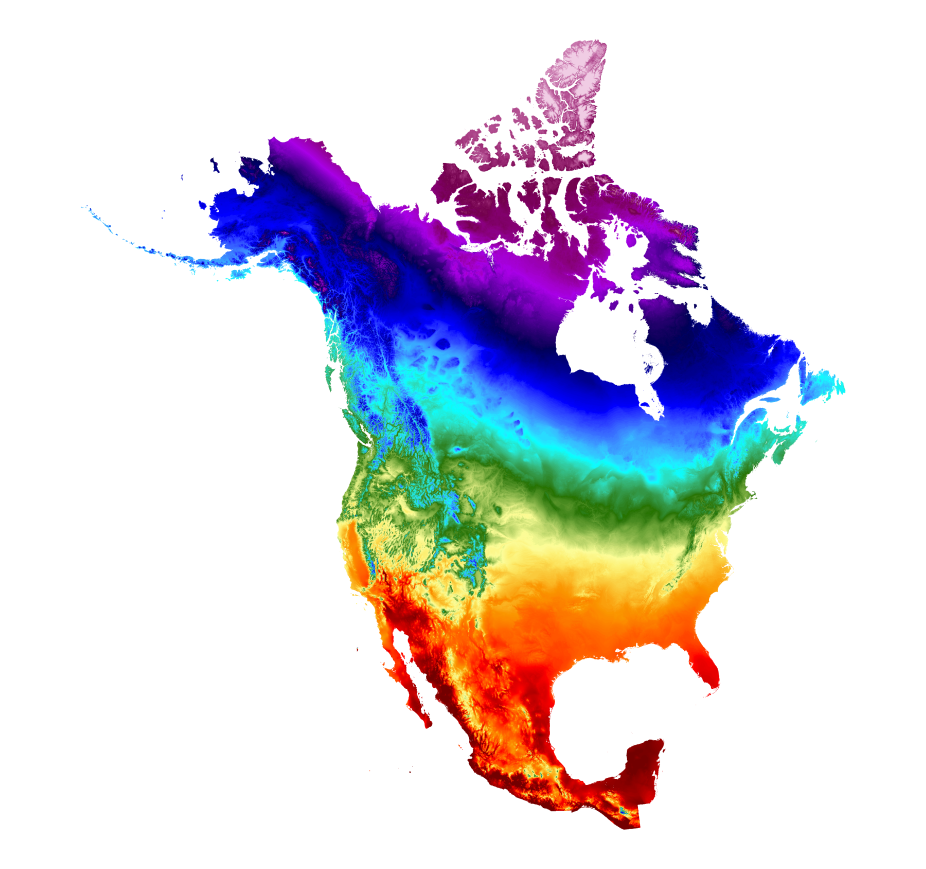
Daymet V3 annual average of daily maximum temperature for 1980, the start year of the temporal range of Daymet V3 North American data. (credit: Michele Thornton)
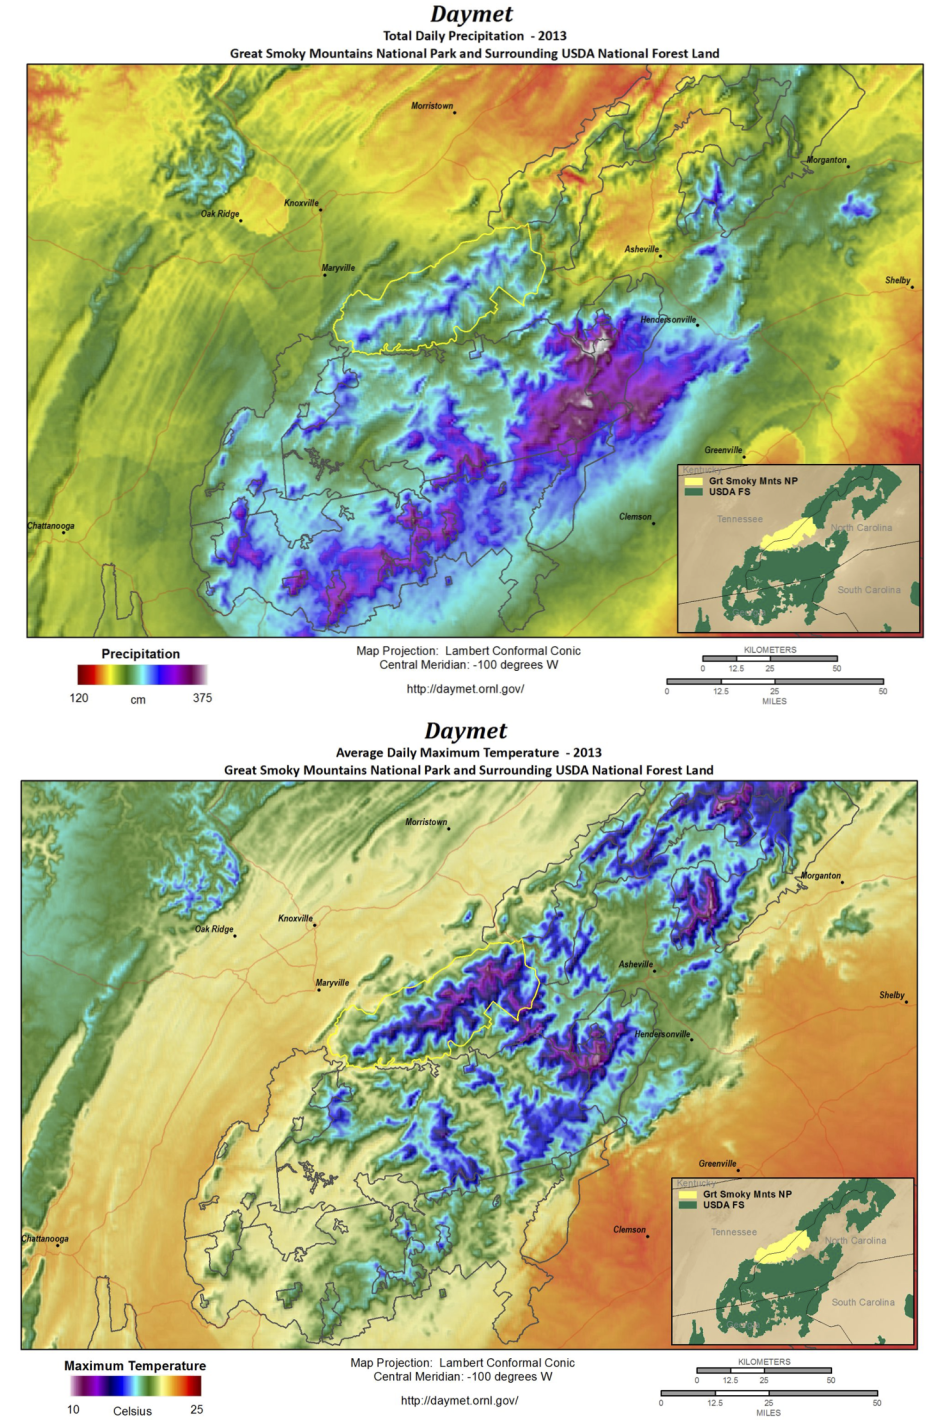
Annual climatologies based on Daymet V3 data showing the vicinity of and boundaries including the Great Smoky Mountains Nation Park and surrounding USDA Forest Service. Climatologies are derived from Daily daily files and show Total Daily Precipitation (top) and Average Daily Maximum Temperature (bottom) for 2013. (contributed by Michele Thornton)
Other Information
- Thornton, P. E., R. Shrestha, M. Thornton, S.-C. Kao, Y. Wei, and B. E. Wilson. 2021. Gridded daily weather data for North America with comprehensive uncertainty quantification. Scientific Data 8. https://doi.org/10.1038/s41597-021-00973-0
- Thornton PE, Running SW, White MA. (1997): Generating surfaces of daily meteorological variables over large regions of complex terrain. Journal of Hydrology . 214 - 251.