Sea Ice Concentration Climate Data Record from OSI SAF

The Ocean and Sea Ice Satellite Applications Facility (OSI SAF) of EUMETSAT provides sea ice concentration products for the Arctic and Antarctic based on satellite passive microwave data. The concentration value is expressed as the fractional percentage of the ice cover in a given grid cell.
Since 2023, OSI-450-a and OSI-430-a constitute the third fully reprocessed version of the OSI SAF Global Sea Ice Concentration Climate Data Records (Lavergne et al., 2023; Lavergne et al., 2019):
● OSI-450-a is a fixed-length Climate Data Record (CDR) derived from SMMR, SSM/I, and SSMIS and covers the period from 1978 to 2020.
● OSI-430-a is the Interim CDR (ICDR) derived from SSMIS and provides a timely extension of OSI-450-a starting from January 2021.
The major reasons for using OSI-450-a & OSI-430-a instead of using some of the other (sometimes higher resolution) data sets are the long and stable timeseries from 1978 to present, and the low uncertainties.
The ICDR OSI-430-a has two data streams: 1) the “nominal” ICDR that applies exactly the same algorithm as OSI-450-a and has a latency of 16 days, and 2) the “fast-track” ICDR that applies a slightly different algorithm (tie-point selection) and achieves a latency of 2 days. The fast-track ICDR was introduced for the third release after requests from operational climate users. The OSI-450-a and OSI-430-a come both as a daily product and a monthly average product. Note, that OSI-450-a and OSI-430-a fully replace the previous v2.0 products, OSI-450 and OSI-430-b, which are no longer supported as of June 2023.
The sea-ice concentration algorithm is a hybrid algorithm, which combines two distinct ice-concentration algorithms. One algorithm is specifically optimized for open-water and low-concentration conditions (with heritage to the Bootstrap algorithm), while the other is designed for closed-ice and high-concentration conditions (with heritage to the Bristol algorithm). The algorithm’s fundamental principle remains the same as for the previous version 2.0, incorporating state-of-the-art algorithms, atmospheric correction of the passive microwave brightness temperatures using re-analysis data, dynamic tie-points, and uncertainty computation. The main improvements for v3.0 involve the use of new input data, specifically the recently incorporated new FCDR data alongside ERA5 fields. The data coverage was extended prior to 1979 and beyond 2015. Other improvements include the improvement of a land spill-over correction, a more precise selection of open-water tie-points closer to the ice edge, a refined selection of sea-ice tie-points to mitigate the biases, an updated land-water climatology, and an improved gap-filling for the polar observation hole (especially for the SMMR period).
Key Strengths
Long-term, daily time series of sea ice concentration in the Arctic and Antarctic, updated on a daily basis with a delay of 16 days (nominal latency) and 2 days (fast-track latency).
Uses dynamic tie points adjusted to typical brightness temperatures of ice and open water; this accounts for satellite drift and inter-satellite calibration issues, as well as seasonal and interannual variations of the tie-points.
Uncertainties are provided for each grid cell, both the total uncertainty and its two main components.
Key Limitations
The concentration fields are presented at 25km grid spacing. However, the true spatial resolution is coarser.
Sea-ice concentration algorithms based on the passive microwave channels around 19GHz, 37GHz, and 90GHz are very sensitive to surface melt and melt-pond water on top of the ice. The uncertainty variables in the OSI SAF CDRs are therefore larger during the summer melt seasons
Interpolation of missing values & periods with no product. The CDRs provide interpolated sea-ice concentration values in places where original input satellite data was missing, aiming at the most complete daily maps. Both temporal and spatial interpolation is used. The locations where interpolation was used are clearly identified in the status flag, and these interpolated values should generally be used with caution for scientific applications. See the Expert Guidance section, below, for a more complete list of Strengths and Limitations.
[OSI-450-a]
EUMETSAT Ocean and Sea Ice Satellite Application Facility, Global sea ice concentration climate data record 1978-2020 (v3.0, 2022), OSI-450-a, doi:10.15770/EUM_SAF_OSI_0013
[OSI-430-a]
EUMETSAT Ocean and Sea Ice Satellite Application Facility, Global sea ice concentration interim climate data record (v3.0, 2022), OSI-430-a, doi:10.15770/EUM_SAF_OSI_0014
For more guidelines, please consult the product webpages https://osi-saf.eumetsat.int/products/osi-450-a and https://osi-saf.eumetsat.int/products/osi-430-a,
or the Product User Manual (PUM, 2023 in the references).
Each data file contains six variables:
● Main (filtered) sea ice concentration (range 0-100%). Fraction of the area of the grid cell containing sea ice.
● Raw sea ice concentration values (range <0% to >100%). Original ("raw") estimates of sea ice concentration produced by the algorithm before the application of various processing filters and thresholds (these filters are recorded in the "status flag" variable).
● Total uncertainty (range 0-100%). Total uncertainty (one standard deviation) of sea ice concentration values. It is the combination (square root of the sum of variances) of the smearing uncertainty and algorithm uncertainty.
● Smearing uncertainty (range 0-100%). Uncertainty (one standard deviation) of sea ice concentration values due to resampling to a grid where the sensor footprint covers more than one pixel.
● Algorithm uncertainty (range 0-100%). Inherent uncertainty (one standard deviation) of sea ice concentration values related to the algorithm used to convert brightness temperatures to ice concentrations. Sources contributing to this type of uncertainty include (among others) sensor noise, atmospheric noise, and variability in ice surface emissivity.
● status flag (bit coded with range 0 to 255). Flag provides information about the processing filters applied to the raw sea ice concentration values to obtain the final estimates of sea ice concentration. Examples of such filters include the open-water filter, the maximum sea ice climatology, spatial interpolation, or temporal interpolation.
Coverage, spatial and temporal resolution:
The product covers the Northern and Southern Hemisphere and is provided on an EASE2 grid with 25 km x 25 km grid resolution.
For most of the data set, the product is daily. Note, the every-second-day coverage in the SMMR period:
1978-10-25 - 1978-11-15 : daily
1978-11-15 - 1987-07-09 : every second day
after 1987-07-09 daily
Some dates are missing in the product due to a lack of satellite data. For a full list of missing dates, see the Product User Manual (PUM, 2023).
More information is available in the product documentation and publications linked below in References.
This sea ice concentration CDRs product benefited from research and development work in the ESA CCI project. It is noteworthy that ESA CCI+ is also producing their own sea-ice concentration dataset, that are complementary to those of the OSI SAF (see https://climate.esa.int/en/news-events/satellite-sea-ice-record-made-sharper ).
Expert Developer Guidance
The following was contributed by Signe Aaboe and Thomas Lavergne, May, 2023:
What are the key strengths of this data set?
○ Long-term, daily time series of sea ice concentration in the Arctic and Antarctic, updated on a daily basis with a delay of 16 days (nominal latency) and 2 days (fast-track latency).
○ Uses dynamic tie points adjusted to typical brightness temperatures of ice and open water; this accounts for satellite drift and inter-satellite calibration issues, as well as seasonal and interannual variations of the tie-points.
○ Corrections are applied for weather effects (water vapor, cloud liquid water and surface roughness) on the passive microwave signals
○ Uncertainties are provided for each grid cell, both the total uncertainty and its two main components.
○ The polar observation hole in the Arctic is interpolated with an advanced gap-filling algorithm.
○ The CDR is based on a timeseries of quality-controlled, intercalibrated microwave brightness temperatures: a Fundamental Climate Data Record (FCDR).
What are the key limitations of this data set?
○ Removal of true ice by the open water filters.
The open water filter is efficient at detecting and removing weather-induced noise over open water, however, it is also known to remove some amount of true low-concentration ice, especially in the marginal ice zone.
○ Summer melt and melt-ponding.
Sea-ice concentration algorithms based on the passive microwave channels around 19GHz, 37GHz, and 90GHz are very sensitive to surface melt and melt-pond water on top of the ice. The uncertainty variables in the OSI SAF CDRs are therefore larger during the summer melt seasons, even though the misinterpretation of meltwater as open water is not explicitly included in the uncertainty propagation.
○ Interpolation of missing values & periods with no product.
The CDRs provide interpolated sea-ice concentration values in places where original input satellite data was missing, aiming at the most complete daily maps. Both temporal and spatial interpolation is used. The locations where interpolation was used are clearly identified in the status flag, and these interpolated values should generally be used with caution for scientific applications, especially the values obtained from spatial interpolation.
Some dates are missing due to a lack of satellite data (not possible to interpolate). For a full list of missing dates, see the Product User Manual (PUM, 2023).
○ Grid resolution
The concentration fields are presented at 25km grid spacing. However, the true spatial resolution is coarser. For instance, the footprint of the SSM/I channels used in the product is 43x69km at the 19GHz channel and 28x37km at the 37GHz channel.
○ Coastal regions
Due to the large footprints, the emissivity of land may interfere with the characteristics of the sea ice in coastal regions. As the radiometric properties of land are similar to those of sea ice, the land signature in coastal open-water areas is “spilling over” and wrongly classified as ice. The land-spill-over correction procedure has been improved in CDR v3.0 but coastal artifacts remain.
What are the typical research applications of this data set? What are examples from your work?
○ Climate models, NWP and Ocean/Ice re-analyses, environmental agencies
○ Computation of the sea-ice indexes and climatological maps. Ex. OSI SAF sea-ice index (OSI-420) is computed from OSI SAF sea-ice concentration CDRs.
What are some common mistakes that users encounter when processing or interpreting these data?
○ False ice in the coastal regions.
○ Interpolation artifacts in case of missing data.
What are the likely spurious (non-climatic) features, if any, of timeseries derived from these data?
○ Bad gap-filling. We try to correct for these but some cases may still appear in the data, especially in the SMMR period with larger gaps to fill.
Were corrections made to account for changes in observing systems or practices, sampling density, satellite drift, or similar issues?
○ The input data to this CDR is a Fundamental Climate Data Record (FCDR) where inter-satellite calibration offsets were corrected. In addition, the dynamic tie-points account for the remaining inter-sensor offsets.
What are some comparable data sets, if any? Why use this data set instead of another?
○ A shorter (2002-2020) SIC dataset based on AMSRs. Can be of interest to explore higher resolution SICs for the recent past:
OSI SAF Global medium resolution sea ice concentration climate data record from AMSR-E and AMSR-2 2002-2020 (v3.0, 2022), OSI-458, doi:10.15770/EUM_SAF_OSI_0015
○ SICCI-HR-SIC, a 30-years (1991-2020) higher resolution SIC dataset:
ESA CCI+ Global high(er) resolution sea ice concentration climate data record v3 from SSM/I and SSMIS (near-90 GHz) 1991-2020 (v3.0, 2023), doi:10.5285/eade27004395466aaa006135e1b2ad1a https://climate.esa.int/en/news-events/satellite-sea-ice-record-made-sharper
○ The SIC CDR from NOAA/NSIDC. It is based on different SIC algorithms and does not have some of the key strengths listed above:
NOAA/NSIDC Climate Data Record of Passive Microwave Sea Ice Concentration, Version 4 (G02202). Boulder, Colorado USA. National Snow and Ice Data Center. https://doi.org/10.7265/efmz-2t65.
○ A 30+ years SIC CDR based on the ASI algorithm. It has similar spatial resolution as SICCI-HR-SIC, but presents higher retrieval uncertainty:
ASI Algorithm SSMI-SSMIS sea ice concentration data, Integrated Climate Date Center (ICDC), CEN, University of Hamburg, Germany (1991-12-05 to 2023-03-31) https://www.cen.uni-hamburg.de/en/icdc/data/cryosphere/seaiceconcentration-asi-ssmi.html
○ An early-1970s SIC CDR based on the ESMR Nimbus-5 mission:
ESA Sea Ice CCI Nimbus-5 ESMR Sea Ice Concentration, version 1.0. NERC EDS Centre for Environmental Data Analysis 1972-1977 (v1.0, 2023). doi:10.5285/34a15b96f1134d9e95b9e486d74e49cf.
○ Note, that the OSI SAF sea-ice concentration CDRs v3.0 (OSI-450-a & OSI-430-a) are redistributed through other channels, e.g.:
■ Copernicus Climate Change Service (C3S) Climate Date Store https://cds.climate.copernicus.eu/ with product-specific webpage https://cds.climate.copernicus.eu/cdsapp#!/dataset/satellite-sea-ice-concentration
■ Copernicus Marine Service (CMEMS) Marine Data Store https://data.marine.copernicus.eu/, with the indicator “SEAICE_GLO_SEAICE_L4_REP_OBSERVATIONS_011_009”
In general, why use this data set (OSI-450-a and OSI-430-a) instead of another?:
○ The major reason for using OSI-450-a & OSI-430-a instead of using some of the other (sometimes higher resolution) data sets is the long and stable timeseries from 1978 to present, and the low uncertainties.
○ Climate consistent CDR
○ Regularly updated ICDR (16 days nominal latency and 2 days fast-track latency)
○ 24/7 operational service and maintenance
○ State-of-the-art algorithms benefiting from R&D in OSI SAF and from ESA CCI.
How is uncertainty characterized in these data?
○ The uncertainty is given as one standard deviation in percentage. Three maps of uncertainty information are provided in each file, the algorithm standard uncertainty, the smearing standard uncertainty, and the total standard uncertainty. The total uncertainty is the combination (the square root of the sum of variances) of the two other components of the uncertainty budget. See more details in the ATBD (2022).
○ In addition, each field is accompanied by a processing status flag which also indicates the quality of each grid value.
Can you recommend any cloud platforms and/or online plotting tools where one can visualize and interact with these data? Please point to those resources, as well as share a few figures from your own work.
○ OSI SAF webpage with quick looks for the entire dataset: https://osisaf-hl.met.no/quicklooks-1prod (select Product “ConcCDRv3”)
○ Repository for all training content associated with EUMETSAT Ocean and Sea Ice Satellite Application Facility (OSI SAF) sea-ice products https://gitlab.eumetsat.int/eumetlab/oceans/ocean-training/sensors/learn-osi-saf-sea-ice (python notebook)
○ Interactive plotting tool for the sea-ice index based on OSI SAF sea-ice concentration CDRs https://cryo.met.no/en/sea-ice-index (select “Interactive” in Index Menu)
Are there any publicly available pieces of code that illustrate how to access and analyze these data? If so, where?
○ Repository for all training content associated with EUMETSAT Ocean and Sea Ice Satellite Application Facility (OSI SAF) sea-ice products https://gitlab.eumetsat.int/eumetlab/oceans/ocean-training/sensors/learn-osi-saf-sea-ice (python notebook)
○ Monthly Sea Ice Concentration Anomalies https://github.com/TomLav/snippets/blob/main/Monthly%20Sea%20Ice%20Concentration%20Anomalies.ipynb (python notebook)
○ Read OSISAF CCI Sea Ice Concentration CDR https://github.com/TomLav/snippets/blob/main/Read%20OSISAF%20CCI%20Sea%20Ice%20Concentration%20CDR.ipynb (python notebook)
○ Prepare Monthly OSISAF SIC https://github.com/TomLav/snippets/blob/main/Prepare%20Monthly%20OSISAF%20SIC.ipynb (python notebook)
NOTE: all the software above are provided as-is to demonstrate specific use cases with the data. Please contact the author if you have questions or suggestions.
Provide a summary statement about these data and their utility for climate research and model evaluation.
The Ocean and Sea Ice Satellite Applications Facility (OSI SAF) of EUMETSAT provides sea ice concentration products for the Arctic and Antarctic based on satellite passive microwave data. The concentration value is expressed as the fractional percentage of the ice cover in a given grid cell.
Since 2023, OSI-450-a and OSI-430-a constitute the third fully reprocessed version of the OSI SAF Global Sea Ice Concentration Climate Data Records (Lavergne et al., 2023; Lavergne et al., 2019):
● OSI-450-a is a fixed-length Climate Data Record (CDR) derived from SMMR, SSM/I, and SSMIS and covers the period from 1978 to 2020.
● OSI-430-a is the Interim CDR (ICDR) derived from SSMIS and provides a timely extension of OSI-450-a starting from January 2021.
The ICDR OSI-430-a has two data streams: 1) the “nominal” ICDR that applies exactly the same algorithm as OSI-450-a and has a latency of 16 days, and 2) the “fast-track” ICDR that applies a slightly different algorithm (tie-point selection) and achieves a latency of 2 days. The fast-track ICDR was introduced for the third release after requests from operational climate users. The OSI-450-a and OSI-430-a come both as a daily product and a monthly average product. Note, that OSI-450-a and OSI-430-a fully replace the previous v2.0 products, OSI-450 and OSI-430-b, which are no longer supported as of June 2023.
The sea-ice concentration algorithm is a hybrid algorithm, which combines two distinct ice-concentration algorithms. One algorithm is specifically optimized for open-water and low-concentration conditions (with heritage to the Bootstrap algorithm), while the other is designed for closed-ice and high-concentration conditions (with heritage to the Bristol algorithm). The algorithm’s fundamental principle remains the same as for the previous version 2.0, incorporating state-of-the-art algorithms, atmospheric correction of the passive microwave brightness temperatures using re-analysis data, dynamic tie-points, and uncertainty computation. The main improvements for v3.0 involve the use of new input data, specifically the recently incorporated new FCDR data alongside ERA5 fields. The data coverage was extended prior to 1979 and beyond 2015. Other improvements include the improvement of a land spill-over correction, a more precise selection of open-water tie-points closer to the ice edge, a refined selection of sea-ice tie-points to mitigate the biases, an updated land-water climatology, and an improved gap-filling for the polar observation hole (especially for the SMMR period).
This sea ice concentration CDRs product benefited from research and development work in the ESA CCI project. It is noteworthy that ESA CCI+ is also producing their own sea-ice concentration dataset, that are complementary to those of the OSI SAF (see https://climate.esa.int/en/news-events/satellite-sea-ice-record-made-sharper ).
Cite this page
Acknowledgement of any material taken from or knowledge gained from this page is appreciated:
Aaboe, Signe &, Lavergne, Thomas & National Center for Atmospheric Research Staff (Eds). Last modified "The Climate Data Guide: Sea Ice Concentration Climate Data Record from OSI SAF.” Retrieved from https://climatedataguide.ucar.edu/climate-data/sea-ice-concentration-data-reprocessed-ssmr-ssmi-eumetsat on 2026-07-07.
Citation of datasets is separate and should be done according to the data providers' instructions. If known to us, data citation instructions are given in the Data Access section, above.
Acknowledgement of the Climate Data Guide project is also appreciated:
Schneider, D. P., C. Deser, J. Fasullo, and K. E. Trenberth, 2013: Climate Data Guide Spurs Discovery and Understanding. Eos Trans. AGU, 94, 121–122, https://doi.org/10.1002/2013eo130001
Key Figures
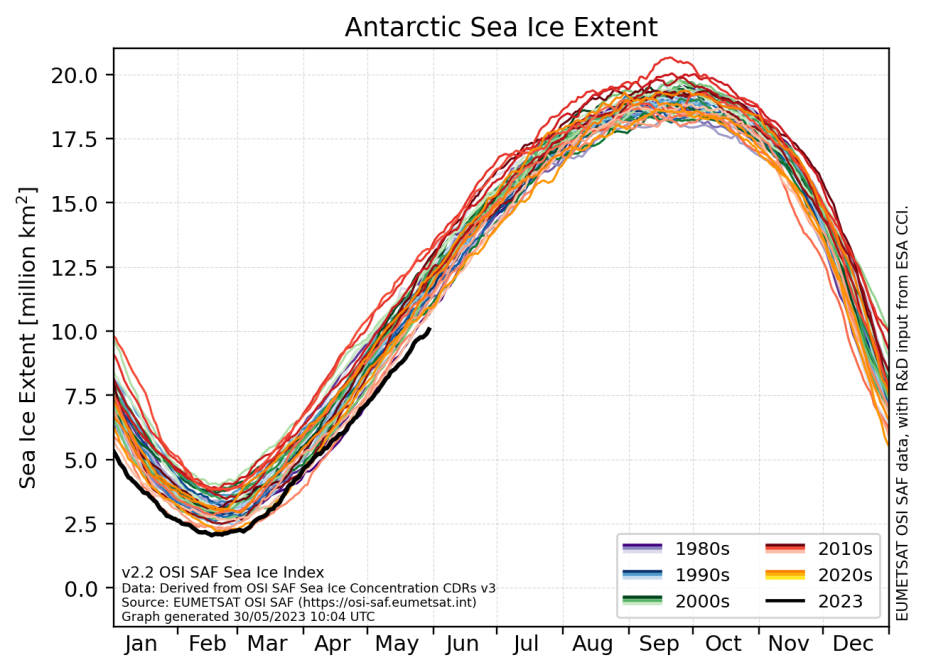
Southern Hemisphere sea-ice extent (daily) computed from sea-ice concentration CDR v3.0. (credit: Signe Aaboe and Thomas Lavergne)
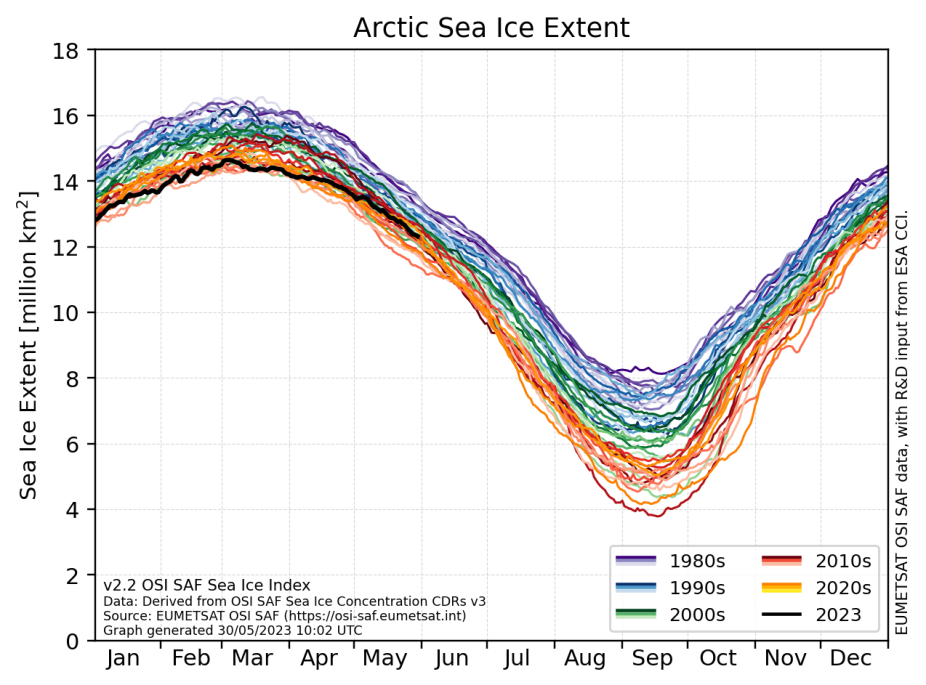
Northern Hemisphere sea-ice extent (daily) computed from sea-ice concentration CDR v3.0. (contributed by Signe Aaboe and Thomas Lavergne)
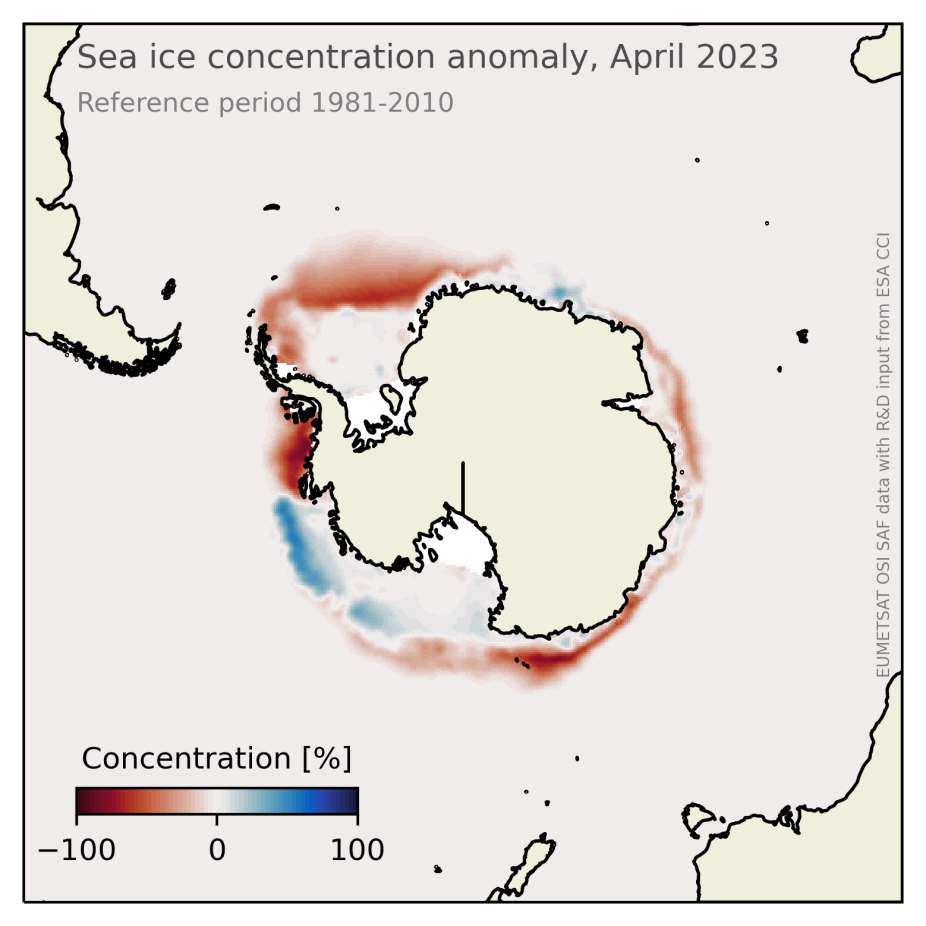
Southern Hemisphere sea-ice concentration anomaly for April 2023, relative to mean April in the reference period 1981-2010 (credit: Signe Aaboe and Thomas Lavergne)
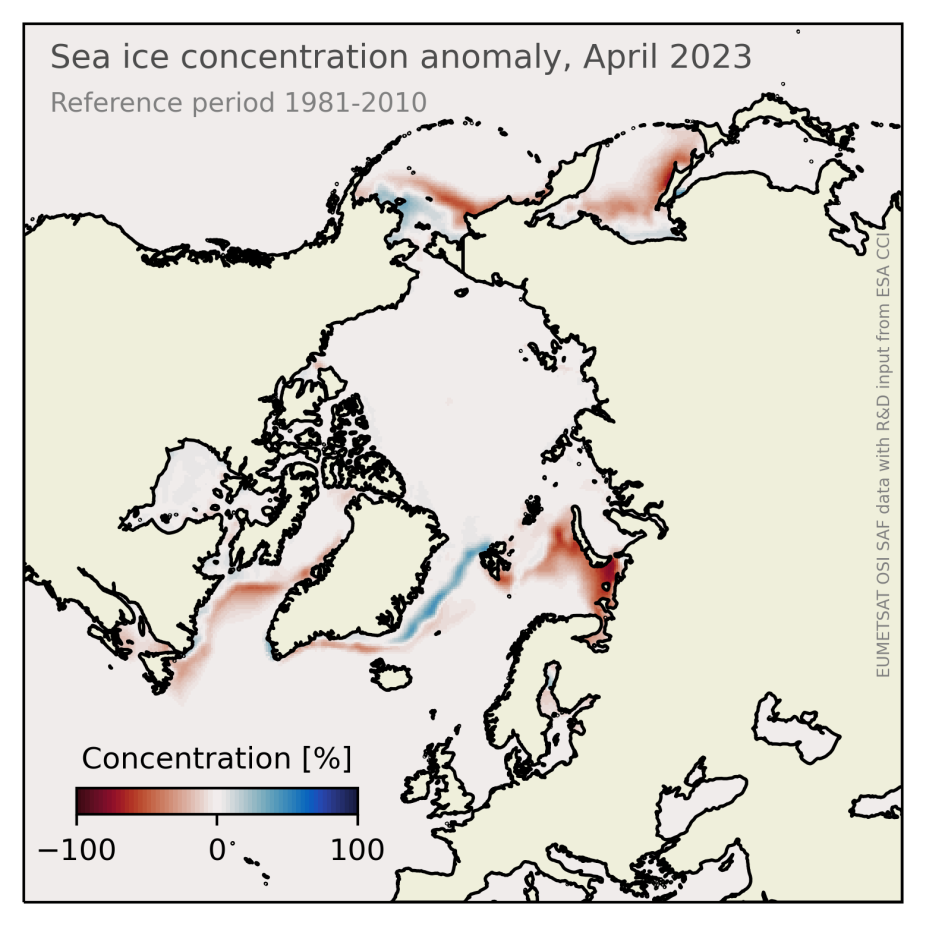
Northern Hemisphere sea-ice concentration anomaly for April 2023, relative to mean April in the reference period 1981-2010. (contributed by Signe Aaboe and Thomas Lavergne)
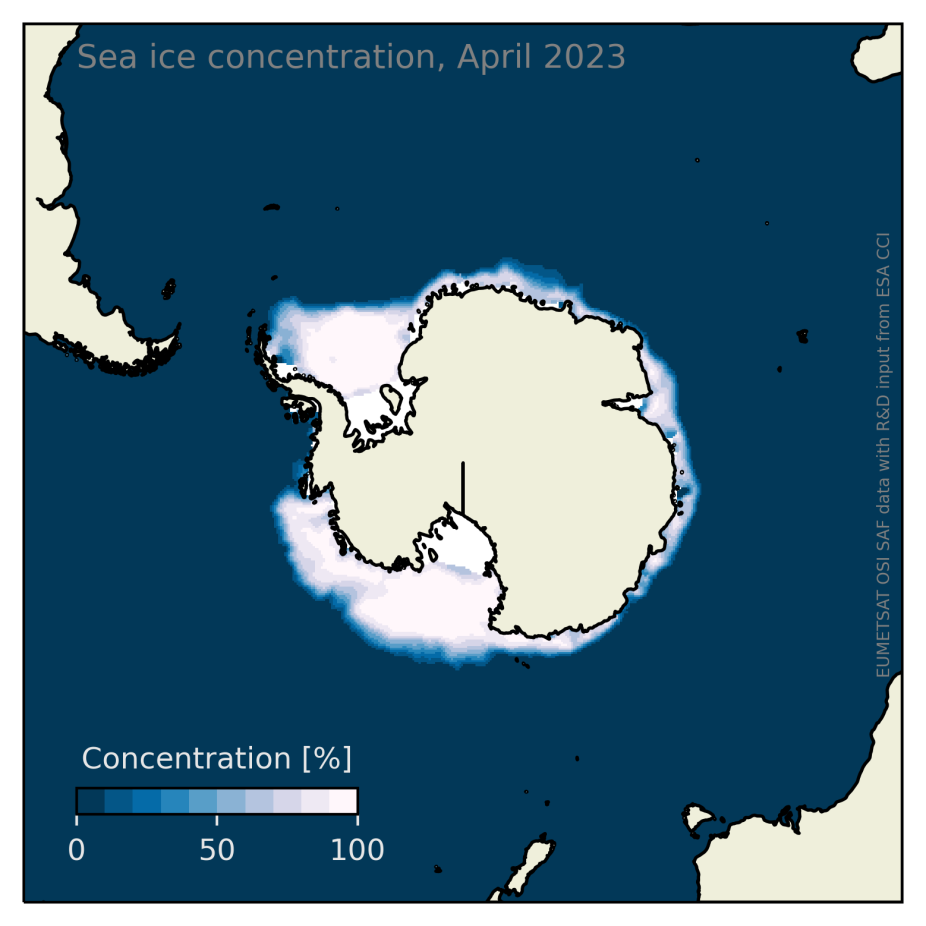
Southern Hemisphere sea-ice concentration for April 2023. (credit: Signe Aaboe and Thomas Lavergne)
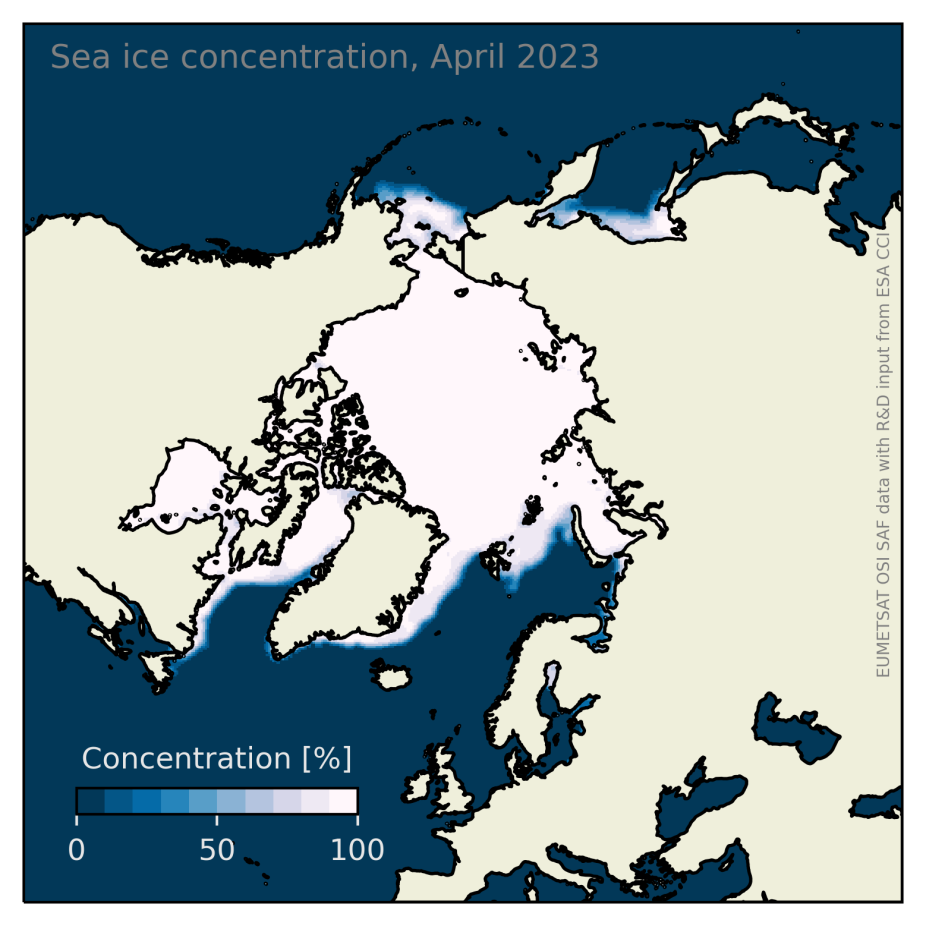
Northern Hemisphere sea-ice concentration for April 2023. (contributed by Signe Aaboe and Thomas Lavergne)
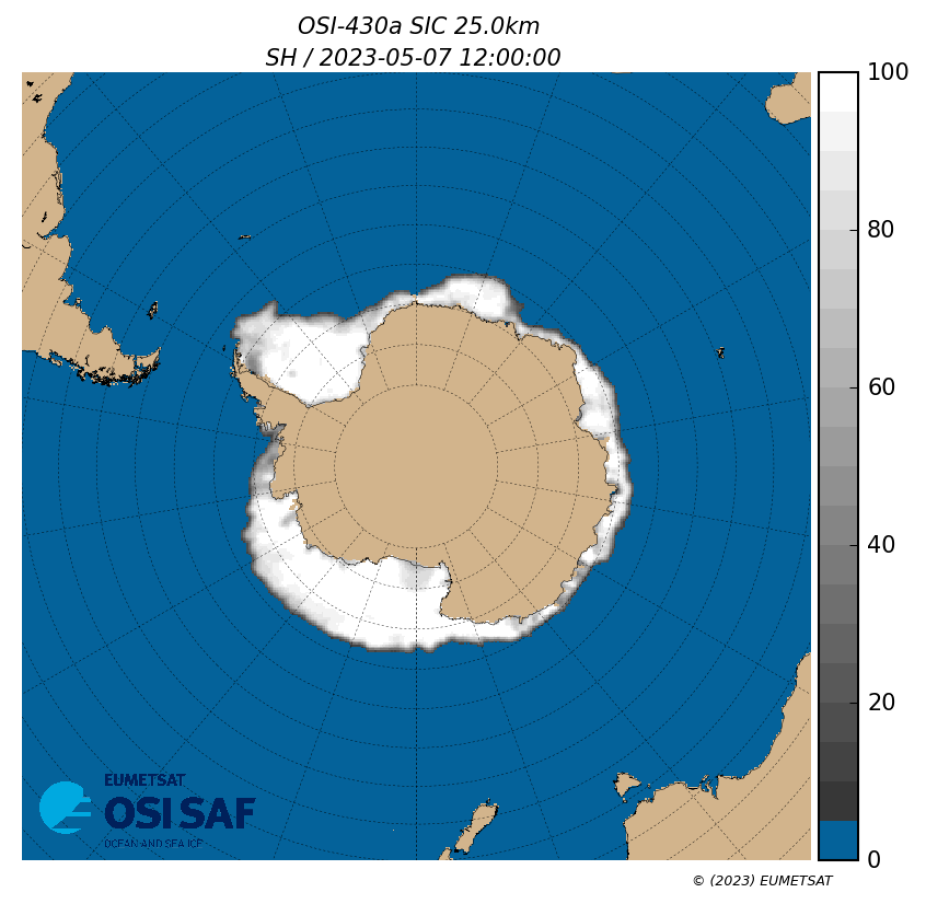
Southern Hemisphere sea-ice concentration for May 7, 2023. Standard OSI SAF quick-look daily map (https://osisaf-hl.met.no/quicklooks-1prod). (contributed by Signe Aaboe and Thomas Lavergne)
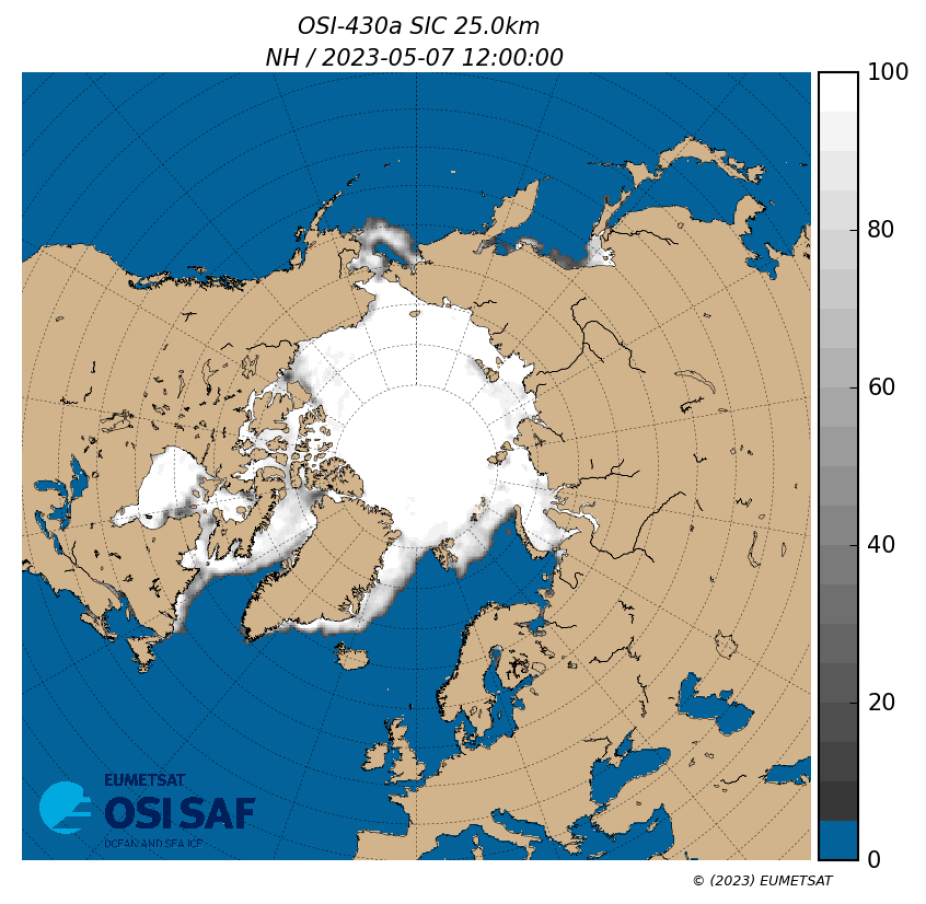
Northern Hemisphere sea-ice concentration for May 7, 2023. Standard OSI SAF quick-look daily map (https://osisaf-hl.met.no/quicklooks-1prod).(contribued by Signe Aaboe and Thomas Lavergne)
Other Information
- Andersen, S., R. Tonboe, S. Kern, and H. Schyberg (2006). Improved retrieval of sea ice total concentration from spaceborne passive microwave observations using Numerical Weather Prediction model fields: An intercomparison of nine algorithms.
- Andersen, S., R. Tonboe, L. Kaleschke, G. Heygster, and L. T. Pedersen (2007), Intercomparison of passive microwave sea ice concentration retrievals over the high-concentration Arctic sea ice, J. Geophys. Res., 112, C08004, doi:10.1029/2006JC003543.
- Lavergne, T., et al., 2019: Version 2 of the EUMETSAT OSI SAF and ESA CCI sea-ice concentration climate data records, The Cryosphere, 13, 49-78, https://doi.org/10.5194/tc-13-49-2019
- Kern, S., et al., 2019, Satellite Passive Microwave Sea-Ice concentration data set inter-comparison: Closed ice and ship-based observations, The Cryosphere, 13(12), 3261-3307, https://doi.org/10.5194/tc-13-3261-2019
- Kern, S., et al., 2020, Satellite passive microwave sea-ice concentration data set intercomparison for Arctic summer conditions, The Cryosphere, 14(7), 2469-2493, https://doi.org/10.5194/tc-14-2469-2020
- Kern, S., et al., 2022, Satellite passive microwave sea-ice concentration data set intercomparison using Landsat data, The Cryosphere, 16(1), 349-378, https://doi.org/10.5194/tc-16-349-2022
- [PUM, 2023] EUMETSAT OSI SAF Product User’s Manual for the Global Sea Ice Concentration Climate Data Records v3 (OSI-450-a, OSI-430-a, OSI-458), SAF/OSI/CDOP3/MET/TEC/MA/288, version v3.0, April 2023.
- [VALREP, 2022] EUMETSAT OSI SAF Validation Report for the Global Sea Ice Concentration Climate Data Records v3 (OSI-450-a, OSI-430-a, OSI-458), SAF/OSI/CDOP3/DMI/SCI/RP/285, version v3.0, August 2022.
- [ATBD, 2022]: EUMETSAT OSI SAF Algorithm Theoretical Baseline Document for the Global Sea Ice Concentration Climate Data Records v3 (OSI-450-a, OSI-430-a, OSI-458), SAF/OSI/CDOP3/DMI_Met/SCI/MA/270, version v3.0, August 2022.