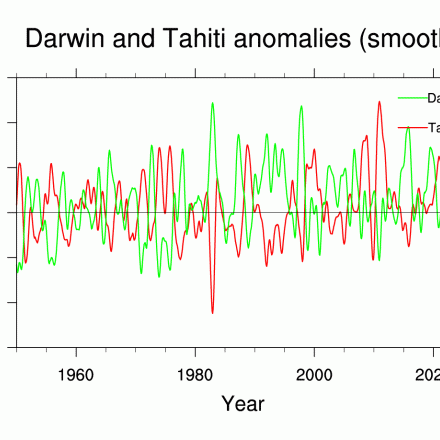
Southern Oscillation Indices: Signal, Noise and Tahiti/Darwin SLP (SOI)
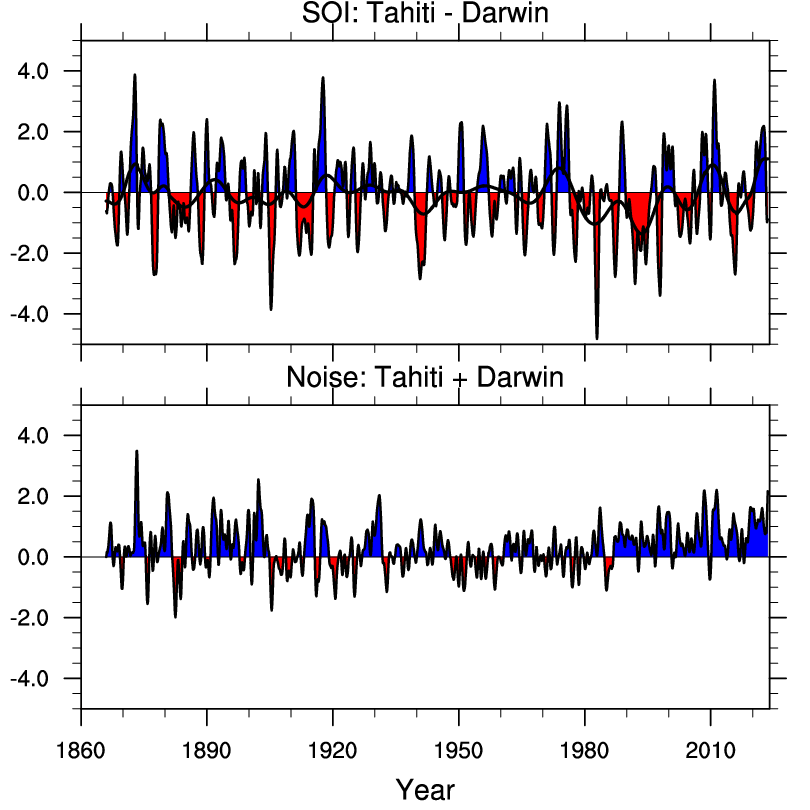
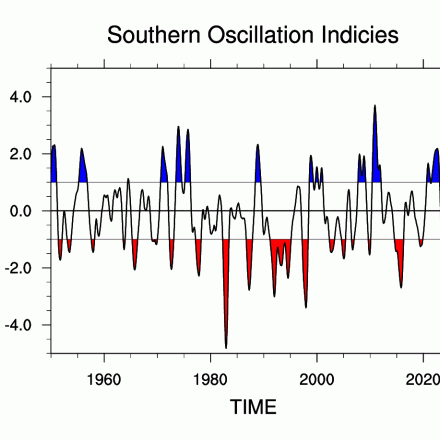
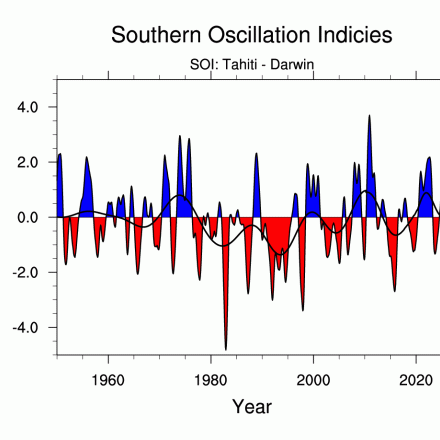
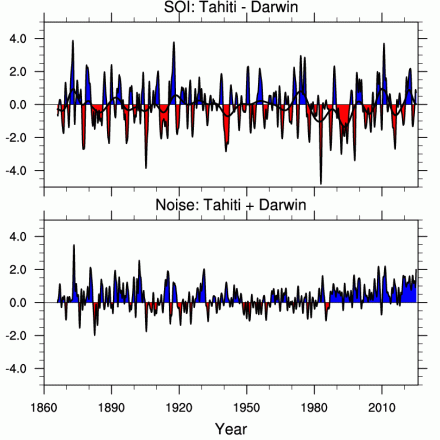
The Southern Oscillation Index (SOI) is a time series used to characterize the large scale sea level pressure (SLP) patterns in the tropical Pacific. Monthly mean SLP at Tahiti [T] and Darwin [D] are used. An optimal SOI can be constructed. It consists of [T-D] which is a measure of the large scale phenomena while [T+D] is a measure of small scale and/or transient phenomena that are not part of the large scale Southern Oscillation. The SOI is linked to large scale tropical SST variability and as such is a measure of the "SO" part of the ENSO phenomenon. Extended periods of negative SOI correspond with El Nino events, characterized by warm SSTs in the eastern and central tropical Pacific. It has a period of 2-8 years.
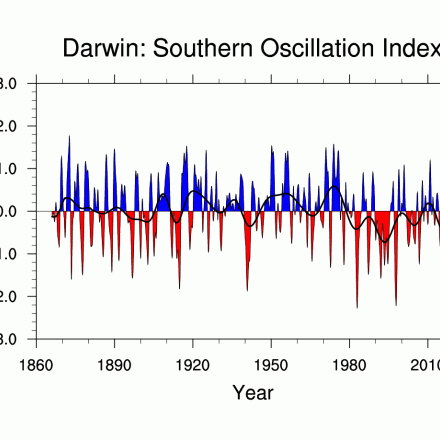
SLP values for Tahiti prior to 1935 should be viewed with appropriate caution. Ropelewski and Jones (1987) discuss the issues. It is recommended that the 'Darwin only' version of the SOI be used for very long term studies. It is highly correllated with the (Tihiti-Darwin) record. An effort to extend the SOI series to prior than 1866 is discussed by Konnen et al (1998).
Key Strengths
Simple to construct and understand
Long record. The 'Darwin only' version of the SOI is high quality and highly correlated with the (Tahiti-Darwin) full version of the SOI.
Key Limitations
Raw monthly values are noisy; Must be smoothed
Tahiti values prior to 1935 should be used with appropriate caution.
SOI Data provided by the Climate Analysis Section, NCAR, Boulder, USA, Trenberth (1984). Updated regularly. Accessed DD Month YYYY [list date you accessed the data].
[Note: In the file list below, the netCDF file is the most up-to-date.]
- Monthly Darwin SLP anomalies
Missing Value
-99.9Units
hPaUpdated Through
2025-03-31Next Update
2026-04-15Start Date
1866-01-01File Notes
contains the Darwin slp anomalies. The anomalies were based upon the monthly means for the 1951 to 1980 period. 1882-present data are from the NOAA Climate Prediction Center: ftp://ftp.cpc.ncep.noaa.gov/wd52dg/data/indices/darwin.his and ftp://ftp.cpc.ncep.noaa.gov/wd52dg/data/indices/darwin 1866-1881 data are from the Climatic Research Unit: http://www.cru.uea.ac.uk/cru/data/soi/CAS Citation
SOI Data provided by the Climate Analysis Section, NCAR, Boulder, USA, Trenberth (1984). Updated regularly. Accessed DD Month YYYY [list date you accessed the data]. - Monthly Darwin SLP data
Missing Value
-99.9Units
-1000 hPaUpdated Through
2025-03-31Next Update
2026-04-15Start Date
1866-01-01File Notes
contains the Darwin slp data. (add 1000 to get the value in hPa, e.g 7.2 for 1866-01 is 1007.2 hPa) 1882-present data are from the NOAA Climate Prediction Center: ftp://ftp.cpc.ncep.noaa.gov/wd52dg/data/indices/darwin.his and ftp://ftp.cpc.ncep.noaa.gov/wd52dg/data/indices/darwin 1866-1881 data are from the Climatic Research Unit: http://www.cru.uea.ac.uk/cru/data/soi/CAS Citation
SOI Data provided by the Climate Analysis Section, NCAR, Boulder, USA, Trenberth (1984). Updated regularly. Accessed DD Month YYYY [list date you accessed the data]. - Monthly Darwin SOI based on annual standardization
Missing Value
-99.9Units
std.dev.Updated Through
2025-03-01Next Update
2026-04-15Start Date
1866-01-01File Notes
contains the Darwin only SOI (- Standardized Darwin) where the standardizing is done using the approach outlined by Trenberth (1984). To maximize the signal, the monthly anomalies were standardized using standard deviations of annual means. This index (*-1) is sometimes used as a proxy for the full SOI, as the quality of Tahiti data before ~1935 has been questioned.CAS Citation
SOI Data provided by the Climate Analysis Section, NCAR, Boulder, USA, Trenberth (1984). Updated regularly. Accessed DD Month YYYY [list date you accessed the data]. - Monthly Darwin SOI based on monthly standardization
Missing Value
-99.9Units
std.dev.Updated Through
2025-03-01Next Update
2026-04-15Start Date
1866-01-01File Notes
contains the Darwin only SOI (- Standardized Darwin) where the standardizing is done using the approach outlined by Trenberth (1984). This index (*-1) is sometimes used as a proxy for the full SOI, as the quality of Tahiti data before ~1935 has been questioned.CAS Citation
SOI Data provided by the Climate Analysis Section, NCAR, Boulder, USA, Trenberth (1984). Updated regularly. Accessed DD Month YYYY [list date you accessed the data]. - Monthly noise SOI based on annual standardization
Missing Value
-99.9Units
std.dev.Updated Through
2025-03-31Next Update
2026-04-15Start Date
1866-01-01File Notes
contains the noise-SOI (Standardized Tahiti + Standardized Darwin) where the standardizing is done using the approach outlined by Trenberth (1984). To maximize the signal, the monthly anomalies were standardized using standard deviations of annual means.CAS Citation
SOI Data provided by the Climate Analysis Section, NCAR, Boulder, USA, Trenberth (1984). Updated regularly. Accessed DD Month YYYY [list date you accessed the data]. - Monthly noise SOI based on monthly standardization
Missing Value
-99.9Units
std.dev.Updated Through
2025-03-31Next Update
2026-04-15Start Date
1866-01-01File Notes
contains the noise-SOI (Standardized Tahiti + Standardized Darwin) where the standardizing is done using the approach outlined by Trenberth (1984).CAS Citation
SOI Data provided by the Climate Analysis Section, NCAR, Boulder, USA, Trenberth (1984). Updated regularly. Accessed DD Month YYYY [list date you accessed the data]. - Monthly signal SOI based on annual standardization
Missing Value
-99.9Units
std.dev.Updated Through
2025-03-31Next Update
2026-04-15Start Date
1866-01-01File Notes
contains the SOI (Standardized Tahiti -- Standardized Darwin) where the standardizing is done using the approach outlined by Trenberth (1984). To maximize the signal, the monthly anomalies were standardized using standard deviations of annual means. Data Note: The SOI values prior to 1935 should be used with caution. There are questions regarding the consistency and quality of the Tahiti pressure values prior to 1935. Using the "Darwin SOI" provides an excellent proxy for the standard SOI [T-D].CAS Citation
SOI Data provided by the Climate Analysis Section, NCAR, Boulder, USA, Trenberth (1984). Updated regularly. Accessed DD Month YYYY [list date you accessed the data]. - Monthly signal SOI based on monthly standardization
Missing Value
-99.9Units
std.dev.Updated Through
2025-03-31Next Update
2026-04-15Start Date
1866-01-01File Notes
contains the standard SOI (Standardized Tahiti -- Standardized Darwin) where the standardizing is done using the approach outlined by Trenberth (1984) to maximize the signal. SOI calculation: For Tahiti and Darwin: [1] Compute a monthly SLP climatology for an arbitrary period; [2] Compute monthly anomalies from the monthly climatology; [3] Compute the standard deviation of all monthly anomalies over the climatologicaal period; [4] Divide each anomaly by the overall standard deviation; [5] Compute [T-D] and [T+D]. The SOI values are similar to those calculated by the Climate Prediction Center. However, there are differences due to different SLP datasets, different normalization methods and different base periods used to derive the climatologies. Data Note: The SOI values prior to 1935 should be used with caution. There are questions regarding the consistency and quality of the Tahiti pressure values prior to 1935. Using the "Darwin SOI" provides an excellent proxy for the standard SOI [T-D].CAS Citation
SOI Data provided by the Climate Analysis Section, NCAR, Boulder, USA, Trenberth (1984). Updated regularly. Accessed DD Month YYYY [list date you accessed the data]. - Monthly Tahiti SLP anomalies
Missing Value
-99.9Units
hPaUpdated Through
2025-03-31Next Update
2026-04-15Start Date
1866-01-01File Notes
contains the Tahiti slp anomalies. The anomalies were based upon the monthly means for the 1951 to 1980 period. 1882-present data are from the NOAA Climate Prediction Center: ftp://ftp.cpc.ncep.noaa.gov/wd52dg/data/indices/tahiti.his and ftp://ftp.cpc.ncep.noaa.gov/wd52dg/data/indices/tahiti 1866-1881 data are from the Climatic Research Unit: http://www.cru.uea.ac.uk/cru/data/soi/CAS Citation
SOI Data provided by the Climate Analysis Section, NCAR, Boulder, USA, Trenberth (1984). Updated regularly. Accessed DD Month YYYY [list date you accessed the data]. - Monthly Tahiti SLP data
Missing Value
-99.9Units
-1000 hPaUpdated Through
2025-03-31Next Update
2026-04-15Start Date
1866-01-01File Notes
contains the Tahiti slp data. (add 1000 to get the value in hPa, e.g 10.6 for 1866-01 is 1010.6 hPa) 1882-present data are from the NOAA Climate Prediction Center: ftp://ftp.cpc.ncep.noaa.gov/wd52dg/data/indices/tahiti.his and ftp://ftp.cpc.ncep.noaa.gov/wd52dg/data/indices/tahiti 1866-1881 data are from the Climatic Research Unit: http://www.cru.uea.ac.uk/cru/data/soi/CAS Citation
SOI Data provided by the Climate Analysis Section, NCAR, Boulder, USA, Trenberth (1984). Updated regularly. Accessed DD Month YYYY [list date you accessed the data]. - SOI.nc
Missing Value
-999Units
Updated Through
2025-03-31Next Update
2026-04-15Start Date
1866-01-01File Notes
Contains all of the SOI indices in one netcdf file. This file is the most up-to-date.CAS Citation
SOI Data provided by the Climate Analysis Section, NCAR, Boulder, USA, Trenberth (1984). Updated regularly. Accessed DD Month YYYY [list date you accessed the data].
- See the list of "Hosted Climate Index Files" below. The last file on the list, SOI.nc, tends to be the most up-to-date.
Expert Developer Guidance
The following was contributed by Dr. Kevin Trenbeth, August, 2015:
The analysis of teleconnections has typically employed a linear perspective, which assumes a basic spatial pattern with varying amplitude and mirror image positive and negative polarities. In the Northern Hemisphere, one-point correlation maps can be used to illustrate the Pacific-North American (PNA) pattern and the NAO. Teleconnections are best defined over a grid, but simple indices based on a few key station locations remain attractive, as the series can often be carried back in time long before complete gridded fields are available; the disadvantage is increased noise from the reduced spatial sampling. Generally it is desirable to normalize the values so that each location has equal variance in the index, and to retain the seasonal cycle, an annual mean standard deviation is often best.
For several indices, two stations at opposite poles in the centers of action are used in combination to define the time series and associated pattern. Examples are the Southern Oscillation Index, which uses sea level pressures at Darwin, Australia and Tahiti in the South Pacific, and the North Atlantic Oscillation, which uses Lisbon, Portugal and Stykkisholmur/Reykjavik, Iceland. The NAO is primarily a north-south dipole in sea level pressure characterised by simultaneous out-of-phase pressure and height anomalies between temperate and high latitudes over the Atlantic sector, and therefore corresponds to changes in the westerlies across the North Atlantic into Europe.
Each station can obviously be affected by local storms and other phenomena, such as the Madden-Julian Oscillation for the tropics, and therefore station-based indices contain noise. If the index S = TN –DN, (for example, S=SOI, and D and T refer to Darwin and Tahiti, and the subscript N means they are normalized), then a measure of the noise is N = TN + DN. The ratio of the variance of the signal and noise time series provides a metric of how useful such a simple index is. Tracking both signal and noise can also help the user from being led astray. ##
Cite this page
Acknowledgement of any material taken from or knowledge gained from this page is appreciated:
Trenberth, Kevin & National Center for Atmospheric Research Staff (Eds). Last modified "The Climate Data Guide: Southern Oscillation Indices: Signal, Noise and Tahiti/Darwin SLP (SOI).” Retrieved from https://climatedataguide.ucar.edu/climate-data/southern-oscillation-indices-signal-noise-and-tahitidarwin-slp-soi on 2026-02-16.
Citation of datasets is separate and should be done according to the data providers' instructions. If known to us, data citation instructions are given in the Data Access section, above.
Acknowledgement of the Climate Data Guide project is also appreciated:
Schneider, D. P., C. Deser, J. Fasullo, and K. E. Trenberth, 2013: Climate Data Guide Spurs Discovery and Understanding. Eos Trans. AGU, 94, 121–122, https://doi.org/10.1002/2013eo130001
Other Information
- Trenberth, K. E., 1984: Signal versus noise in the Southern Oscillation, Mon. Wea. Rev.,. 112, 326-332
- Trenberth, K.E. and T.J. Hoar, 1996: The 1990-1995 El Nino-Southern Oscillation Event Longest on Record, Geophysical Research Letters 23:57-60
- Ropelewski, C.F., and P.D. Jones, 1987: An Extension of the Tahiti-Darwin Southern Oscillation Index, Monthly Weather Review, 115:2161-2165
- Trenberth, Kevin E., Julie M. Caron, 2000: The Southern Oscillation Revisited: Sea Level Pressures, Surface Temperatures, and Precipitation. J. Climate, 13, 4358–4365.
- Konnen et al (1998): Pre-1866 Extensions of the Southern Oscillation Index Using Early Indonesian and Tahitian Meteorological Readings. . J. Climate, 11, 2325–2339.
