U.S. Climate Extremes Index (CEI)

The U.S. Climate Extremes Index (CEI) was first presented in 1995 as a framework for quantifying observed changes in climate within the contiguous United States. At present, the CEI evaluates the percent area of extremes in the distribution of much above/below average (top/bottom 10% of occurrence) temperatures, precipitation, drought, and tropical cyclone wind speed across the CONUS and is measured as the percent area of the U.S./region experiencing extremes for a given season. CEI is evaluated for eight standard seasons: spring, summer, autumn, winter, annual, cold season, warm season, and hurricane season. NOAA has also developed a regional CEI, providing data for 9 regions of the contiguous US.
The CEI was first introduced with the goal of summarizing and presenting a complex set of multivariate and multidimensional climate variables in the United States so that the results could be easily understood and used in policy decisions made by non-specialists in the field (Karl et al. 1996). The contiguous U.S. (CONUS) was selected as the focus for this study in part since climate is of great interest to U.S. citizens and policy makers and since detecting changes in climate within the U.S. at that time had not been given extensive coverage in intergovernmental or national reports which focus on climate change assessments (IPCC 2001; NRC 1992; NRC 2001).
Key Strengths
Provides concise, easy to understand overview of climate extremes across the continental United States
The CEI is not limited to extremes in only temperature, precipitation, drought, and tropical cyclone wind speeds. Other datasets could be evaluated and added to the current set of indicators.
Individual CEI indicators can be evaluated in addition to the composite index. This allows the user to look closely at factors which contribute to either an elevated or smaller than average percentage of extremes across the CONUS over a given time period.
Key Limitations
The current version captures purely meteorological events only; does not track cascading impacts such as wildfires or floods
Compositing (adding) extremes from different indicators can mute extremes signals from one or more indicators. For this reason, it is a good practice to not only evaluate the composite CEI, but also assess the individual indicators which comprise the CEI. Subtracting the lower extreme from the upper extreme within an indicator (or vice versa) can provide insight into whether there is a trend for warming/cooling or wet/dry extremes.
Despite the CEI results being fairly easy to interpret, it is challenging to explain the methodology for computing the fourth indicator, which interrogates extreme 1-day precipitation events.
Please cite NOAA/NCEI
Expert Developer Guidance
The following was contributed by Karin Gleason, August, 2019:
The Climate Extremes Index (CEI) is often used to quantify recent extremes in observed temperatures, precipitation, and drought across the CONUS and is computed on a monthly basis as part of NCEI’s monthly monitoring process. The CEI is computed for the annual, warm, cold, hurricane, spring, summer, autumn, and winter seasons as well as for the most recent year-to-date period. The NCEI website allows a user to select the region and period of interest as well as individual indicator or composite results. Output consist of downloadable extremes values as well as maps and graphs of recent and historical extremes.
Data Used:The U.S. CEI is based on an aggregate set of conventional climate extreme indicators which, at the present time, include the following types of data:
| Element | Source |
| Monthly Maximum and Minimum Temperature | NCEI nClimGrid5 km dataset |
| Daily Precipitation | GHCN-Dailydataset |
| Monthly Palmer Drought Severity Index (PDSI) | NCEI nClimDivdataset |
| Tropical Storm & Hurricane Winds | National Hurricane Center – North Atlantic Hurricane Database (HURDAT) |
CEI Defined:The U.S. CEI is the arithmetic average of the following five or six# indicators of the percentage of the conterminous U.S. area:
- The sum of (a) percentage of the United States with maximum temperatures much below normal and (b) percentage of the United States with maximum temperatures much above normal.
- The sum of (a) percentage of the United States with minimum temperatures much below normal and (b) percentage of the United States with minimum temperatures much above normal.
- The sum of (a) percentage of the United States in severe drought (equivalent to the lowest tenth percentile) based on the PDSI and (b) percentage of the United States with severe moisture surplus (equivalent to the highest tenth percentile) based on the PDSI.
- Twice the value of the percentage of the United States with a much greater than normal proportion of precipitation derived from extreme (equivalent to the highest tenth percentile) 1-day precipitation events.
- The sum of (a) percentage of the United States with a much greater than normal number of days with precipitation and (b) percentage of the United States with a much greater than normal number of days without precipitation.
- The sum of squares of U.S. landfalling tropical storm and hurricane wind velocities scaled to the mean of the first five indicators.
# The sixth indicator is only utilized when the period of interest includes months with regular tropical activity. For practical purposes, the CEI does not include the sixth indicator for the cold season (Oct-Mar), winter (Dec-Feb) or spring (Mar-May). It also cannot be calculated independent of the first five indicators.
We define much above (below) normal or extreme conditions as those falling in the upper (lower) tenth percentile of the local, period of record. In any given year, each of the five indicators has an expected value of 20%, in that 10% of all observed values should fall, in the long-term average, in each tenth percentile, and there are two such sets in each indicator. The fourth indicator, related to extreme precipitation events, has an opposite phase that cannot be considered extreme: the fraction of the country with a much below normal percentage of annual precipitation derived from extreme (i.e. zero) 1-day precipitation amounts. Hence, the fourth indicator is multiplied by twice its value to give it an expected value of 20%, comparable to the first four indicators. In the case of tropical systems, any landfalling system is considered extreme. Since precipitation from such a system is already accounted for in the precipitation steps and can also affect the PDSI, wind velocity at the time of landfall is the focus for this indicator. The square of the wind velocity of each tropical storm and hurricane at the time of landfall is used since a linear increase in wind velocity corresponds more closely to an exponential increase in wind impact and damage. Because this step only accounts for the strength and frequency of tropical systems at landfall (and could not theoretically affect 100% of the nation), it was necessary to scale the step 6 time series to make it comparable to the other five steps. This is done by setting the mean of the time series to that of the other five steps. A CEI both with and without the tropical cyclone indicator is made available in the plots below.
A value of 0% for the CEI, the lower limit, indicates that no portion of the period of record was subject to any of the extremes of temperature or precipitation considered in the index. In contrast, a value of 100% would mean that the entire country or region evaluated had extreme conditions throughout the year for each of the five/six indicators, a virtually impossible scenario. The long-term variation or change of this index represents the tendency for extremes of climate to either decrease, increase, or remain the same.
Key Strengths:
- The index value is a percentage of extremes over a given area, which is fairly easy to understand.
- The CEI is not limited to extremes in only temperature, precipitation, drought, and tropical cyclone wind speeds. This index has been constructed such that other datasets could be evaluated and added to the current set of indicators.
- Individual CEI indicators can be evaluated in addition to the composite index. This allows the user to look closely at factors which contribute to either an elevated or smaller than average percentage of extremes across the CONUS over a given time period.
Key Limitations:
- Compositing (adding) extremes from different indicators can mute extremes signals from one or more indicators. For this reason, it is a good practice to not only evaluate the composite CEI, but also assess the individual indicators which comprise the CEI. Subtracting the lower extreme from the upper extreme within an indicator (or vice versa) can provide insight into whether there is a trend for warming/cooling or wet/dry extremes.
- Despite the CEI results being fairly easy to interpret, it is challenging to explain the methodology for computing the fourth indicator, which interrogates extreme 1-day precipitation events.
- The sixth indicator, related to the strength of tropical cyclone winds at landfall, is not applicable across the entire CONUS, like the other five indicators. Therefore, the extreme “percentage” for the sixth indicator is scaled to the mean of the other five indicators and doesn’t represent a percent of the CONUS experiencing tropical cyclone extremes. It also is not computed for all standard seasons since tropical cyclones are not active in all months. It is for these reasons, the user has access to both CEI composites with and without this indicator included.
##
Cite this page
Acknowledgement of any material taken from or knowledge gained from this page is appreciated:
Gleason, Karin & National Center for Atmospheric Research Staff (Eds). Last modified "The Climate Data Guide: U.S. Climate Extremes Index (CEI).” Retrieved from https://climatedataguide.ucar.edu/climate-data/us-climate-extremes-index-cei on 2026-03-01.
Citation of datasets is separate and should be done according to the data providers' instructions. If known to us, data citation instructions are given in the Data Access section, above.
Acknowledgement of the Climate Data Guide project is also appreciated:
Schneider, D. P., C. Deser, J. Fasullo, and K. E. Trenberth, 2013: Climate Data Guide Spurs Discovery and Understanding. Eos Trans. AGU, 94, 121–122, https://doi.org/10.1002/2013eo130001
Key Figures
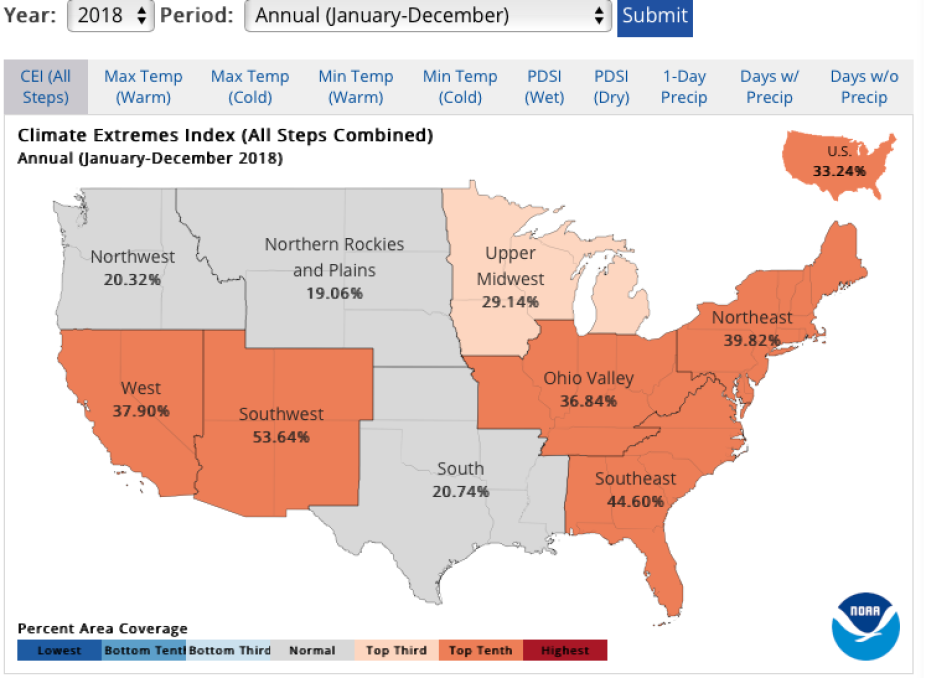
Regional CEI values for the 2018 Annual period. The colors in each region correspond to the relative position of this percentage in the distribution of the long-term record where the value can be found (above/below/near average).
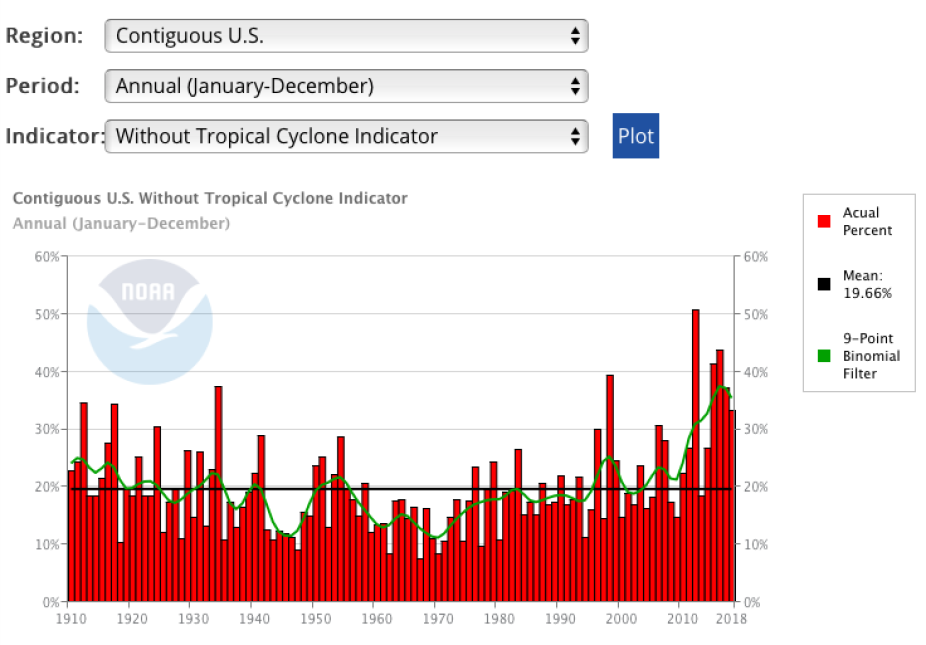
Caption: Time series graph of the CONUS annual composite CEI values from 1910 – 2018. Red bars are varying annual extremes percentages. The black line is the long-term average (~20%) and the green line is a smoothed average. (https://www.ncdc.noaa.gov/extremes/cei/regional-overview/2018/01-12/cei…; accessed December 2019)
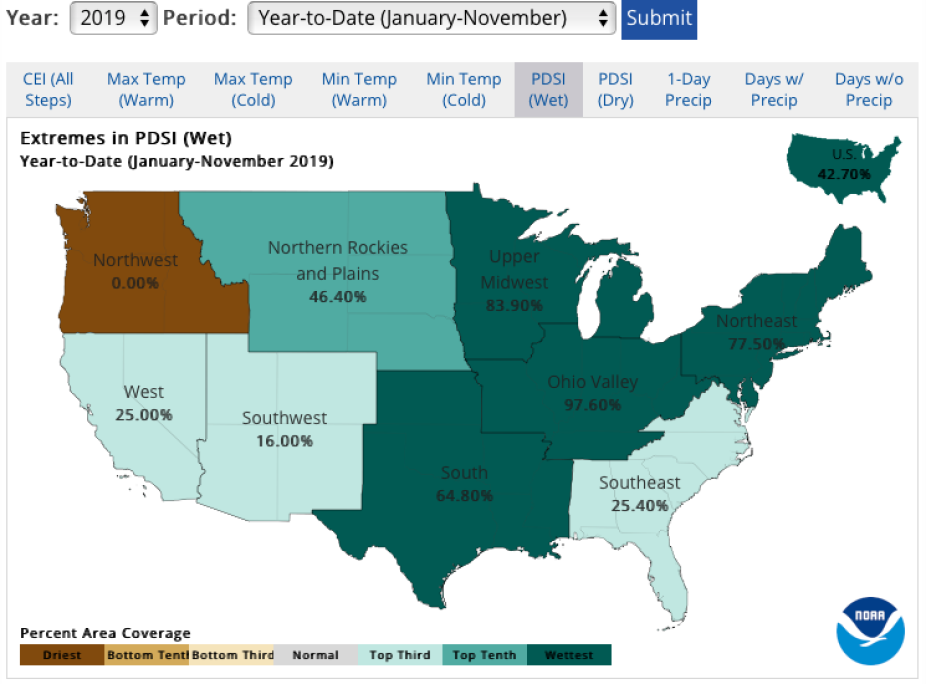
Caption: Regional CEI values for the wet PDSI indicator during the January-November 2019 (year-to-date) period. The colors in each region correspond to the relative position of this percentage in the distribution of the long-term record where the value can be found (above/below/near average). For this period, the Upper Midwest and the Ohio Valley regions experienced their highest (most extreme) percentage values in the period of record (1910 – present). More than 97% of the Ohio Valley experienced extremes in wet PDSI values (wettest 10%) and the Upper Midwest saw 84% of the region in wet PDSI extremes. The historical average value for wet PDSI is approximately 10% for each region. (https://www.ncdc.noaa.gov/extremes/cei/regional-overview/2018/01-12/cei…; accessed December 2019)
Other Information
- Gleason, K. L., J. H. Lawrimore, D. H. Levinson, T. R. Karl, and D. J. Karoly, 2008: A Revised U.S. Climate Extremes Index. Journal of Climate, 21, 2124–2137
- IPCC, 2001: Climate Change 2001: The Scientific Basis. Contribution of Working Group I to the Third Assessment Report of the Intergovermental Panel on Climate Change
- Karl, T.R., and W.J. Koss, 1984: "Regional and National Monthly, Seasonal, and Annual Temperature Weighted by Area, 1895-1983." Historical Climatology Series 4-3, National Climatic Data Center, Asheville, NC, 38 pp.
- Karl, T. R., R. W. Knight, D. R. Easterling, and R. G. Quayle, 1996: Indices of Climate Change for the United States. Bulletin of the American Meteorological Society, 77, 279–292.
- NRC, 1992: Policy Implications of Greenhouse Warming: Mitigation, Adaptation, and the Science Base. National Academy Press, 918 pp.
- NRC, 2001: Climate Change Science: An Analysis of Some Key Questions. National Academy Press, 42 pp.
- Vose, R. S., and Coauthors, 2014: Improved Historical Temperature and Precipitation Time Series for U.S. Climate Divisions. Journal of Applied Meteorology and Climatology, 53, 1232–1251